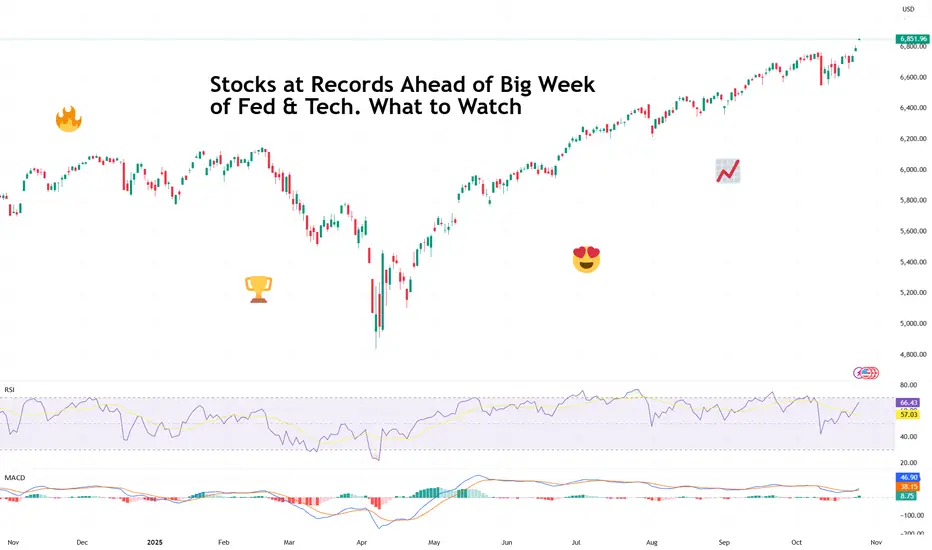
Stocks at Records Ahead of Big Week of Fed & Tech. What to WatchRecord highs, rate-cut optimism, five tech giants on deck — what a time to be a market participant!
It’s Monday, and Wall Street is back doing what it does best — setting new records and pretending not to worry about what comes next.
After a cooler-than-expected inflation print and some diplomat
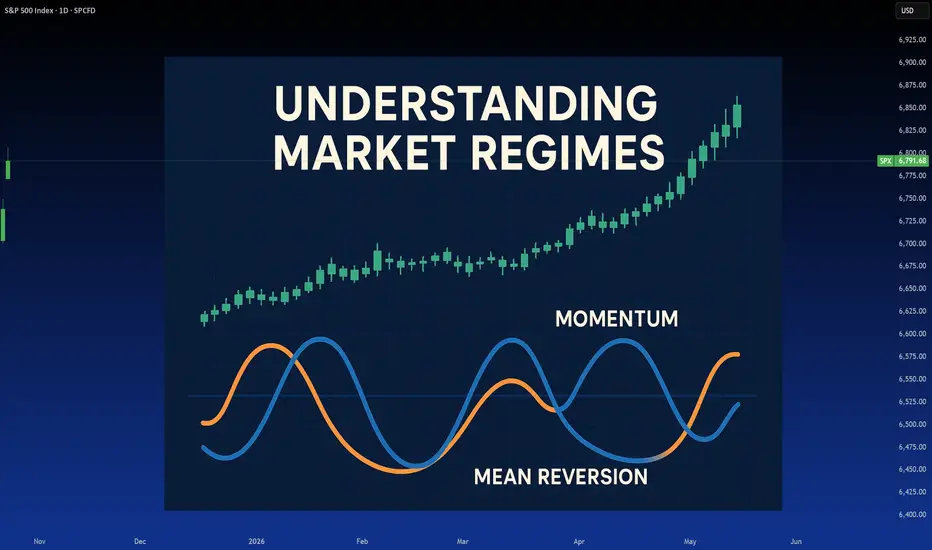
Market Regimes: What they are and why they matterRegimens, what are they and why they matter?
Most traders, especially new ones, don’t understand trading regimens. This is actually normal. Even as a quant based trader with higher education in stats/sciences, I learned of Regimen trading later in my trading career, having successfully navigated
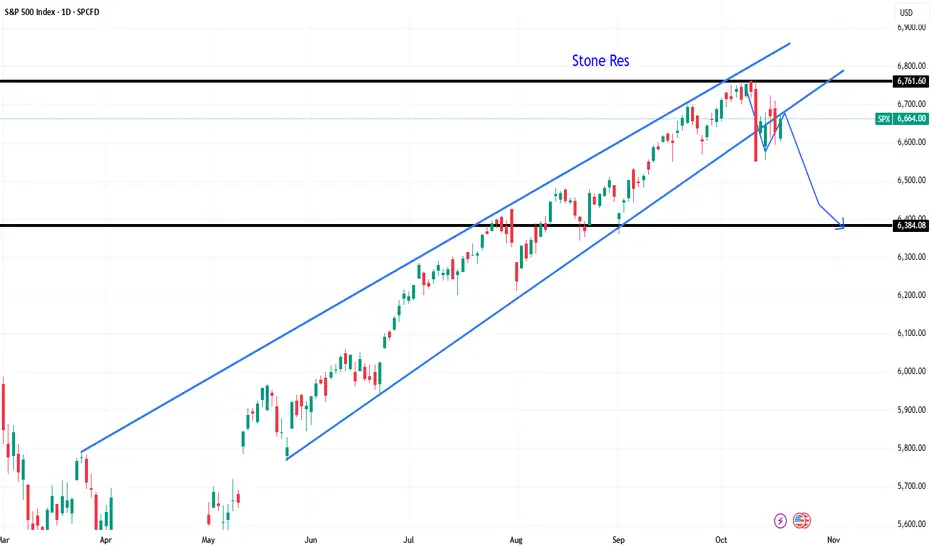
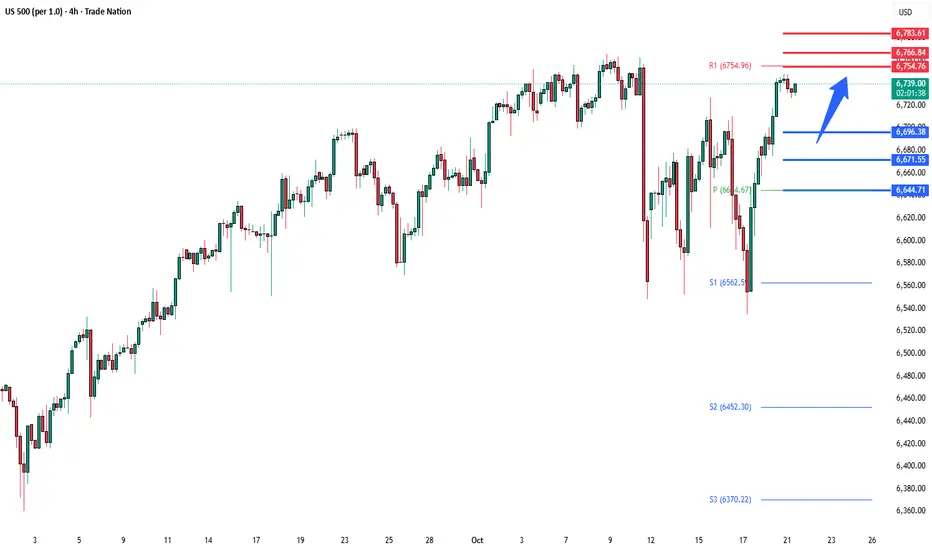
Crash still to come . eps 2As i said in last analyse . As long as 6760 hold which equal 720 Gann angle
we are going dn
first target was hit @ 6530
then ...
the price has rebound from 6530 which = 630 Gann angle
again , if 6760 hold we are going to 2nd target @ 6350 which = 540 angle
* If you like . give a push , for mor
SPX500 ShortElite Analysis
Short on spx500, price gave us the reversal after liquidation of asia high on 1m tf
Targeting lower liquidity pools

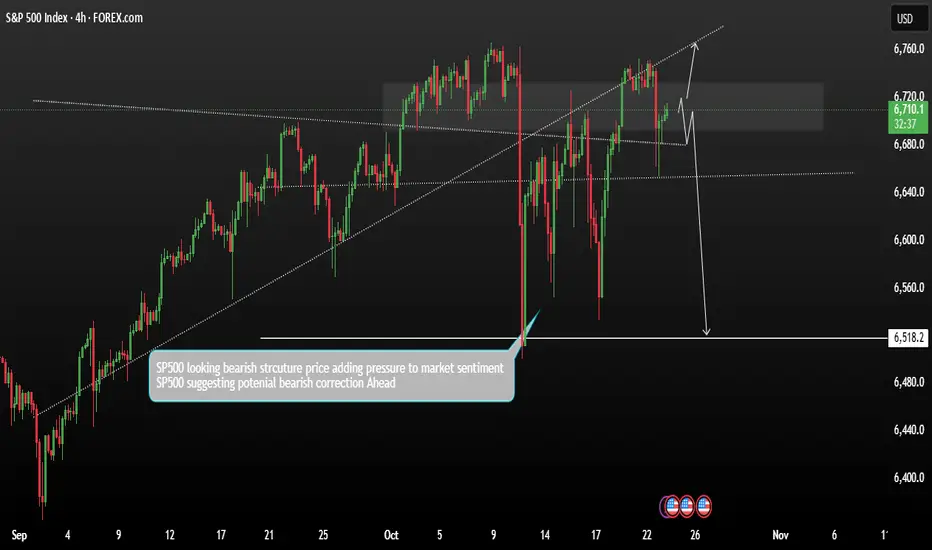
SP500 currently showing bearish trend structureThe NASDAQ 100 is currently showing signs of price consolidation within a bearish trend structure. Selling pressure continues to build as price action remains capped below key resistance levels.
While short-term fluctuations may occur during earnings releases, technical indicators suggest that the
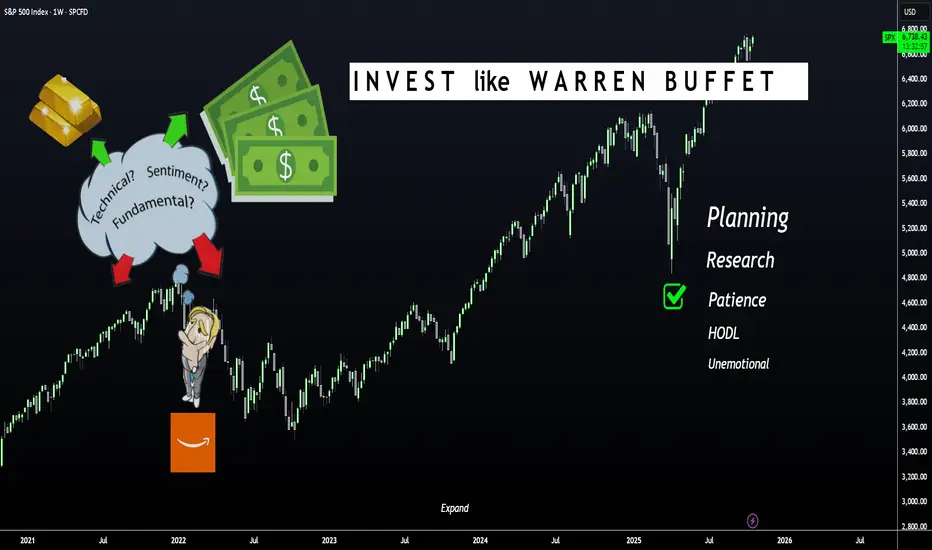
LEARN to INVEST Like Warren BuffetHello Stock Traders and Speculators 📈📢
If you trade and or watch stocks, commodities and/or ETF's then this one is for you!
Warren Buffett is probably one of the most successful investors of all time. Over the years, he has developed a set of principles and strategies over his career. He was ins
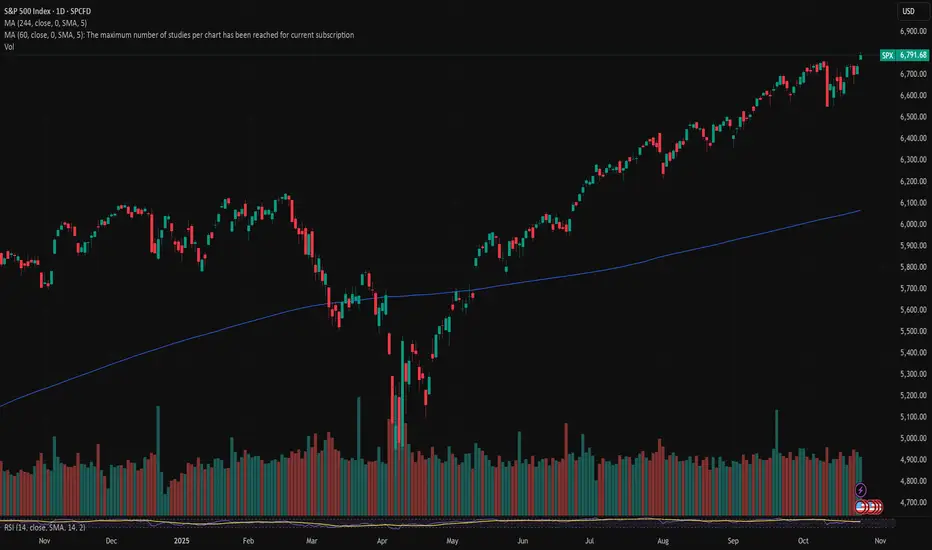
SPX: S&P500 An Economical Reset Again?Technically, the chart is vivid and self-explanatory.
The RSI (14) is implicating an obvious Negative Divergence before the last downturn and the chart recent structure.
The US treasury has no other option but printing more and more bucks, or cutting the interest rates. I don't know any other fina

SPX - The Road to 6900 Begins “History never repeats itself. Man always does.”
A deep look into SPX History exposes the path of a market cycle and tells us the truth on where markets are headed.
Percentages don't lie.
See you guys at 6900!

S&P500 Risk appetite improved, supported by easing inflationMarkets extended their rally yesterday, with the S&P 500 up 1.07%, closing just shy of record highs, while 30yr US Treasury yields fell to a 6-month low of 4.57%. The upbeat tone was driven by positive trade headlines, reduced shutdown fears, and lower oil prices — Brent crude slipped to $61.01/bbl,
SPX: Back to the old path?Although a trading week on the US equity markets was a bit uncertain, still, Friday's US inflation figures brought back market optimism and pushed the S&P 500 to another all-time highest level during this year. Posted data showed that inflation was holding relatively firmly in September at the level
See all ideas
Displays a symbol's price movements over previous years to identify recurring trends.
Frequently Asked Questions
S&P Index Cash CFD (USD) reached its highest quote on Oct 24, 2025 — 6,811.64 USD. See more data on the S&P Index Cash CFD (USD) chart.
The lowest ever quote of S&P Index Cash CFD (USD) is 2,177.62 USD. It was reached on Mar 23, 2020. See more data on the S&P Index Cash CFD (USD) chart.
S&P Index Cash CFD (USD) is just a number that lets you track performance of the instruments comprising the index, so you can't invest in it directly. But you can buy S&P Index Cash CFD (USD) futures or funds or invest in its components.