CMCSA has broken the heads and shouldersCMCSA has broken down from the head and shoulders pattern. This is a bearish technical sign. This chart pattern is quite large and suggests significant weakness ahead.
Key facts today
4,155.07
0.01 BRL
87.29 B BRL
667.03 B BRL
About Comcast Corporation
Sector
Industry
CEO
Brian L. Roberts
Website
Headquarters
Philadelphia
Founded
1963
ISIN
BRCMCSBDR008
FIGI
BBG002H1HQN3
Comcast Corp. engages in the provision of video, Internet, and phone services. It operates through the following segments: Residential Connectivity and Platforms, Business Services Connectivity, Media, Studios, and Theme Parks. The Residential Connectivity and Platforms segment consists of residential broadband and wireless services and Sky-branded entertainment television networks and advertising. The Business Service Connectivity segment offers broadband, wireline voice and wireless services through small to medium customers and large enterprises through the HFC network. The Media segment consists of NBCUniversal’s television and streaming platforms, including national, regional, and international cable networks. The Studios segment focuses on NBCUniversal’s film and television studio production and distribution operations. The Theme Parks segment operates Universal theme parks in Orlando, Florida, Hollywood, California, Osaka, Japan, and Beijing, China. The company was founded by Ralph Roberts in 1963 and is headquartered in Philadelphia, PA.
Related stocks

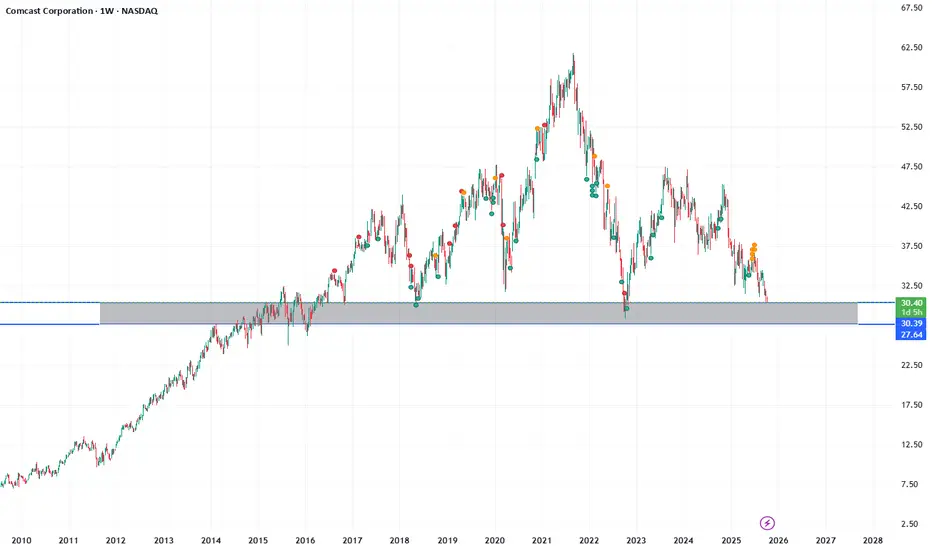
CMCSA multi year low and good supportI think with current valuation CMCSA looks very cheap and after founding solid support should show real performance
HOLD Long term
good dividend
i am not financial advisor
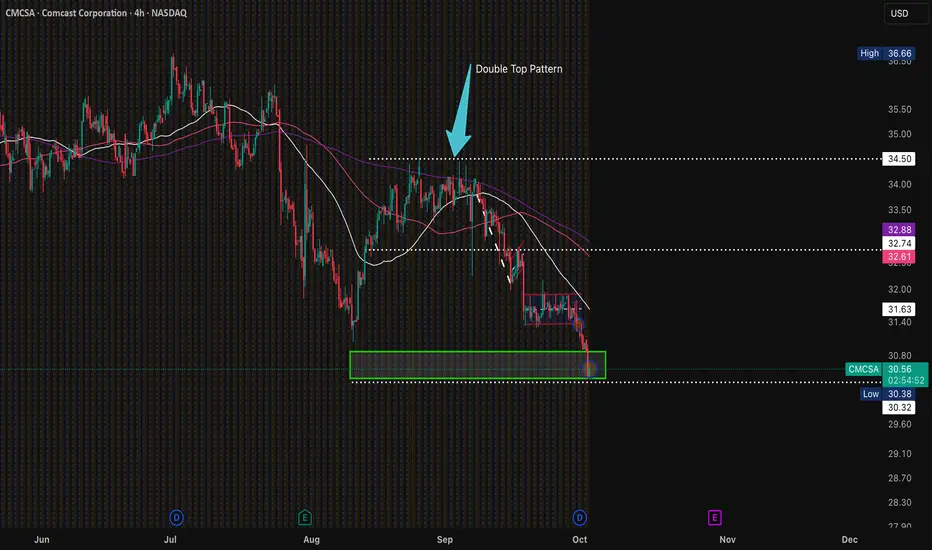
Update on $CMCSA Head & Shoulders on Monthly confirmedThe double top on the 4hr chart helped play out the head and shoulders pattern on the monthly chart. This gives bearish sentiment with the neckline quite obvious here...

$CMCSA looks to make a rebound As we enter the 4Q it is looking as though buyers interest may start picking up soon. Double top pattern is completing. Coupled with Comcast's undervalued metrics (low P/E and favorable value scores cited by analysts) and a solid dividend yield, this technical failure to decline can set the stage fo
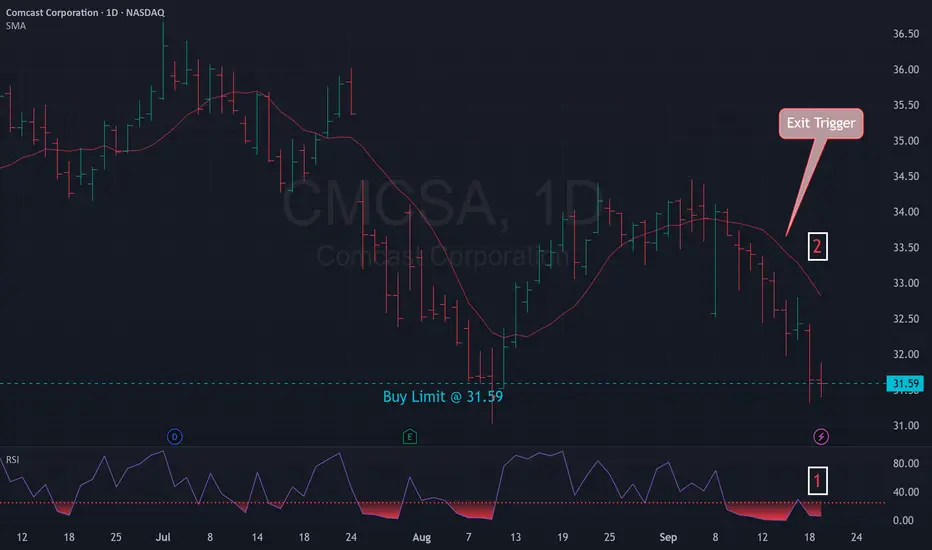
Mean Reversion Setup: CMCSA1. RSI in oversold region
2. Price likely to rebound back the the mean
Trade Rules:
Entry Trigger - RSI has cross below oversold region, enter limit buy at close price
Exit Trigger - Close at market when close price cross above exit trigger (Red Line)
Comcast will go lower the next few years. Sell now and Buy laterComcast has a huge! I mean huge fib level to test on the high time frame charts. This level will act as a magnet lower. We will have up and downs until we get this low (if we do). If it gets this low, It is a huge buy for me. I will need to wait a very long time though, because this is going to

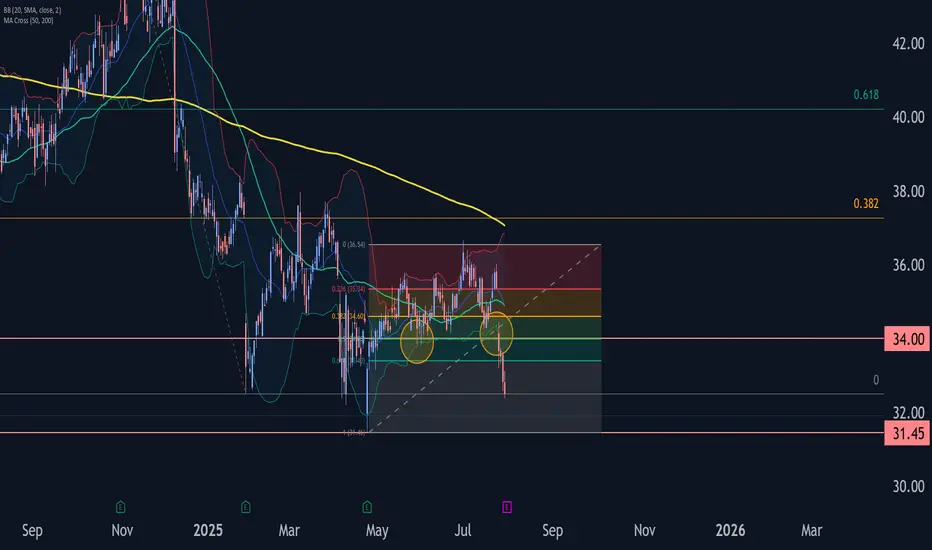
Comcast Wave Analysis – 19 August 2025- Comcast reversed from support zone
- Likely to rise to resistance level 35.35
Comcast recently reversed up from the support zone located between the support level 31.40 (former low of wave (A) from April) and the lower daily Bollinger Band.
The upward reversal from this support zone started the

Comcast Wave Analysis – 30 July 2025- Comcast broke the support zone
- Likely fall to support level 31.45
Comcast recently broke the support zone located between the support level 34.00 (which has been reversing the price from the start of May) and the 50% Fibonacci correction of the upward wave A from April.
The breakout of this su
BUY NOW!! Best time in 10 yearsComm Services and Real Estate have the cheapest Shiller PEs right now in the whole market. CMCSA has a Shiller PE of 10.28 according to GuruFocus, almost at its lowest in 10 years, potentially indicating that this is one of the best times to buy, but lets look at some other factors as well.
The FW

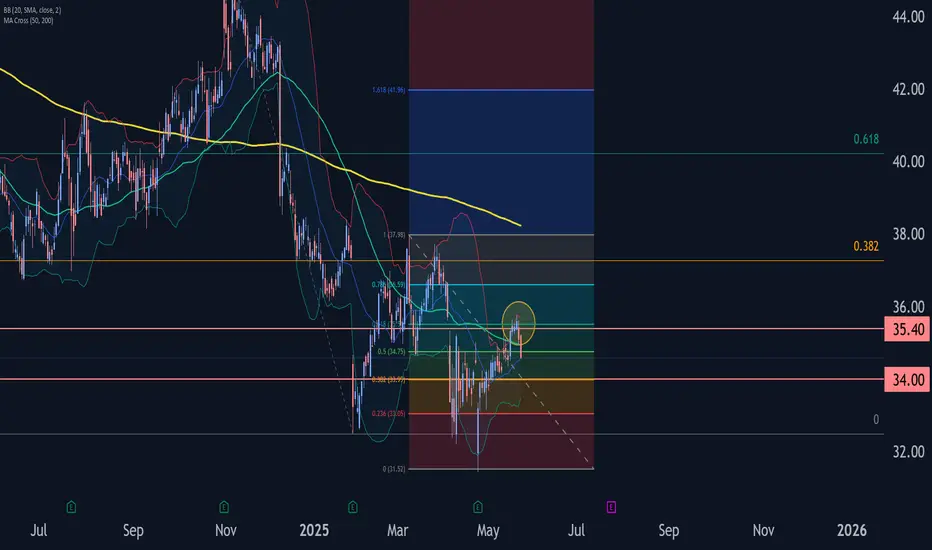
Comcast Wave Analysis – 22 May 2025
- Comcast reversed from resistance area
- Likely to fall to support level 34.00
Comcast recently reversed down from the resistance area between the resistance level 35.40, upper daily Bollinger Band and the 61.8% Fibonacci correction of the downward impulse from November.
The downward reversal fr
See all ideas
Summarizing what the indicators are suggesting.
Oscillators
Neutral
SellBuy
Strong sellStrong buy
Strong sellSellNeutralBuyStrong buy
Oscillators
Neutral
SellBuy
Strong sellStrong buy
Strong sellSellNeutralBuyStrong buy
Summary
Neutral
SellBuy
Strong sellStrong buy
Strong sellSellNeutralBuyStrong buy
Summary
Neutral
SellBuy
Strong sellStrong buy
Strong sellSellNeutralBuyStrong buy
Summary
Neutral
SellBuy
Strong sellStrong buy
Strong sellSellNeutralBuyStrong buy
Moving Averages
Neutral
SellBuy
Strong sellStrong buy
Strong sellSellNeutralBuyStrong buy
Moving Averages
Neutral
SellBuy
Strong sellStrong buy
Strong sellSellNeutralBuyStrong buy
Displays a symbol's price movements over previous years to identify recurring trends.
V
VMGS6214049
Versant Media Group, Inc. 7.25% 30-JAN-2031Yield to maturity
6.83%
Maturity date
Jan 30, 2031
See all CMCS34 bonds


