S&P 500 Futures: Trend Intact, Nothing Suggesting a Top YetDaily chart view on ES (S&P 500 Futures) — the trend remains extremely clean with price holding well above the 5, 10, 20, and 50 MAs. Each pullback has been shallow and met with strong buying, confirming that momentum and structure are still fully bullish.
There’s currently nothing on the chart suggesting exhaustion — no sign of distribution, chop, or weakness through the MA stack. Context across higher timeframes continues to support further upside, and the market structure suggests we could easily continue much higher from here.
“Do you think this trend still has legs, or are we close to topping out?”
“Which path do you see next — Option A or Option B?”
“Are you still buying dips here, or starting to look for reversal signs?”
Bias: Bullish continuation
ISPM2021 trade ideas

Market on Fire: S&P 500 & Nasdaq Rally Towards New HighsWe have a beautiful P-Shape volume profile formed at the top and we broke and closed above it.
The P-shape volume profile is bullish profile that is formed when large volumes are transacted at the highs meaning participants a willing to pay premium price . You can see the POC so close to the top of the VAH
I checked the CVD of the volume on a footprint chart and i see the volume has -ve Delta , which means alot of aggressive sellers transacted there trying to push the price down. Now that they are being squeezed slowly and start closing out their positions, it should fuel the uptrend. i entered the trade soon as we broke and closed above the value area.
Food for thought.. Who was willing to pay the high price to buy from the aggressive sellers?
DEFINITIONS
POC- point of control
VAH- Value area high
CVD- Cumulative Volume Delta
Target is the ExoFade area..Lets see how this trade goes

ES Sunday UpdateHuge gap up that now needs to be filled. If the gap doesn't fill by open, I'm buying more puts Monday. I don't think this is a TACO trade, I think he has to follow through this time.
Gold and Bitcoin both up as well.

Market Analysis: Signs of Weakening Demand in the S&PThe S&P has been showing some interesting characteristics in recent weeks that warrant closer attention. We’re observing a notable shift in market dynamics, with supply increasing while demand has been decreasing. This combination is creating a setup that could lead to increased market volatility in the near term.
As we approach the previous high in the market, it becomes crucial to evaluate the quality of the demand we’re seeing. The concern here is that we may be looking at a lower high formation, which historically has been an indicator of increased volatility on the horizon.
What makes the current situation particularly noteworthy is the pattern of declining demand we’re witnessing. There are now two distinct areas where demand is clearly decreasing. In one area, the demand has remained more or less consistent throughout. However, in another location, we’re seeing what appears to be a local decrease – a temporary decline that may or may not persist.
Looking at the bigger picture, there’s a substantial drop in demand from the highest point to the lowest point we’ve measured. Following that decline, we’re now seeing demand decrease once again. While it’s true that markets can experience periods where demand decreases without major consequences, these patterns don’t typically persist indefinitely. Eventually, these decreases in demand tend to bring some kind of market reaction.
The pattern we’re currently observing appears to confirm this expectation. We’ve already seen what appears to be the largest reaction so far, which shouldn’t come as a surprise to those who have been watching the market closely. In previous analysis, there was anticipation of this exact reaction occurring, and the reason for that expectation was based on clear market signals.
The key evidence lies in a specific area where supply came into the market. When examining the volume in that region, there’s a slight increase relative to the surrounding areas. But what’s particularly telling is what happens next with price action. Over the course of five or six bars, the price essentially goes nowhere. It stalls out despite the presence of volume, which is a significant signal.
Adding to this picture, there are multiple days within this period where the price actually attempts to react downward. These repeated attempts at downward movement, combined with the stalling price action and the presence of supply, paint a picture of a market struggling to maintain its upward momentum.
The convergence of these factors – increasing supply, decreasing demand, stalling price action near previous highs, and repeated attempts at downward reactions – all point toward a market that may be approaching a period of increased volatility. While markets can certainly remain resilient in the face of such conditions, the quality of demand at these levels appears to be deteriorating, which is something that active market participants need to keep on their radar as we move forward.
Disclaimer: This content is for educational purposes only and should not be considered financial advice.

SP500 | High Volume Zone, Watching for Retest and TrapWeeks ago, I marked the blue box as a potential demand zone — you can still see it in my earlier analyses.
Now that price has reached it, the question is simple: will I buy here? Absolutely not.
CDV looks terrible, showing no sign of accumulation. If this zone fails and we get a retest from below, I’ll consider a short position.
It’s also possible that price makes a new ATH just to trap late buyers before reversing — and I’m willing to take that risk.
The last weekly candle was a high-volume bar, and anyone familiar with my methods knows what that means.
When these bars are retested, they often produce high-probability trades. My retest zone sits between 6702 and 6773 dollars.
In short: I expect one more potential push higher before any major correction, but the structure favors waiting for confirmation rather than guessing bottoms.

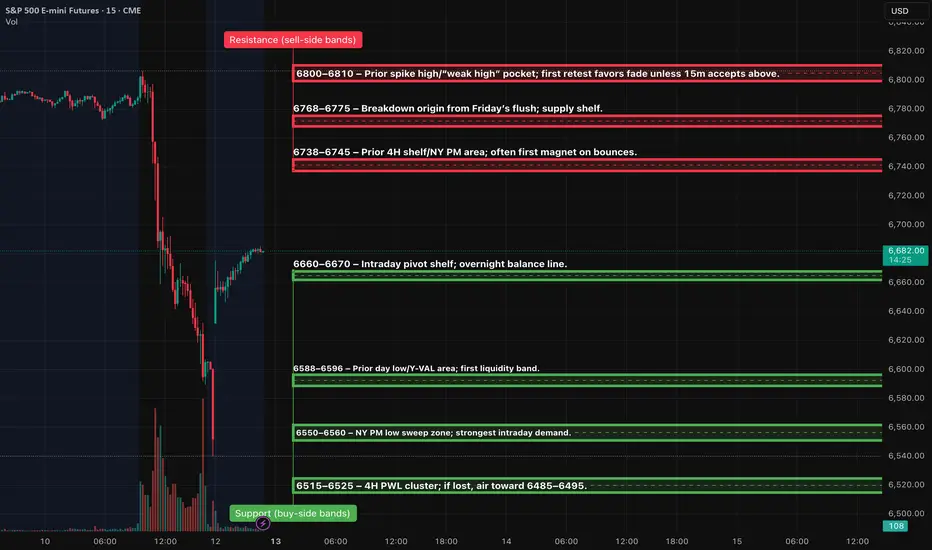
ES (SPX, SPY) Analyses, Key-Zones, Week (Mon 10/13 → Fri 10/17)Macro drivers to watch (ET)
Powell (NABE) — Tue 10/14 ~12:20. Markets will parse tone on growth/inflation. (Fed official calendar confirms time & venue.)
PPI (Sep) — Thu 10/16 8:30. First major U.S. inflation print of the week. (BLS “Next Release”.)
Advance Retail Sales (Sep) — Thu 10/16 8:30. Key read on demand into holiday season. (Census “MARTS” note; FRED release calendar.)
CPI (Sep) — not this week; rescheduled to Fri 10/24 8:30 due to the shutdown. (BLS reschedule notice; CPI schedule.)
Earnings kick-off (could move ES): JPM Tue 10/14, BAC Wed 10/15. (Company IR pages/press.)
Market conditions: U.S. bond market closed Mon 10/13 (liquidity thinner); NYSE equities open. (SIFMA; NYSE hours.)
Options expiration: standard monthly Fri 10/17. Expect pinning flows. (Cboe 2025 calendar.)
Setups (Level-KZ Protocol — 15m→5m→1m; NY kill-zones preferred)
TIER-1 (A++) — Rejection Short at 6790–6810 (NY AM)
Trigger: 15m full-body fails to hold above 6790–6810 → 5m prints a lower-high and re-closes back inside → 1m first pullback “pop-and-fail”.
Entry: 6796–6803 on the 1m failure.
Invalidation: Hard SL above the 15m fail-wick (guide 6814).
TPs: TP1 6738–6745, TP2 6690–6700, TP3 6625–6635.
TIER-1 (A++) — Quick-Reclaim Long at 6550–6560 (Asia/London → carry to NY)
Trigger: Liquidity sweep into 6550–6560, immediate 15m re-close back above 6600, 5m holds ≥6620, 1m higher-low entry.
Entry: 6602–6610 on the first pullback that holds.
Invalidation: Hard SL below the 15m sweep-low (guide 6544).
TPs: TP1 6690–6700, TP2 6738–6745, TP3 6768–6775.
TIER-2 (A+ Bounce) — 6590–6596 fast reclaim
Trigger: Wick through 6590–96 that immediately reclaims ≥6620 on 5m.
Entry/SL: Enter 6615–6622; SL below sweep-low −0.5pt.
Targets: 6690 then 6738–45. ¾ size.
TIER-3 (A Bounce) — 6515–6525 exhaustion flush
Trigger: Capitulation into the 4H PWL band with 15m reversal signal.
Entry/SL: Scale inside the band; SL below the 15m reversal wick.
Targets: 6590–96 then 6690. ½ size; only first touch.
RENEWED US-CHINA TRADE TENSIONS COULD DRAG S&P500 TO ITS MEANWith renewed trade tensions between the US and China creating market uncertainty, the S&P 500 could be pushed significantly lower. The key support level to watch is the 6255 - 6468 range (1), which may act as a buffer. A break below this level could accelerate the move down toward the Feb - Apr 2025 monthly pullback zone (2). In either scenario, this volatility could cause a repricing of many stocks toward their perceived fundamental values.
N.B!
- ES! price might not follow the drawn lines . Actual price movements may likely differ from the forecast.
- Let emotions and sentiments work for you
- ALWAYS Use Proper Risk Management In Your Trades
#S&P500
#nasdaq
#nyse

Smaller range day for MondayThe expectation is a smaller inside the only slightly lower movement in the daily chart of the S&P 500 for Monday's price action

Day 41 — Trading Only S&P Futures | Beating the WhipsawDay 41 of Trading Only S&P Futures closes green across the board: +$1,866 across all accounts, with +$409 booked on my main account.
The market felt wild today with whipsaw moves all over. Instead of forcing trades, I waited it out and stayed patient near breakeven. Toward the end of the session, I finally got high-probability setups — and that made the day.
My trade copier app glitched out, so execution wasn’t perfect across accounts, but the main lesson here is clear: patience beats trying to fight the chop.
📰 News Highlights
DOW, S&P 500 and NASDAQ end higher as government shutdown looms
🔑 Key Levels for Tomorrow
Above 6720 = Flip Bullish
Below 6695 = Flip Bearish

ES - October 1st - Daily Trade PlanOctober 1st - 6am EST
*Before reading this trade plan, IF, you did not read yesterdays, or the Weekly Trade Plan take the time to read it first! (You can see both posts in the related publication section) *
If my posts provide quality information that has helped you with your trading journey. Feel free to boost it for others to find and learn, also!
My daily trade plan and real-time notes that I post are intended for myself to easily be able to go back and review my plan and how I did from an execution perspective.
------------------------------------------------------------------------------------------------------------
Yesterday, was a very choppy tight range that since last Thursday had been getting bought up around the 6693-6705 zone.
I wrote yesterday "Our overnight session high was 6717 and our low is 6694. I said yesterday that we need to clear 6722 for bulls to continue to push price higher. IF, price loses 6684 that is a warning sign. Guess, what? 6684 area will be a big focus today, IMO.
I will be looking for price to flush to 6680-84, reclaim 6688 and head up the levels. We could also flush 6694, hit 6688 and the reclaim of 6694-96 would be a great spot also.
The reclaim of 6705-07 should get us a few points to retest 6716-17 at the overnight high. Above that and we should retest the weekly highs at 6736, IF, we can clear 6722 area."
While my plan did not flush 6680-84, we did flush the 6692-96 zone and that was the area that Institutions kept buying. I also said that IF, we clear 6722 we should retest the 6736 weekly high and we did that in the last hour of trading and rallied to 6743 and then sold off.
------------------------------------------------------------------------------------------------------------------
When we close the day at the highs, I like to post my Daily Trade Plan after the overnight session, because it gives me an opportunity to see what price action looks like as we get ready for the day. What has happened overnight? We lost some key levels - 6722, 6705, 6697 and our overnight session high was 6732 and low is 6680.
I had been looking for price to get down to the 6680 level as it is where the white trendline magnet is and you can see clearly on the chart that we have held this area since the European open.
This makes today pretty straightforward as to what levels we are looking to find quality points to enter and ride alongside the institutions.
As of writing this plan, price is coming into our first resistance level of 6705. Any reclaim of 6722 will keep us moving higher. We had a very nice, failed breakdown overnight of the 6688 level for a nice pop to 6705. I will be looking for price to pullback below the 6694 level and reclaim any of the levels above it for a move higher. IF, price loses 6680, the next big areas for a reaction will be 6669, 6664, 6653-56.
I mentioned yesterday that IF, we lose 6650, we could probably flush lower and that would put 6633, 6624 as my top levels for flush and reclaims to move us higher.
Key Support Levels - 6650, 6656, 6664, 6669, 6675, 6680, 6688, 6694
Key Resistance Levels - 6705, 6711, 6717, 6722, 6732
I do expect price to potentially retest the 6717-22 level as this was the area we broke out from yesterday and also, broke down from overnight.
Be patient and wait for price to come back down to the levels lower to flush and reclaim for points higher. I am not interested in trying to trade a level reclaim above 6705-6722 as it could just be a choppy area. Any pullback below 6688 and reclaim, I will be taking. IF, we lose 6680 and ES is flushing lower, I would be patient and wait for the levels in blue to build a base, reclaim and move higher.
I will post an update around 10am EST.
---------------------------------------------------------------------------------------------------------------------
Couple of things about how I color code my levels.
1. Purple shows the weekly Low
2. Red shows the current overnight session High/Low (time of post)
3. Blue shows the previous day's session Low (also other previous day's lows)
4. Yellow Levels are levels that show support and resistance levels of interest.
5. White shows the trendline from the August lows.

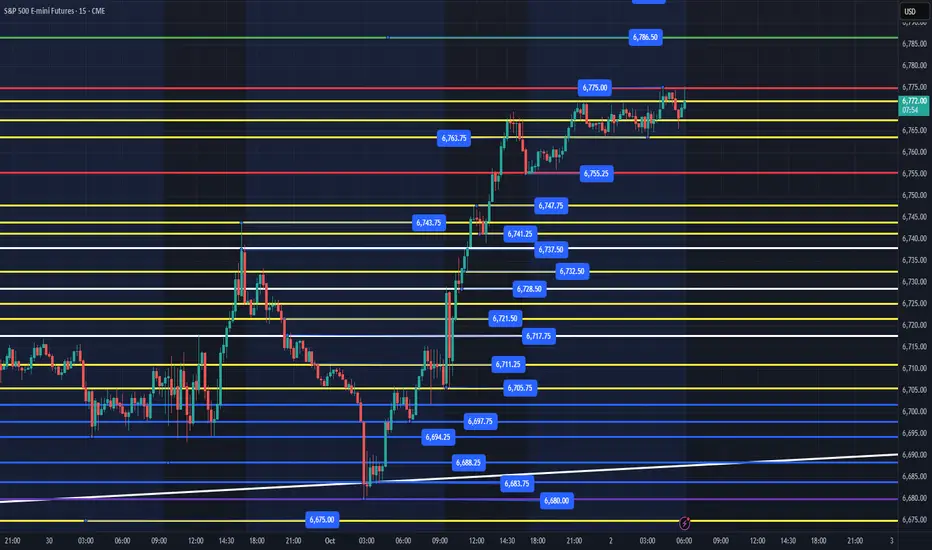
ES - October 2nd - Daily Trade PlanOctober 2nd - 6:08am EST
*Before reading this trade plan, IF, you did not read yesterdays, or the Weekly Trade Plan take the time to read it first! (You can see both posts in the related publication section) *
If my posts provide quality information that has helped you with your trading journey. Feel free to boost it for others to find and learn, also!
My daily trade plan and real-time notes that I post are intended for myself to easily be able to go back and review my plan and how I did from an execution perspective.
------------------------------------------------------------------------------------------------------------
Yesterday, we had a massive squeeze higher as retail investors where bearish due to the US Government Shut Down, while Institutions had been building positions since last week by accumulating between 6626 & 6680. 6705 was the major bull/bear line and we finally got the massive squeeze higher. We have met our initially weekly targets and now we need a pullback to find opportunities to enter higher. Over the past 2 days, most contracts that have been traded are sitting above the 6755 range. What does that mean? Institutions have been selling to retail traders as everyone does not want to have FOMO!
Will a rug pull come today or tomorrow? I have NO idea when Institutions are planning to "pull the rug" and grab liquidity. What I will focus on is the areas that I can grab points, IF/When that occurs. If you have traded ES for any length of time, when ES sells off, it sells fast, and you do not want to try and pick a bottom.
Let's discuss today's plan!
The overnight session has been distributing between the overnight low at 6755 and the high of 6775. While price can just keep going higher today. We need to be prepared to find quality setups that we can grab points from. As you know, I am a long ES trader that focuses on Failed Breakdowns. That is how Institutions accumulate. The ideal long for me, is the prior days low to flush and recover, or another well-defined area that produced a nice bounce/rally.
Key Support Levels - 6763, 6755, 6747, 6737, 6728, 6717, 6705, 6697, 6688, 6680
Key Resistance Levels - 6775, 6786, 6792, 6801+
While typing this Daily Trade Plan, I am hearing in the background CNBC talking head guests about how bullish they are! I do believe that Institutions will let the NYSE open and continue to sell to retail investors that could push prices up to the key resistance levels above. We need to be patient and see what price does in the first hour of the open.
The key levels that I will be looking for to grab points.
1. 6755 is a level that should have some liquidity to at least grab some points to the 6764 level.
2. 6744-46 could produce some points and any reclaim of 6755 would be bullish
2. 6737 is a level that could produce some points to retest the 6755 overnight low
3. 6728 is a level that needs to hold, or we will start to have a warning sign that price needs much lower prices.
4. 6717 is last level that price needs to hold or we could flush all the way down to retest the 6705, 6697 and 6680 levels.
IF, price rallies above 6775 (Overnight High) and then comes back into this range after the NYSE Open, and ES starts to sell off fast, DO NOT try and RUSH into grab points. Wait for it to build a base at one of the levels outlined above.
Personally, I will not be chasing price at these levels and will be patiently waiting on price to come back to one of the levels outlined for an opportunity to take some points today.
I will post an update around 10am EST.
---------------------------------------------------------------------------------------------------------------------
Couple of things about how I color code my levels.
1. Purple shows the weekly Low
2. Red shows the current overnight session High/Low (time of post)
3. Blue shows the previous day's session Low (also other previous day's lows)
4. Yellow Levels are levels that show support and resistance levels of interest.
5. White shows the trendline from the August lows
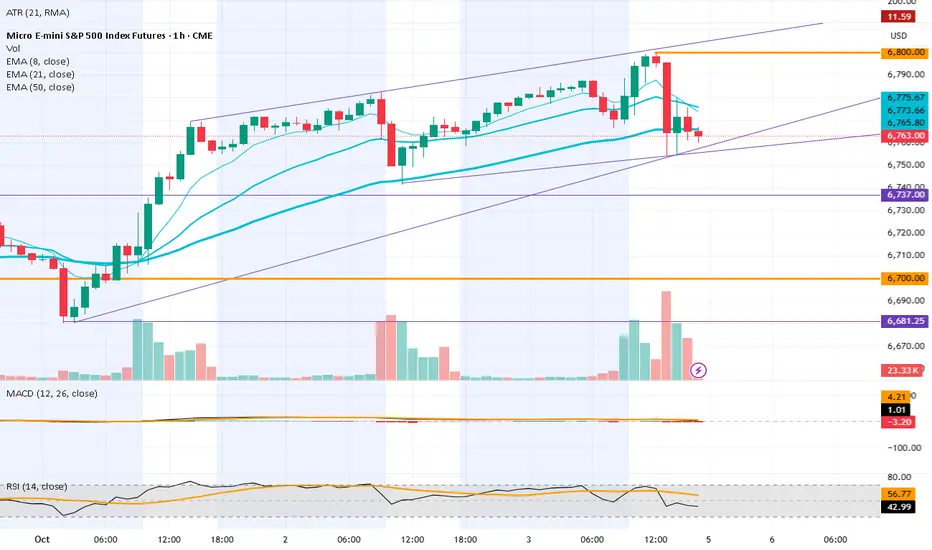
A look at the MES1! (SPX)Chart Time Frame: 1 Hour
Current Price: 6763 after setting recent ATH at 6800
Daily Candle: Top Heavy Doji with open / close entire in the body of previous candle.
📈 Price Action & Technical Analysis
EMA 8 (thin cyan): ~6733 – Above price. Negative Slope.
EMA 21 (med cyan): ~6775 – Above price and EMA 8. Negative Slope. Rotation zone created on 1H and lower TF (EMA 8 crossed EMA 21). Crossover has not happened on higher TF's at time of post.
EMA 50 (thick cyan): ~6765 – Above current price; Flattening out.
Structure: Bullish Trending since April lows.
📈 RSI (14 Close) Current: 43 (57 MA)
Interpretation: Below neutral (50), momentum is weakening.
📈 MACD (12, 26, 9) MACD Line: 1; Signal Line: 4.2; Histogram: -3.2
Interpretation: MACD is growing bearish, histogram showing increasing intensity, yet still above 0.
🎯 Key Levels
Support: various possible trend lines shown (Purple). Price action Monday will determine their validity. Swing low at 6681.
Resistance: Overhead moving averages. ATH at 6800.
🧨 Volatility Outlook
VIX - After a decline, showing signs of inflection. Currently trending upwards on the daily TF.
Government shutdown and headline risk are of some concern to short term price action.
Short Term: A sudden opening of the government could certainly cause a bullish event. I could also imagine certain headlines that would cause a short term bearish event.
Longer term: govt shut downs have typically preceded bullish gains.
📈Macro/Fundamental Analysis
Interpretation: We are in between earnings seasons and with a Gov shutdown, void of Gov Data.
DXY - Pulled back significantly this year. I personally expect it to continue. This could provide a tail wind to equities pricing.
📆 Economic Calendar / Earnings Schedule
Econ Calendar: Relatively Light Next Week
Wednesday - 3PM EST - FOMC Minutes. Dot Plot could cause some action as the minutes are dissected.
Friday - 10AM - Michigan Consumer Sentiment Report. A big miss (up or down) could cause some action.
🔍 Summary
🔻 Trend: Long bull run - might be getting stale; Might just be getting started. You decide.
🧩 Momentum: Very high on longer TFs, Turning down on the lower.
🧠 Tactics:
Short Term - I love a 'rotation zone trade'. If price bounces back up into the EMA 21/8 spread zone, I would be looking for some day trade shorts.
Buyers finished with a strong closeThe closing price in the daily chart in the S&P 500 creates a technical uptrend. The next objective to the upside is 6789.

Positive movement to the upside is expectedThe structure in the daily chart of the S&P 500 implies continuation of the uptrend in a strong close going into the weekend. The upside objective is 6789.

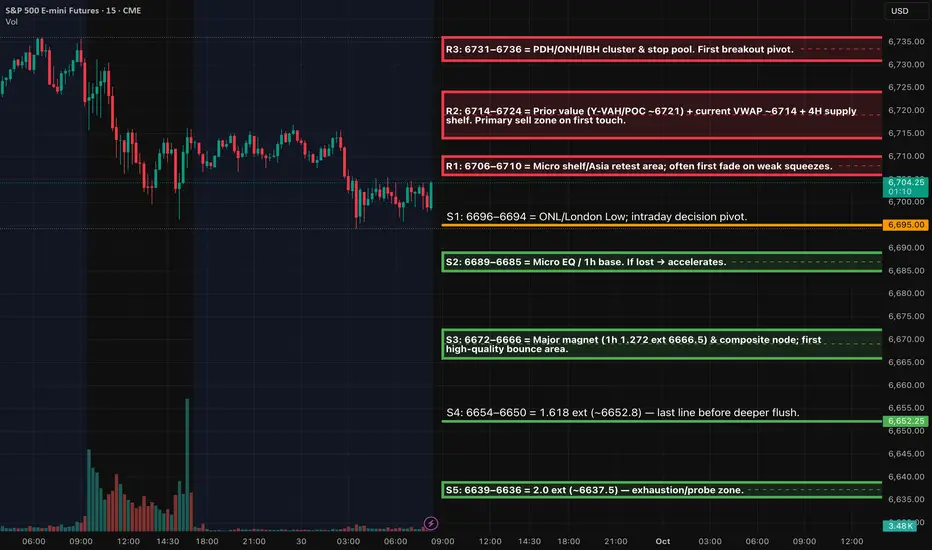
ES (SPX, SPY) Analyses, Key-Zones, Setups For Wed, (Oct 1)News & event map (for tomorrow, Wed Oct 1)
• ADP National Employment Report – 8:15 ET. Official release time.
• S&P Global PMI (final) – 9:45 ET. Scheduled on the first working day; tomorrow’s calendar lists 09:45.
• ISM Manufacturing & Prices Paid – 10:00 ET. ISM releases on the first business day at 10:00.
• JOLTS: already published Tuesday; none expected Wednesday.
• Shutdown watch: if funding lapses at midnight, the Labor Dept./BLS suspends operations and economic data are delayed (e.g., Friday jobs report). Expect the market to lean more on private data (ADP/ISM).
Shutdown Overview – Trading Insights
Historically, equity markets have exhibited mixed to mildly positive performance during government shutdowns, with the S&P 500 averaging gains between 0% and +0.3% in prior instances. The primary concern during these periods tends to be short-term volatility and potential delays in economic data, rather than sustained market downturns. Notably, the long-term trend suggests that markets typically recover and trend higher in the months following the resolution of a shutdown.
Overnight projection (Asia→EU)
The baseline expectation is for range-building between 6693 and 6725, with potential liquidity runs at the confluence edges. We often see price dips below the 6693–6695 zone rebound towards 6703 or 6713. Conversely, a strong acceptance above 6720–6725 can lead to a probe into the 6740–6750 range before the New York session. If we see a clean 30-minute close below 6693, that could open up the move to 6676 and potentially 6653.
NY session game plan (Level-KZ Protocol 15/5/1)
Trade around the 8:15 and 10:00 windows; let the first impulse settle, then execute inside NY AM 09:30–11:00 and PM 13:30–16:00 kill-zones.
ES LONG Acceptance (A++) — Entries, SL, TPs
Bias: Only if 15m accepts above 6720–6725 (re-close & hold).
Entry: 5m pullback hold → 1m HL trigger 6721–6726.
SL: ≤6712.75 (beyond VWAP/IB-H) hard stop (±0.25–0.50).
TP1: 6743.5 (PDH) — take 70%, set runner BE.
TP2: 6750–6755 supply.
TP3: 6763–6768 stretch if ISM beats and breadth expands.
Invalidation: A 15m body back inside ≤6719 after entry.
ES SHORT Rejection (A++) — Entries, SL, TPs
Bias: Fade first test of 6740–6750 if 15m shows rejection (wick + close back inside).
Entry: 5m LH re-close below 6735–6738; 1m trigger.
SL: ≥6756.
TP1: 6720–6722.
TP2: 6703–6705 (Y-POC).
TP3: 6693–6695 (Y-VAL/ONL).
Invalidation: 15m acceptance above 6750.

Day 43 — Trading Only S&P Futures | Fresh RecordsDay 43 of Trading Only S&P Futures is done — and despite fighting through the flu, I finished +$1,069 across all accounts.
The morning was tough with negative gamma and a few bad trades, but patience was the difference-maker. Once bullish structure aligned with positive gamma, I trusted my levels, bought the dip at MOB, and it worked out beautifully.
📰 News Highlights
DOW, S&P 500 AND NASDAQ CLINCH FRESH RECORDS
🔑 Key Levels for Tomorrow
Above 6745 = Stay Bullish
Below 6730 = Flip Bearish

A market in waitingThe S&P 500 daily chart structure implies this market is waiting for information on whether or not the US government will shut down. The results are a sideways market until a decision is made.

ES - September 30th - Daily Trade PlanSeptember 30th - 6:15am EST
*Before reading this trade plan, IF, you did not read yesterdays, or the Weekly Trade Plan take the time to read it first! (You can see both posts in the related publication section) *
If my posts provide quality information that has helped you with your trading journey. Feel free to boost it for others to find and learn, also!
My daily trade plan and real-time notes that I post are intended for myself to easily be able to go back and review my plan and how I did from an execution perspective.
--------------------------------------------------------------------------------------------------------------------
Yesterday, we had a couple of opportunities at key levels to grab some points. You can look back at my notes that I post in real-time to review and see what transpired. Here are a couple of highlights.
"First level we are looking to defend will be 6715-6718. Any flush below and reclaim of 6725 should give us another attempt at clearing 6730-32 level.
Ideally, we can get a flush down to 6697-6700, reclaim 6705 and then long back up the levels.
IF, price loses 6684, we will need to look for flush and reclaims to get us moving back up the levels. I do not anticipate a loss of 6684 today as we close out end of month tomorrow."
We never lost 6684, yesterday, with our low being 6697.
8:50am - Update
"You can see that at 7:50am we lost the 6725 level down to 6723 and then reclaimed and went higher. I was off my desk and missed this level reclaim, but it was good for a nice pop back to 6731 level."
2:35pm - Update
"Price needs to reclaim 6722 to keep us moving higher overnight. IF, price loses 6704 then we will most likely need to test the 6683-6688 level that could push us back up the levels. When I posted the trade plan for today, I wrote "Ideally, we can get a flush down to 6697-6700, reclaim 6705 and then long back up the levels." At 1:32pm EST, we got to 6699, reclaimed 6705 and have rallied higher.
--------------------------------------------------------------------------------------------------------------------
Let's get into today's plan! Our overnight session high was 6717 and our low is 6694. I said yesterday that we need to clear 6722 for bulls to continue to push price higher. IF, price loses 6684 that is a warning sign. Guess, what? 6684 area will be a big focus today, IMO.
I will be looking for price to flush to 6680-84, reclaim 6688 and head up the levels. We could also flush 6694, hit 6688 and the reclaim of 6694-96 would be a great spot also.
The reclaim of 6705-07 should get us a few points to retest 6716-17 at the overnight high. Above that and we should retest the weekly highs at 6736, IF, we can clear 6722 area.
6663, 6653 are the next 2 main levels below that I will be looking for reactions.
Key Support Levels - 6653, 6663, 6684, 6697, 6705, 6715, 6725
Key Resistance Levels - 6704-06, 6715-17, 6721, 6728, 6736
Weekly Targets - 6760, 6767, 6776, 6786, 6800+
IF, price loses 6650, then we will most likely flush pretty hard below. Since it is the last day of the month/quarter, I do not anticipate that happening. Stay patient and wait for high quality levels to flush and reclaim.
I will post an update around 10am EST.
---------------------------------------------------------------------------------------------------------------------
Couple of things about how I color code my levels.
1. Purple shows the weekly Low
2. Red shows the current overnight session High/Low (time of post)
3. Blue shows the previous day's session Low (also other previous day's lows)
4. Yellow Levels are levels that show support and resistance levels of interest.
5. White shows the trendline from the August lows.

Day 42 — Trading Only S&P Futures | +$821 While SickDay 42 of Trading Only S&P Futures is wrapped up with +$821 across all accounts.
Even while battling the flu, I stuck to the process: waited for price to hit MOB, took the clean play, and locked in early. The rest of the day was more about protecting focus than chasing trades.
🔑 Key Levels for Tomorrow
Above 6745 = Stay Bullish
Below 6715 = Flip Bearish
📰 News Highlights
S&P 500 closes above 6,700 on bets of limited shutdown impact

ES1! DAILY upwards towards 7000!1). Rate cuts have begun! 2). ABC correction likely over. 3). MACD divergence. 4). Risk Assets are positive across the board!

ES (SPX, SPY) Analyses, Key Zones, Setups Thus (Sep 30)SESSION DRIVERS
• Europe: Germany CPI/HICP prelim came in hotter (2.4% y/y).
• Energy: OPEC+ chatter about a possible +500k b/d hike hit crude; watch cross-asset spillover.
• U.S. tape: Headlines around government-funding risk; yields eased into week-start.
→ Net: headline sensitivity + range tendencies early; let NY cash open set the tone.
INTRADAY BIAS & SCENARIOS
Base case: Range-to-down if 6714–6724 caps on first tests → rotate toward 6696 then 6669.
Alternative: Acceptance above 6724 flips momentum up → test 6731–6736 stops; extension possible toward 6750/6763 if buyers hold retests.
Threshold: 6696/6694 pivot (ONL/London Low). Below = opens magnets 6686 → 6669. Above and accepted = re-target 6714/6724.
LEVEL-KZ PROTOCOL (15/5/1) — SETUPS:
Tier-1 (A++) Acceptance Continuation — LONG above 6724
Trigger: 15m full-body close >6724.
5m: Pullback holds 6720–6724 and re-closes up.
1m Entry: HL reclaim.
SL: Below 15m trigger wick or 6716 (whichever is lower).
• TP1: 6731–6736, TP2: 6750, TP3: 6763.
Management: At TP1 close 70%, runner 30% to BE; no trail before TP2.
Tier-1 (A++) Rejection Fade — SHORT at 6714–6724
Trigger: 15m rejection that closes back below 6714.
5m: Re-close down with LH.
1m Entry: First pullback lower-high.
SL: Above 6728 (or 15m wick high).
TP1: 6696–6694, TP2: 6689–6685, TP3: 6672–6666.
Notes: Best on first touch during NY AM.
Tier-2 (A+) Quick-Reclaim Bounce — LONG at 6672–6666
Trigger: Sweep 6666 → instant reclaim; 15m closes back above 6672.
5m: Re-close up holding the band.
1m Entry: HL.
SL: Below 6658.
• TP1: 6696, TP2: 6714–6724, TP3: 6731–6736.
Size: ¾ normal.
Tier-3 (A) Exhaustion Flush — LONG at 6654–6650 or 6639–6636
Trigger: Exhaustion wick + 15m close back inside; 5m re-close up.
SL: 6–8 pts below the wick (respect the 15m anchor).
• TP1: 6666–6672, TP2: 6696, TP3: 6714.
Size: ½ normal. Use only if velocity spike + capitulation tells.
RISK & EXECUTION GUARDRAILS
• Hard SL on the relevant 15m wick ±0.25–0.50 pts.
• Viability gate: TP1 ≥ 2.0R.
• Max 2 attempts per level per session; time-stop 45–60m if neither TP1 nor SL hits.
• Daily guardrails: stop trading at −2R net or lock gains at +3R net.
• Lunch 12:00–13:00 manage only; PM window 13:30–16:00 for second pass.
Next swing wave 3 targeting 6800!1). Rate cuts have begun! 2). ABC correction likely over. 3). MACD divergence. 4). Risk Assets are positive!
Note
I've been analyzing charts for over 20 yrs. as my strategies "trend" to be very accurate! A lot of effort goes into this, so please consider a "Boost"

Waiting on what happens in Washington DCWith the potential government shutdown looming, the S&P 500 daily chart has a neutral zone structure as the market waits for an outcome.
