MSTR - How to profit from a $140 short target🔱 The MS ponzi is taking its toll. 🔱
I’m not laughing, because it’s genuinely unfortunate for everyone who believed in this scam.
But today, I don’t want to rant about that.
I want to show how one could profit from a potential drop of more than $100.
As an Andrews Pitchfork trader, I know there’s
Key facts today
0.024 BRL
−6.29 B BRL
2.50 B BRL
About Strategy Inc
Sector
Industry
CEO
Phong Q. Le
Website
Headquarters
Vienna
Founded
1989
ISIN
BRM2STBDR009
FIGI
BBG014XJY4X0
Strategy, Inc. engages in the provision of enterprise analytics and mobility software. The firm designs, develops, markets, and sells software platforms through licensing arrangements and cloud-based subscriptions and related services. Its product packages include Hyper. The company was founded by Michael J. Saylor and Sanjeev K. Bansal on November 17, 1989, and is headquartered in Vienna, VA.
Related stocks

MSTR HIGH PROBABILITY BIG BULL MOVE SOON!!!🚨 MSTR HIGH PROBABILITY BUY SETUP 🚨
* Here We Can See Clearly The Next Potential Moves For MSTR Coming Hours/Days.
* Keep Your Eyes Close On Your Trading Positions.
* Happy PIP Hunting Traders.
FXKILLA.

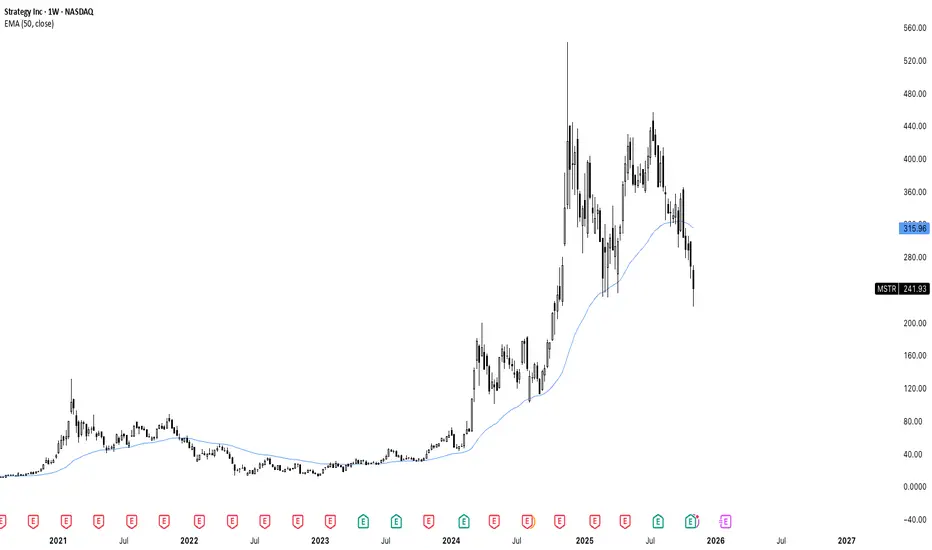
Microstrategy is who Satoshi warned us about. MSTR has broken below the 50 day moving average and is now at 52 weeks low. All while they hold the most bitcoin they ever have, now at 641,000 BTC. Some would even say they are trying to corner the market, using debt - while they claim they will never sell, but also they are not even earning any yi
$MSTR still bullish at supportstrategy has lately been underperforming compared with simular assets. It's stuck in this arc and the diagonal line. When it finds support and breaks the arc you will teleport to the next arc. This gets invalidated when breaking to the downside!

MicroStrategyBitcoin.
Still lots of downside left on the table for Saylor's MicroStrategy.
More time required before any type of lower risk entry point morphs into existence.

$MSTR Bullish Shark Harmonic completedNASDAQ:MSTR : C wave of this ABC correction has gone beyond A, meeting the requirements of an ABC flat correction. Bullish Shark Harmonic also looks complete.

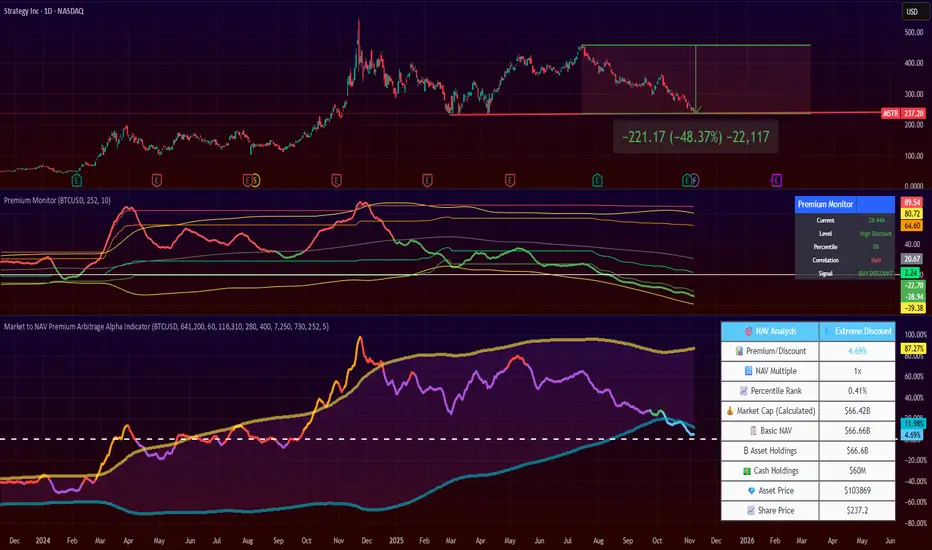
Strategy's Premium is Gone. Time to Load? 4 months ago, I posted that NASDAQ:MSTR premium was unsustainable and the stock price would drop.
Since then, the price dropped by 50%!!
Now, Strategy's is close to zero, and I flip my views on it.
If you like this kind of trade, it might be a good time to start DCA'ing it.
Note that Strategy con
MicroStrategy - Mean ReversionAfter a choppy but still successful call on MSTR in Feb, we are back with another one. Heavily oversold and ready to shoot alongside $BTC.

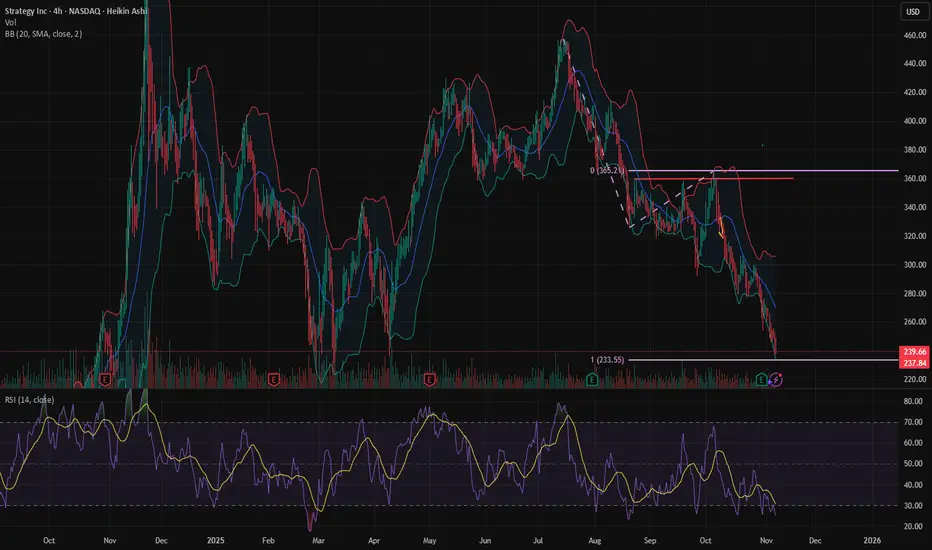
$MSTR: AB = CD target almost reachedNASDAQ:MSTR : the AB = CD targets $233 and today's low is $236.86. Very close. If NASDAQ:MSTR can bounce here, or fake breakdown to 233 or lower than bounce back, it would be good for Bitcoin. I don't own NASDAQ:MSTR shares and don't plan to trade this name. I'm looking at NASDAQ:MSTR as anoth
435This channel is not providing individualized trading or investment advice, nor is it a banking service, brokerage service, trading service, investment service or money management service

See all ideas
Summarizing what the indicators are suggesting.
Oscillators
Neutral
SellBuy
Strong sellStrong buy
Strong sellSellNeutralBuyStrong buy
Oscillators
Neutral
SellBuy
Strong sellStrong buy
Strong sellSellNeutralBuyStrong buy
Summary
Neutral
SellBuy
Strong sellStrong buy
Strong sellSellNeutralBuyStrong buy
Summary
Neutral
SellBuy
Strong sellStrong buy
Strong sellSellNeutralBuyStrong buy
Summary
Neutral
SellBuy
Strong sellStrong buy
Strong sellSellNeutralBuyStrong buy
Moving Averages
Neutral
SellBuy
Strong sellStrong buy
Strong sellSellNeutralBuyStrong buy
Moving Averages
Neutral
SellBuy
Strong sellStrong buy
Strong sellSellNeutralBuyStrong buy
Displays a symbol's price movements over previous years to identify recurring trends.
US594972AT8
Strategy Inc 0.0% 01-MAR-2030Yield to maturity
—
Maturity date
Mar 1, 2030
US594972AR2
Strategy Inc 0.0% 01-DEC-2029Yield to maturity
—
Maturity date
Dec 1, 2029
MSTR6034213
Strategy Inc 0.875% 15-MAR-2031Yield to maturity
—
Maturity date
Mar 15, 2031
MSTR6032672
Strategy Inc 0.625% 15-MAR-2030Yield to maturity
—
Maturity date
Mar 15, 2030
US594972AQ4
Strategy Inc 0.625% 15-SEP-2028Yield to maturity
—
Maturity date
Sep 15, 2028
MSTR5946535
Strategy Inc 0.0% 01-DEC-2029Yield to maturity
—
Maturity date
Dec 1, 2029
US594972AN1
Strategy Inc 2.25% 15-JUN-2032Yield to maturity
—
Maturity date
Jun 15, 2032
See all M2ST34 bonds
Curated watchlists where M2ST34 is featured.

