MSFTFor Microsoft stock (MSFT), I expect a continued decline to 385, and if it closes below that level, it may continue to drop to 343
MSFT trade ideas


Short MicrosoftSell Microsoft until 360-340, the price action is clear, confirmation was found in 4h.

Microsoft risks shown in chartThe biggest stocks in the market, from the technology sector, tops on July 2024. Now they are showing some concerning data. The weak RSI and Fibonacci retracement levels perfectly match previous support and resistance levels. There are also other concerning factors.
Microsoft is showing a weak RSI in the latest move-ups. Maybe it needs to find liquidity in the 0.382 FIB level around 370$.

msft bullishtechnically it seems more bullish than other mega gaps
Microsoft Corp. engages in the development and support of software, services, devices, and solutions. It operates through the following business segments: Productivity and Business Processes, Intelligent Cloud, and More Personal Computing.

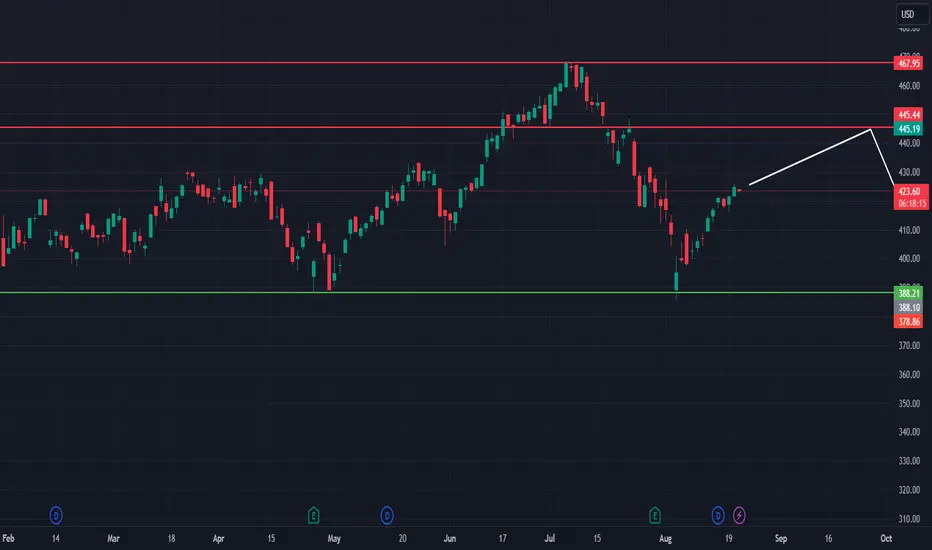
Microsoft bull flagI think that Microsoft will go up to the 440USD. I like to get some feedback or tips

MSFT - Reversal of upward trend and Head&Shoulder patternReversal of upward trend and Head&Shoulder pattern. Both indicates a short term downfall to around $380 or below.

Head and Shoulders Formation on MicrosoftHead and Shoulders Formation on Microsoft
You can check financial ratio indicators on my profile

MSFT Long Position Hi traders,
In the next days we are expecting the price to increase a little bit more and reach resistance.
After that we are expecting pullback and retest of the key support.
Entry, target and stop loss are shown on the chart.
Good luck
MSFT - MICROSOFT POTENTIAL REVERSAL (HEAD AND SHOULDERS) Dear traders,
keep an eye on microsoft, today is an important day due to NVIDIA's earnings report which could have a negative impact on tech companies if it is not good enough. Microsoft could very well go down to $375, this could generate some interesting buying ideas, I will share my thoughts on buying it.
best

MSFT FURTHER DOWNSIDE IS EXPECTED NASDAQ:MSFT broke out of daily trend line, further down side is expected. Overall target at key support levels of $350

MSFT - Head and shoulders is forming📈 Microsoft (MSFT) Stock Analysis
Let's take a closer look at Microsoft's (MSFT) recent performance. The stock is currently trading at $416.79, showing a slight increase of +0.30%. We're seeing some interesting technical patterns forming:
- Head & Shoulders Pattern: The chart shows a clear head and shoulders pattern, which could indicate a potential bearish reversal if the neckline is broken.
- Fibonacci Retracement Levels: Key levels to watch include 0.236 at $407.82 and 0.382 at $370.78. The stock has reacted previously with these levels, indicating potential support areas.
- Support Levels: Strong support is found around $325.45, which coincides with the 0.618 Fibonacci level.
If Microsoft fails to stay above the neckline, we might see the stock test lower levels, potentially around $340 or even $325. Keep an eye on these key levels for any further movement.


MSFT May 20, 2024: Waiting For A Trendline BreakoutOn May 20, 2024, after moving above MA-50 and holding for 2 days, NASDAQ:MSFT looks ready to breakout above the yellow trendline as shown on the chart, which would provide a buy point.

MSFT has room to the daily 50 SMA.NASDAQ:MSFT daily chart shows consolidation just below the daily 50 and 65 EMAs. If MSFT can confirm this daily supply to the upside, there is significant space on the chart up to the daily 50 SMA, which gives this trade a large measured potential. Many NASDAQ:QQQ names have reclaimed their daily 50 SMAs, and as long as the index continues to build above its daily 50 SMA, MSFT is likely to catch up. As MSFT is a thinner name, this trade will be more likely to work during the morning trading session when liquidity is higher.

MSFT - waiting for $425.85 break to explodeMSFT - Stock having good momentum end of the day and needs to break $425.85 50 EMA level. Stock seeing bulk of call flow coming in millions. on high watch for that $425.85 level break to add calls. Stock is strong on indicator level as well.

$MSFT Head and Shoulders Pattern in Formation?NASDAQ:MSFT
Technical Analysis of MSFT:
Head and Shoulders Pattern in Formation
Currently, the support established around $390 might be forming the neckline of a potential head and shoulders pattern. To complete this pattern, the right shoulder still needs to form.
Key point to watch: if the right shoulder develops below the 61.8% Fibonacci retracement level, projected at $436, it could signal a bearish move. A confirmed break of the $390 support would then be expected to trigger a downward move towards the potential target of $310.
Summary:
Current Support/Neckline Level: $390
61.8% Fibonacci Retracement Level: $436
Watch for Right Shoulder Formation Below $436
Potential Downward Target: $310
Monitor for the formation of the right shoulder and a potential break of support to validate the bearish outlook.

433 with a possible swing down to 415 to form the H&S pattern.Like other tech stocks in the AI sector, MSFT has been driving home the message reasonably clearly. Although the stock's shape and room have room to run, it is not in anyone's interest to continue to see one direction moving forward, which is why I am interested in what happens at the 433 corridor. It is one to watch for a possible breakdown. I will monitor it!

MICROSOFT Targeting $500 before the end of the year.Microsoft (MSFT) has made a new long-term bottom and recovered almost all of August's losses. That bottom is technically the Higher Low of the 20-month Channel Up that started in January 2023.
The price is currently consolidating below the 1D MA100 (green trend-line) and if broken, it will confirm the new Bullish Leg. In the previous (2) Bullish Legs of this Channel Up, the price tends to re-test the 1D MA50/100 cluster to confirm it as the new long-term Support after the break-out, so expect that to take place at some point.
Having though formed a new 1D MACD Bullish Cross, we can assume that this is already a safe level to buy for the long-term, as every Bullish Cross below 0.0 has technically been a confirmed buy level. Our Target for the end of the year is $500, which is still technically a 'modest' one as it is considerably below the 2.0 Fibonacci extension, which priced the March Higher High.
-------------------------------------------------------------------------------
** Please LIKE 👍, FOLLOW ✅, SHARE 🙌 and COMMENT ✍ if you enjoy this idea! Also share your ideas and charts in the comments section below! This is best way to keep it relevant, support us, keep the content here free and allow the idea to reach as many people as possible. **
-------------------------------------------------------------------------------
💸💸💸💸💸💸
👇 👇 👇 👇 👇 👇

Strong buy in microsoft stock today, Buy signal openedThis action respected support and formed a strong buyer defense. Confirmed entry into purchase for swing trade

Microsoft Structure MSFT has been on the rise for a very long time now, we can keep going long if our plan does not work out, once the weak high gets taken out same with the weak low then it will be confirmed that we will be trading shorts, so now is the time to be patient and wait do not force trades learn to be patient and sit on your hands and wait, do well to like share and follow, stay tuned for more updates.

MSFT Bear Flag + Resistance TestI like the looks of this setup on MSFT. Nice little bear flag/ascending wedge. On top of that, it is nearing the top end of the flag and we happen to have previous support that has now flipped to resistance in the same area. I expect a rejection and eventual break below the flag, leading to a move down to the 400 area at least.

Microsoft with a large head and shoulders formation.Technical Analysis of Microsoft (ticker at Nasdaq: MSFT)
Microsoft with a large head and shoulders formation.
Although the stock exchanges and many shares have recovered a good deal in the past week, and after the strong correction in the markets.
But there are still many charts for both important stock market indices and large important companies, which indicate that there may be another sharp decline soon.
One of these charts is Microsoft (MSFT), and where it looks suspiciously like an ongoing establishment of a large head and shoulders formation.
Such large head and shoulders formations often appear at the end of a longer uptrend, and these formations are considered to be among the most reliable of all technical formations.
Now it is starting to look suspiciously like a large head and shoulders formation here in the chart for Microsoft (MSFT), and where now the other shoulder may be in the process of being established.
What will trigger a strong technical sell signal for Microsoft (MSFT) will be if there is an established break down below the 'neckline' and the support level around USD 388.00.
On the upside, there is now important technical resistance to watch for the Microsoft share around USD 420.00 - 430.00.
In any case, it is well worth following closely here, and one does not have to have a very good imagination to be able to see that this looks a lot like a large and clear head and shoulders formation during the establishment of the now last shoulder in the formation.
If there were to be such a strong technical sell signal from such a large head and shoulders formation for Microsoft (MSFT), then the formation here would indicate that the MSFT share could fall down to around USD 320.00 - 340.00.
Pls don't shoot the messenger..
