$BAC$BAC ran prior to earnings and gapped down breaking the lower trendline. Currently at the $32.31 support, as the momentum decreased and below the EMA. The next support is $31.82, if there are enough buyers the resistance is $33.50.
BAC/PL trade ideas

What's in for Bank of America after the earnings report?Today we saw the earnings report for Bank of America and it did not meet the investor's expectations. So far the earnings season (for the banks) starts a bit off. The EPS came above expectations at 0.59 versus 0.54 expected. Revenue though came in with a miss - 20.1B against 20.56B expected. The main cause for the miss cited is the COVID-19 pandemic.
RSI is already crossing from overbought territory, though MACD's crossing is lagging. The histogram is showing a divergence with the price which is in line with RSI's early divergence with the price.
My expectations are for a drop towards the trend line support at the $31.35 zone. A breach there may lead to a potential drop towards $30.61 and by this jeopardizing the uptrend.

The Laws of Supply and Demand Affects the Price MovementThe Laws of Supply and Demand Affects the Price Movement
1. When supply exceeds demand, the price is more likely to fall.
2. As the price is falling, supply will increase, and demand will decrease. As a result, the price will fall faster.
3. At valleys, demand is greater than supply; therefore, the price is more likely to increase.
4. At peaks, supply is greater than demand; therefore, price is more likely to fall.
5. As the price trends higher, demand is greater than supply; therefore, price is more likely to go higher.
Thank you for reading!
Greenfield
Remember to click "Like" and "Follow!"
Disclosure: Article written by Greenfield. A market idea by Greenfield Analysis LLC for educational material only.


If you are looking for a safe bet for the next 2 weeks..!11.5% gain with R/R: 2.64 which is acceptable.
I can make you confused you by a crowded messy chart, but I would rather simple effective presentations..!

BAC - Federal Reserve said Banks could resume stock buybacksLooking for a $32.30 to $31.00 pull back at most before entering.
The Fed in June had put temporary caps on shareholder payouts, prohibiting them from buying back stock or increasing dividend payments.
"The banking system has been a source of strength during the past year, and today's stress test results confirm that large banks could continue to lend to households and businesses even during a sharply adverse future turn in the economy," the Fed's vice chairman for supervision, Randal K. Quarles, said in a statement.
JPMorgan and Morgan Stanley released statements, saying they planned to resume buybacks starting next quarter. Citi and Goldman said they intended to resume such purchases next year.
Bank of America CEO Brian Moynihan has said that his company plans to buy back stock as soon as it is allowed to.
The six biggest U.S. banks could buy back as much as $11 billion of shares in the first quarter under the new distribution policy, according to Bloomberg.
Source "https://www.thestreet.com/investing/banking-stocks-jump-after-fed-allows-buybacks-to-resume#:~:text=The%20Federal%20Reserve%20said%20that,buybacks%20in%20the%20first%20quarter.&text=Banking%20stocks%20jumped%20Monday%20after,beginning%20in%20the%20first%20quarter."

BAC - Long Looks like it's about to go down for a while, but it's within the channel. It's my favorite bank, I'll continue to hold, but does not look like a buying opportunity at this time.

BANK OF AMERICA CORPORATIONBANK OF AMERICA CORPORATION
Our contribution was made by the ability to buy up to the resistance line, a struggle for power Buyers and their relative strength I recommend buying right now up to that point and their damage If he will penetrate Tanya
God is the Lord of the Conciliation

BAC - EW analysis - C in progressBAC - It is in 3rd of C wave up. Buy the three wave sideways pull back for next higher high as target. The overall cycle up is in double zigzag move.
Give thumbs up if you really like the trade idea.

BAC - Follow the shark3 Slow Turtle Buy within 2 weeks.
Up 10% since last Fast Turtle Buy call (Looks like shark is buying which triggered FAST TURTLE BUY).
Might be resisted by EMA200 (Purple line) and GAP
ATOM Buy
FiFT +ve
Volume is increasing (insider bought 100 mil shares at Friday closing)

BAC LONGNYSE:BAC
13 MA and 50 MA showing uptrend
RSI also going up
im convinced that the old resistance trend line will become the new support tl
fib retracement retested at 23% previously, am a bit late but i will proceed with this trade

BACBank of America is slowly losing momentum. It broke out of its rising wedge and is consolidating near a strong resistance level. If it dips below the resistance line. We could see a drop back to the 29s. Overall this is still a strong stock with a good business outlook


$BAC - golden cross $BAC golden cross coming soon. It is a pattern I enjoy playing. No chart pattern or chart indicator is a guarantee.
Golden crosses on the horizon (within 1-35 days)
AA - I want in, but afraid
BAC
BOX
CARS
DBX
GE - Im in
HAS - Im in
LYFT
MLHR
MMM - Im in
NTAP
NTR - Im in
URG
WB
NNDM - Im in
ADS
BA
C
CONN
COTY
CRON
CSCO
EBIX
GNUS
JWN
M
MIXT
MO
NCLH
PSEC
SPG
UAL
WTFC
SPYD
EEFT
FNB
BNS
Recently golden crossed and no where near entry or entry is still good to play the golden cross
OLN
RVLV
AXP
IMMR - Im in
DFS
EXPE
F - Im in
FBC
FCEL - Im in
IDEX
JPM
MET
MOS
STT - Im in
ULTA
WEX
Personal plays and cashed out today on golden cross:
IDEX +50%
MET +27%
ULTA +18%

BAC to the MOONI love bank stocks and the reason is that it is slow and predictable. It is almost identical to the economy. If the economy fluctuates, it will indeed replicate every movement... more or less

$BAC - could have a small rallyheaded to that golden cross
ATR is not super supportive and stochastic could be better
Flattened histo on the MACD
One to watch

BAC (S&P 500) - Fast Turtle Buy with Potential Reversal.Finance Sector
Higher High and Higher Low (Uptrend)
Price still below EMA50
Recent Fast Turtle Buy on daily chart formed Hammer candle on weekly timeframe at trendline support.
FiFT turned +ve indicating Bull is getting stronger with Buy on Dip signal appears.
Price Higher Low and Indicator Low Low present Hidden Bullish Divergence which mean stock may trend higher.
ATOM still neutral.
This is for long term trade/investment.

$BAC - on golden cross watch listShould have got in today, and I did not. Will look again Wednesday 12/23

great trend from lowshas lots of potential here, like the title says its been a nice trend from lows, with potential to test 31-32 here if the top trendline breaks. i would go too heavy here simply because these banks have a history of losing gains. goodluck :)
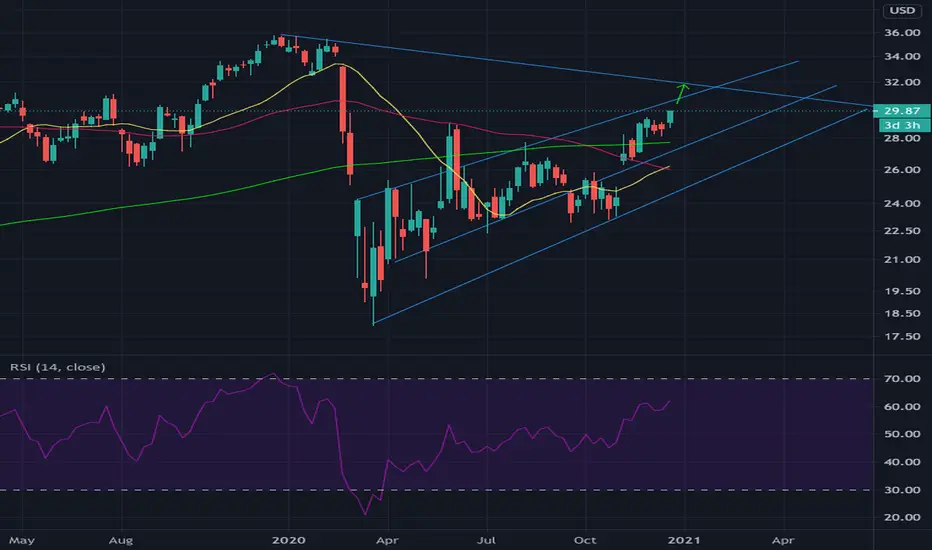

Buy Signal: 28.90Stop: 28.00
We see potential continuation out of this broad range. We have tight stop so this is more of a momentum play by the model.

