ford in the next few weeksFord stock is undervalued and now at strong support
we will see bullish movements in the next few days
Trade ideas

$F Electric Vehicle (EV) Strategy:
Broadened Electrification: Ford is expanding its EV lineup to include more affordable electric commercial vans, mid-sized trucks, and hybrid SUVs, aiming to enhance profitability and reduce CO₂ emissions.
New EV Platform: The company plans to introduce a cost-efficient electric vehicle platform by 2027, facilitating the launch of multiple vehicle styles for both retail and commercial customers.
Analyst Projections:
Price Targets: Analysts have set price targets ranging from $8.00 to $14.00, with an average target of $10.31, indicating a potential upside from the current price.
Forecasts: Some forecasts predict modest growth, with the stock potentially reaching $10 by mid-2025 and $12 by the end of 2027.
Market Position and Challenges:
Competitive Landscape: The automotive industry is highly competitive, with challenges such as slow growth, technology disruptions, and overcapacity affecting traditional automakers.
Strategic Shifts: Ford is adjusting its EV strategy to focus on hybrids and affordability, aiming to meet changing market conditions and consumer preferences.
Conclusion:
While Ford's strategic initiatives in electrification and affordability may position it for growth, the automotive industry's inherent challenges and competitive pressures warrant careful consideration. Potential investors should conduct thorough research and assess their individual investment goals and risk tolerance before making investment decisions.
Triple Bottom off a DOWNTREND

Ford’s Potential Big Up MoveFord showing a break out from the previous daily consolidation. Monthly minor trend in down but the major trend is going up to resistance at $15. We could see that big move up before it falls to $7. Let’s see how it plays out.

F 1H Swing Long Conservative Trend TradeConservative Trend Trade
- long impulse
- volumed T2
+ support level
+ 1/2 correction
+ biggest volume Sp
Calculated affordable stop limit
1 to 2 R/R take profit
Day Trend
"+ long impulse
+ 1/2 correction
- neutral zone
- context direction short"
Month CounterTrend
"- short impulse
+ 1/2 correction
- unvolumed T1
+ support level
+ long volume distribution
+ biggest volume manipulation"
Year Trend
"+ long impulse
+ volumed T2 level
+ volumed 2Sp+
+ 1/2 correction
+ weak test"

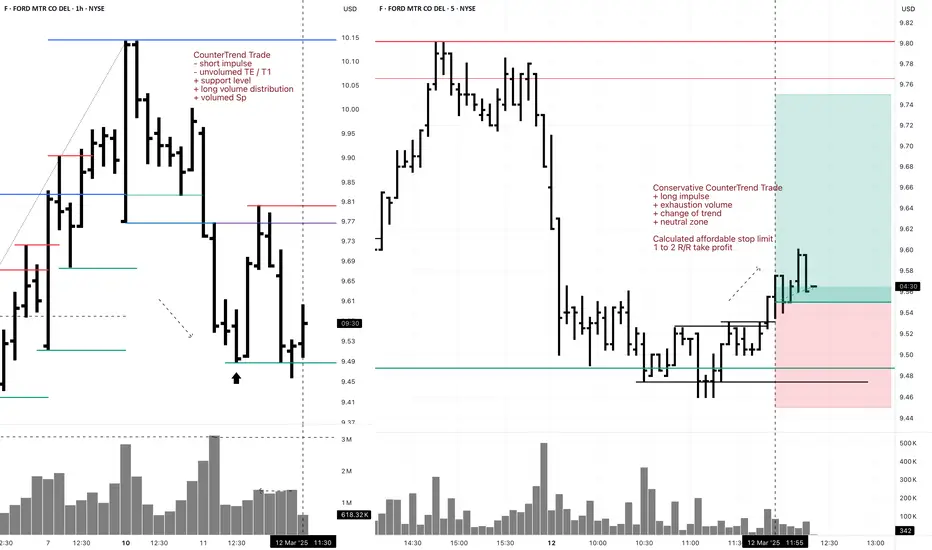
F 5M DayTrade Long Conservative CounterTrend TradeConservative CounterTrend Trade
+ long impulse
+ exhaustion volume
+ change of trend
+ neutral zone
Calculated affordable stop limit
1 to 2 R/R take profit
1H CounterTrend
"- short impulse
- unvolumed TE / T1
+ support level
+ long volume distribution
+ volumed Sp"
1D CounterTrend
"+ long impulse
- biggest volume on correction
- below SOS test level
- below support level
+ 1/2 correction"
1M Trend
"- short impulse
+ 1/2 correction
- unvolumed T1
+ support level
+ reverse volume approach
+ volumed manipulation"
1Y Trend
"+ long impulse
+ volumed T2 level
+ volumed 2Sp+
+ weak test"
F 5M Daytrade Conservative CounterTrend TradeConservative CounterTrend Trade
+ long impulse
+ T1 level
+ support level
+ 1/2 correction
+ volumed 2Sp-
Calculated affordable stop limit
1 to 2 R/R take profit
1H Countertrend
"- short impulse
- unvolumed TE / T1
+ support level
+ long volume distribution
+ volumed Sp
+ test"
1D Trend
"+ long impulse
- biggest volume on correction
- below SOS test level
- below support level
+ 1/2 correction"
1M CounterTrend
"- short impulse
+ 1/2 correction
- unvolumed T1
+ support level
+ reverse volume approach
+ volumed manipulation"
1Y Trend
"+ long impulse
+ volumed T2 level
+ volumed 2Sp+
+ weak test"

F 5M Long Conservative Trend DayTrade Conservative Trend Trade
+ long impulse
+ SOS level
+ 1/2 correction
+ support level
+ biggest volume 2Sp+
Calculated affordable stop limit
1D T2 take profit
1H Trend
"+ long impulse
- before 1/2 correction
+ SOS test level"
1D Trend
"- short impulse
+ exhaustion volume
+ volumed TE / T1 level
+ biggest volume 2Sp+
+ test"
1M CounterTrend
"- short impulse
+ 1/2 correction
- unvolumed T1
+ support level
+ reverse volume approach
+ volumed manipulation"
1Y Trend
"+ long impulse
+ volumed T2 level
+ volumed 2Sp+
+ weak test"

Ford is looking at an upside after prolong range since 2022NYSE:F Ford is looking at a possible resumption of upside after the stock broke above the downward sloping line of the descending triangle. Furthermore, the stock has 1.) Clear closure above the bearish gap with strong bearish candle 2.) Inverted head and shoulder is in the picture.
Ichimoku is showing early signs of a bullish reversal.
Long-term MACD is showing positive histogram and a crossover at the bottom.
Stochastic Oscillator has confirmed the Oversold crossover. 23-period ROC crosses above the zero line and has formed a bullish divergence.

Ford (F) Stock Price Rises Following Trump's DecisionFord (F) Stock Price Rises Following Trump's Decision
The White House announced on Wednesday that automakers will receive a one-month exemption from tariffs on imports from Mexico and Canada for vehicles that comply with the free trade agreement between these two countries and the United States.
White House Press Secretary Karoline Leavitt stated that this move came in response to a request from the heads of Ford Motor, General Motors, and Stellantis. The American Automotive Policy Council expressed gratitude to President Trump in a statement and noted that companies would work with the administration to boost vehicle production in the U.S. and expand exports.
This fundamental backdrop triggered a bullish momentum in the stock market for these automakers. In particular, Ford (F) shares rose by more than 6%, while the S&P 500 (US SPX 500 mini on FXOpen) gained about 1.1%.
As shown in Ford (F) stock's price chart today, the stock has rebounded from a four-year low.
Technical Analysis of Ford (F) Stock Chart
As we noted in our February 7 analysis of Ford (F) stock, special attention should be paid to the level marked by the blue line. This area, around $9.65–$9.75, acted as support in 2023 and 2024 (indicated by arrows), preventing bears from pushing the price below the psychological threshold of $10 per share.
We also highlighted the "Trump factor" and the fact that the newly inaugurated president could drastically alter the landscape for the iconic American automaker by imposing tariffs on foreign car manufacturers. The impact of this price driver on Ford (F) shares is visible on the chart: a sharp upward reversal (marked by a curved arrow) indicates that the bears’ attempt to push the stock below its previous low has failed.
It is reasonable to assume that bulls now have the initiative. If they manage to push Ford (F) stock above the resistance of the blue line, this level could turn into future support.
Ford (F) Stock Price Forecasts
Analysts remain cautious in their assessments. They may believe that one month is too short a period to significantly alter supply chains and relocate production to the U.S., where, according to Trump's statements, no tariffs would be imposed.
According to TipRanks:
→ Only 4 out of 14 analysts recommend buying Ford (F) stock.
→ The average 12-month price forecast for Ford (F) is $10.76.
Trade on TradingView with FXOpen. Consider opening an account and access over 700 markets with tight spreads from 0.0 pips and low commissions from $1.50 per lot.
This article represents the opinion of the Companies operating under the FXOpen brand only. It is not to be construed as an offer, solicitation, or recommendation with respect to products and services provided by the Companies operating under the FXOpen brand, nor is it to be considered financial advice.

Ford seems to easy of a buyThoughts on the Ford recall vs price action
I'm personally watching as buying is heating up

Ford Motor Company: LONG TRADE EV etc for me all overrated. Tesla also...they are selling you lit. battery tech that will diminish after some time...
You are going a long journey and have to stop by a charging station and wait before you keep going...Are you joking me ! !
With EV this is what happened...For years car companies had been spending money on ARGE...Finally they had to profit, with the help of the governments, they are turning it into profits.
5 years later they will be speaking for hydrogen cars or back to petrol or something.
My thought above has got nothing to do with Ford :)
But Ford Price will increase in short term.
None of my positions are investment or trading advise. Do your own analysis.

F is crashing, ahhhhhh!NYSE:F
my thesis:
my view in this market, i see the price will go lower and lower in the long run. i know my risk betting against the downtrend of this market as i am looking for the market to form a lower highs to 12 or possibly price could fall more than i am expecting. what i am more interested to see in this market, i should see the price form its potential for bull after the strong fall in price.

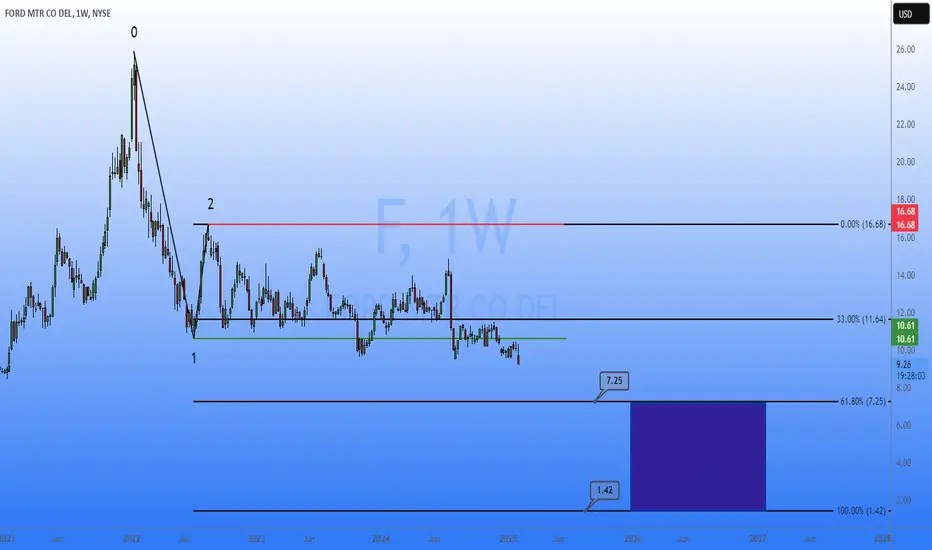
FORD WEEKLYRULES:
-If price break Point 2, 4, 6, or 8 cancel the setup
-Price needs to break Point 1, 3, 5, or 7 to confirm the setup
When price reach the 100FE(BLUE BOX) it normally does a pullback/retest or reversal
The market can Truncate(fall short)
Long $F (Ford) on the DailyI went long some Ford on the daily chart. No plan. No stops. No thesis. This is purely based on the down trend break.

Stock F gonna Crash Ford Stock Plunge: A Wyckoff Perspective
Ford Motor Company (F) shares have dropped approximately 9.2% since the beginning of the year, significantly underperforming the S&P 500, which has risen by 21.8% in the same period. This stark contrast highlights Ford's struggles against the broader market's bullish trend, signaling deeper weakness in the stock.
From a Wyckoff perspective, Ford's price action aligns with a *Major Sign of Weakness* (MSoW) within a distribution phase, even without a preceding *Upthrust After Distribution* (UTAD). This suggests that the stock may have distributed within a relatively narrow range, with sellers steadily overwhelming buyers. The MSoW phase is marked by clear breaks below support levels, increasing downward momentum, and failure to attract buying interest during broader market rallies.
The lack of strength in Ford's price action, combined with its divergence from the broader market, suggests that the stock is firmly in the hands of supply. As the distribution phase unfolds, further downside could be expected, with the next target being a potential breakdown below critical support zones.
Investors and traders should remain cautious, focusing on volume and price structure to confirm the continuation of this bearish trend before making decisions. This serves as a reminder of the importance of identifying distribution patterns, even when they lack classic Wyckoff features like a UTAD.

Ford (F): Struggling to Reclaim ResistanceFord was unable to flip its resistance and is now back trading near the support level, with the situation becoming increasingly precarious. NYSE:F has closely followed the Elliott wave count until recently, but now signs of weakness are emerging. If the $9.4 support level is lost, it will invalidate the previous wave count.
Analysts remain pessimistic about Ford’s outlook due to persistent challenges. The company faces potential pricing pressures on internal combustion engine vehicles and continued struggles in the electric vehicle market amid an ongoing price war. Additionally, possible tariffs on imports from Canada and Mexico under Donald Trump’s policies could further complicate the situation.
At this point, we do not see any compelling opportunities in the current market for $F. A long opportunity may arise only if Ford manages to reclaim the significant resistance level. Until then, the risk-to-reward ratio does not justify any immediate action.

RSISto Indicator script//@version=4
study(title="Stochastic", shorttitle="RSISto", format=format.price, precision=2, resolution="")
length1 = input(21, minval=1), smoothK1 = input(3, minval=1), smoothD1 = input(3, minval=1)
length2 = input(5, minval=1), smoothK2 = input(1, minval=1), smoothD2 = input(1, minval=1)
k1 = sma(stoch(close, high, low, length1), smoothK1)
d1 = sma(k1, smoothD1)
plot(k1, color=#C0C0C0)
plot(d1, color=#C0C0C0)
k2 = sma(stoch(close, high, low, length2), smoothK2)
d2 = sma(k2, smoothD2)
plot(k2, color=#C0C0C0)
plot(d2, color=#C0C0C0)
h0 = hline(80)
h1 = hline(20)
h2 = hline(95)
h3 = hline(5)
h4 = hline(50)
src = close, len = input(14, minval=1, title="Length")
avgLen = input(7, minval=1, title="Avg. Length")
up = rma(max(change(src), 0), len)
down = rma(-min(change(src), 0), len)
rsi = down == 0 ? 100 : up == 0 ? 0 : 100 - (100 / (1 + up / down))
plot(sma(rsi+100, avgLen), color=#C0C0C0)
plot(rsi+100, color=#C0C0C0)
band1 = hline(170)
band0 = hline(130)
fill(band1, band0, color=#C0C0C0, transp=90)

FORD is ready??The price action is going to the Fibonacci area, and then to enter in an accumulation zone at the price of $9-9.40 USD, then maybe the action will be entering un bullmode.

FORD WATCHING FOR $14 BREAK OUT!We have made new highs recently.
Worth watching for breakout above $14

F Ford 24 hr potterboxes.This is where we are at with ford right now. you can see the history of the stock and find the patterns that line up and trade accordingly. it will break out. just when is the question.

F WEEK 11/18/24F WEEK 11/18/24
Trying to keep this as simple as possible.
Once price breaks outside of the Blue range, watch for possible retest of broken level and be ready to long or short into the YELLOW ranges.
Price may exceed YELLOW range targets, but it’s at least a strong help to make profit 🎯🫡.
*LEVELS ARE NOT RANDOM OR BASED OFF EMOTION OR PERSONAL BIAS. BACKTESTED WITH THOROUGH RESEARCH WITH OVER 90% ACCURACY....HENCE WHY MOVE WILL MOST LIKELY BE GREATER THAN ESTIMATED.*

F Ford 24 hr potterbox.F Ford 24 hr potterbox. I think if ford opens up above the 50 percent line. The red line. it could stay there. Then again it could come down to the 50 percent line. its broke thru the line but couldn't hold it for very long. as you can see in the chart. I am using the august 5 low as my lowest candle. It might hold. I use the history of the chart . the laws of three, the Wykoff trading method. and the box to help me trade. you can trade this pattern from about $10.33 to the upside or the same to the downside. we will just have to wait and see.
