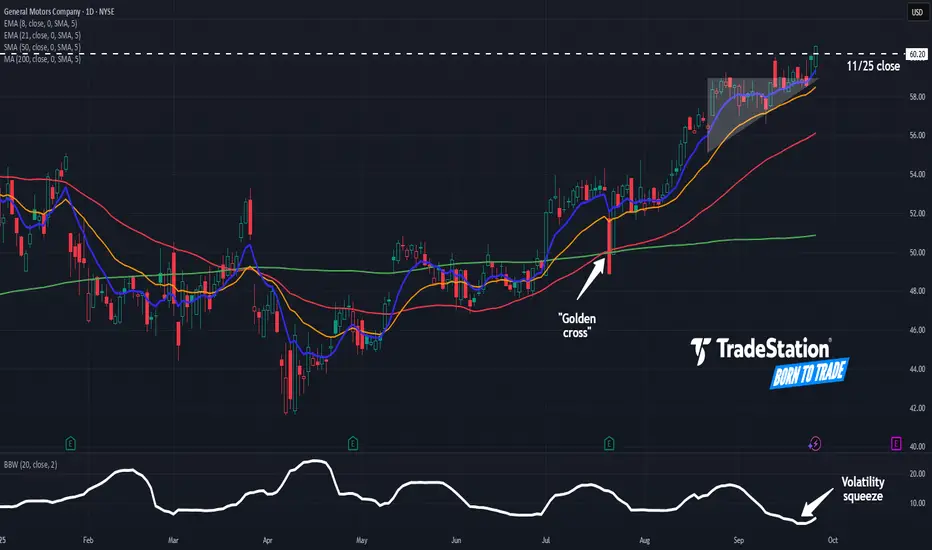
General Motors Could Be AcceleratingGeneral Motors has pushed higher amid low volatility, and some traders may think the automaker is starting to accelerate.
The first pattern on today’s chart is the series of higher lows since mid-August. Prices mostly remained below $59 until last week, creating an ascending triangle. They now seem to be escaping that potentially bullish continuation pattern.
Second, GM ended Thursday at its highest daily closing price since early 2022.
Third, Bollinger Band Width recently fell to its lowest reading since July 2017. Will that price compression give way to expansion?
Next, the 50-day simple moving average (SMA) had a “golden cross” above the 200-day SMA in July and has remained there since. That could reflect a more positive long-term uptrend.
Finally, the 8-day exponential moving average (EMA) has remained above the 21-day EMA since late June. That may be consistent with a short-term uptrend.
TradeStation has, for decades, advanced the trading industry, providing access to stocks, options and futures. If you're born to trade, we could be for you. See our Overview for more.
Past performance, whether actual or indicated by historical tests of strategies, is no guarantee of future performance or success. There is a possibility that you may sustain a loss equal to or greater than your entire investment regardless of which asset class you trade (equities, options or futures); therefore, you should not invest or risk money that you cannot afford to lose. Online trading is not suitable for all investors. View the document titled Characteristics and Risks of Standardized Options at www.TradeStation.com . Before trading any asset class, customers must read the relevant risk disclosure statements on www.TradeStation.com . System access and trade placement and execution may be delayed or fail due to market volatility and volume, quote delays, system and software errors, Internet traffic, outages and other factors.
Securities and futures trading is offered to self-directed customers by TradeStation Securities, Inc., a broker-dealer registered with the Securities and Exchange Commission and a futures commission merchant licensed with the Commodity Futures Trading Commission). TradeStation Securities is a member of the Financial Industry Regulatory Authority, the National Futures Association, and a number of exchanges.
TradeStation Securities, Inc. and TradeStation Technologies, Inc. are each wholly owned subsidiaries of TradeStation Group, Inc., both operating, and providing products and services, under the TradeStation brand and trademark. When applying for, or purchasing, accounts, subscriptions, products and services, it is important that you know which company you will be dealing with. Visit www.TradeStation.com for further important information explaining what this means.
GM trade ideas
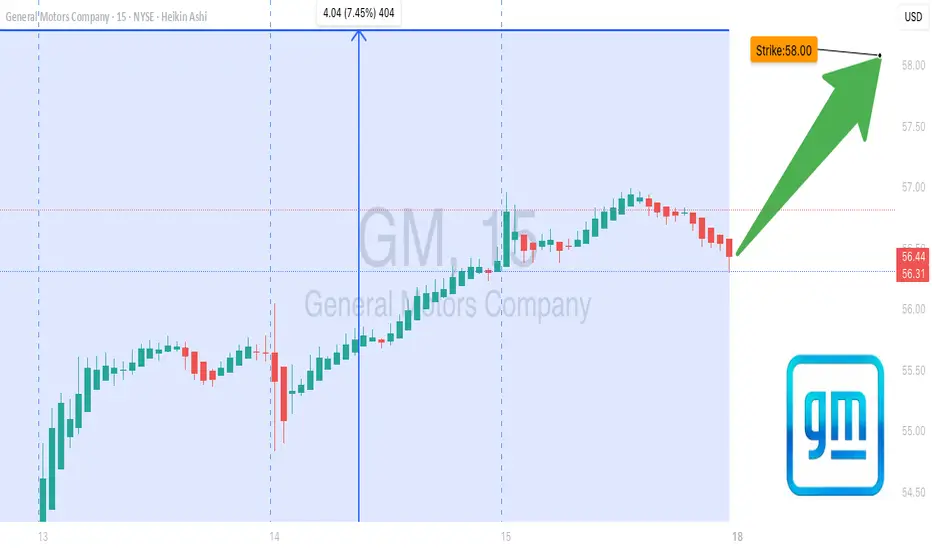
GM Breakout Watch – Calls Ready to Pop🚀 GM Swing Trade – \$58 Calls in Play!**
**Moderate Bullish Bias | Aug 15, 2025**
**📊 Key Highlights:**
* **RSI:** 74.2 – Strong bullish momentum 🔥
* **Price Momentum:** 5D +6.0%, 10D +8.0% 📈
* **Volume:** Weak ⚠️ (1.0x avg vs 1.3x needed)
* **Options Flow:** Neutral – No strong institutional lean
* **VIX:** 14.9 – Low volatility = ideal for swings
---
**💡 Trade Setup:**
* **Type:** Aug 29 ’25 \$58 CALL
* **Entry:** \$0.76 (at open)
* **Stop Loss:** \$0.45
* **Target:** \$1.20 (+58%)
* **Confidence:** 75%
* **Trigger:** Breakout above \$56.95 ✅ or pullback buy \$55.80–\$56.20
---
**⚠️ Risks:**
* Weak volume could cause fakeouts
* Resistance test could reject near \$58
* Keep an eye on market-wide volatility shifts
---
📆 **Signal Time:** 2025-08-15 12:12 EDT
💎 **Execution:** Buy calls at open if trigger confirms
---
\#GM #SwingTrade #OptionsAlert #CallOptions #NASDAQ #BreakoutTrade #MomentumStocks #StockMarket
General Motors: Strong EV Strategy and Earnings Momentum Signal Current Price: $53.22
Direction: LONG
Targets:
- T1 = $54.45
- T2 = $55.54
Stop Levels:
- S1 = $52.34
- S2 = $51.10
**Wisdom of Professional Traders:**
This analysis synthesizes insights from thousands of professional traders and market experts, leveraging collective intelligence to identify high-probability trade setups. The wisdom of crowds principle suggests that aggregated market perspectives from experienced professionals often outperform individual forecasts, reducing cognitive biases and highlighting consensus opportunities in General Motors.
**Key Insights:**
General Motors (GM) presents a compelling long opportunity ahead of its upcoming earnings release. The company’s focused approach to its electric vehicle (EV) strategy and cost management in a challenging macroeconomic environment are key factors influencing its bullish outlook. Investors are eyeing GM’s ability to navigate supply chain constraints and maintain competitiveness amid industry-wide shifts to green technology.
GM’s proactive measures, such as expanding its EV lineup while maintaining legacy vehicle revenue streams, signal operational agility. Additionally, the company’s recent focus on lowering operating costs amid inflationary pressures adds substance to its long-term growth narrative. Market participants expect mild pre-earnings volatility, but the stock’s technical positioning indicates a steady upside within its defined trading range.
**Recent Performance:**
General Motors has demonstrated resilience over recent trading sessions, maintaining stability despite broader market fluctuations. While geopolitical risks remain prominent in global finance, GM has largely shielded its operations from external shocks. Its stock price has tracked a gradual upward trajectory, reflecting market confidence in its EV ambitions. The company’s ability to deliver consistent fundamentals will be closely scrutinized in its upcoming report.
**Expert Analysis:**
Market analysts are cautiously optimistic about GM’s near-term price trend. Technical indicators show a favorable setup, with the stock maintaining support above key levels. Experts cite GM’s adaptability to external challenges and its focus on high-demand markets as credible factors for an upside. Additionally, analysts expect the company’s financials and commentary during the earnings call to bolster investor sentiment. However, risks tied to geopolitical tensions and raw material costs remain under observation.
**News Impact:**
General Motors has been in the spotlight for its evolving EV strategy and responses to supply chain headwinds. Recent developments suggest that these factors, alongside broader economic concerns, will be central to its upcoming earnings discussion. The company’s success in navigating global challenges and delivering planned milestones could act as a tailwind for its stock. Meanwhile, the automotive sector’s push towards greener technologies serves as a thematic catalyst for GM’s valuation.
**Trading Recommendation:**
General Motors is well-positioned for a bullish move in the near-term based on its technical setup and growth prospects. With strong earnings momentum and promising developments in its EV business, the stock offers an attractive long opportunity. Staying vigilant on geopolitical developments and input costs will be crucial, but GM’s overall trajectory appears aligned for success. Entering at current price levels with defined targets and stops provides a compelling risk-reward ratio.

Like this set up on GM using the 3 touch point TL StrategyLike this set up on GM using the 3 touch point trendline strategy

General Motors (NYSE: $GM) Reports 17% Y0Y in Q12025 Sales General Motors (NYSE: NYSE:GM ) opened at $44.46 on April 4th, 2025, down 3.91%. The stock declined $1.80 in early trading. This came a day after Trump’s new 25% auto import tariffs took effect. In a report released on April 2nd, GM delivered 693,363 vehicles in Q1 2025, a 17% year-over-year increase. This marked the company's best Q1 since 2018. In Q1 2024, GM sold 594,233 units.
The automaker led in truck and compact SUV sales. Electric vehicle sales surged 94% to 31,887 units. GM currently remains the second-largest EV seller in the U.S, behind Tesla.
Other automakers posted mixed results. Ford's sales declined by over 5% on Thursday due to the tariffs.
GM’s growth came partly due to early consumer purchases ahead of the tariffs. Retail sales jumped in March, with buyers seeking to avoid expected price hikes.
Tariffs Threaten GM's Supply Chain
Trump’s 25% tariffs on imported vehicles started on April 3rd. According to the White House, tariffs on auto parts will begin no later than May 3.
Barclays analyst Dan Levy noted that only 52% of GM’s U.S sales in the first three quarters of 2024 came from domestic production. The rest came from plants in Mexico (30%) and other countries (18%). Levy added that GM depends on imports for models like the Equinox and Blazer. These are mostly built in South Korea and Mexico. The tariffs will likely increase production costs and squeeze margins.
Despite strong Q1 performance, GM faces near-term risks from global trade tensions and supply chain disruption.
Technical Analysis: Price at a Key Support Level.
GM stock has been retracing from its $61.24 52-week high in November 2024. It now tests a strong support level at $43, which aligns with the 78% Fibonacci retracement level. If GM bulls hold this key support level, they could trade bullish towards the $53 target resistance. The $53 high serves as a key resistance level of an internal structure high and March high.
However, a break below $43 may push the stock lower, with the next potential support at $39, which aligns with 100% retracement level.
Forecast: Watch for Breakout or Breakdown
GM's technical position is delicate. A rebound from $43 could start a continuation of the trend. But extended trade risks and import costs could drag it down further. The company’s stock has fallen over 11% year-to-date. Analysts on TipRanks rate it a Moderate Buy. The average price target is $62.17, offering a 42% surge from the current market price.
With the earnings date set to be released on Apr 29, 2025, this will provide more clarity on the overall market sentiment.

GM Stock Chart Fibonacci Analysis 032125Trading Idea
1) Find a FIBO slingshot
2) Check FIBO 61.80% level
3) Entry Point > 48/61.80%
Chart time frame: C
A) 15 min(1W-3M)
B) 1 hr(3M-6M)
C) 4 hr(6M-1year)
D) 1 day(1-3years)
Stock progress: A
A) Keep rising over 61.80% resistance
B) 61.80% resistance
C) 61.80% support
D) Hit the bottom
E) Hit the top
Stocks rise as they rise from support and fall from resistance. Our goal is to find a low support point and enter. It can be referred to as buying at the pullback point. The pullback point can be found with a Fibonacci extension of 61.80%. This is a step to find entry level. 1) Find a triangle (Fibonacci Speed Fan Line) that connects the high (resistance) and low (support) points of the stock in progress, where it is continuously expressed as a Slingshot, 2) and create a Fibonacci extension level for the first rising wave from the start point of slingshot pattern.
When the current price goes over 61.80% level , that can be a good entry point, especially if the SMA 100 and 200 curves are gathered together at 61.80%, it is a very good entry point.
As a great help, tradingview provides these Fibonacci speed fan lines and extension levels with ease. So if you use the Fibonacci fan line, the extension level, and the SMA 100/200 curve well, you can find an entry point for the stock market. At least you have to enter at this low point to avoid trading failure, and if you are skilled at entering this low point, with fibonacci6180 technique, your reading skill to chart will be greatly improved.
If you want to do day trading, please set the time frame to 5 minutes or 15 minutes, and you will see many of the low point of rising stocks.
If want to prefer long term range trading, you can set the time frame to 1 hr or 1 day.

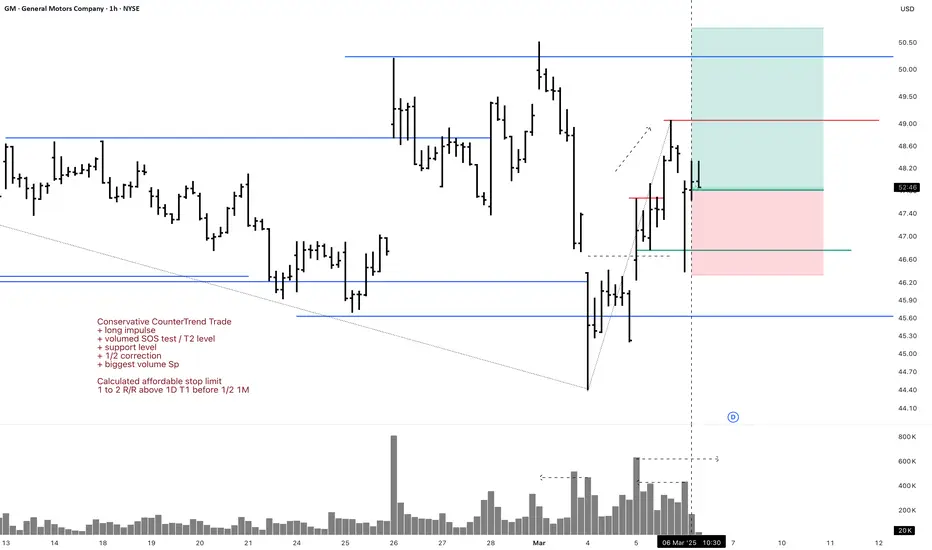
GM 1H Long Swing Conservative CounterTrend TradeConservative CounterTrend Trade
+ long impulse
+ volumed SOS test / T2 level
+ support level
+ 1/2 correction
+ biggest volume Sp
Calculated affordable stop limit
1 to 2 R/R above 1D T1 before 1/2 1M
Daily CounterTrend
"- short balance
- unvolumed expanding T1
+ volumed 2Sp+
+ test"
Monthly Trend
"+ long impulse
- below 1/2 correction
+ SOS test level?"
Yearly Trend
"+ long balance
- neutral zone"
Will add more if 5M corrects to 1/2 or 1H doest weak test and resumes buying
GM 5M Long Conservative Trend TradeConservative Trend Trade
+ long impulse
+ SOS level
+ support level
+ 1/2 correction
+ Sp
Calculated affordable stop limir
1 to 2 R/R take profit
1H Trend
"+ long impulse
+ volumed SOS test / T2 level
+ support level
+ 1/2 correction
+ biggest volume Sp
+ weak test
+ first buying bar closed"
1D CounterTrend
"- short balance
- unvolumed expanding T1
+ volumed 2Sp+
+ test"
1M Trend
"+ long impulse
- below 1/2 correction
+ SOS test level?"
1Y Trend
"+ long balance
- neutral zone"

GM Surging on Buyback & Dividend News! Can Bulls Push to $50+?Technical Analysis for February 27, 2025:
1. Current Price Action:
* GM surged on buyback and dividend news, reaching a high of $50.19 before pulling back to $48.60.
* Forming an ascending wedge pattern, indicating either a continuation or a breakdown.
* POC (Point of Control) at $48 is the key level to hold.
2. Key Levels to Watch:
* Support: $47 (HVL), $46, $45.67 (Major downside risk).
* Resistance: $49 (Breakout level), $50.19 (Recent high).
* Upside Targets: $50.19, $52+ if momentum continues.
3. Indicators Analysis:
* MACD: Bullish but flattening out—needs volume confirmation.
* Stoch RSI: Oversold, indicating a potential bounce.
* Volume Profile: Strong liquidity at $48, suggesting accumulation.
GEX & Option Strategy for Tomorrow and the Week:
1. Gamma Exposure (GEX) Insights:
* Call Walls: $50, $52 → Resistance zones.
* Put Walls: $45, $44 → Downside risk.
2. IV & Sentiment:
* IVR: 40.7 (Moderate)
* IVx Avg: 36.5 (Stable)
* Call Positioning: 20% bullish sentiment.
* GEX Sentiment: Leaning bullish—if GM stays above $48, momentum favors upside.
3. Trading Suggestions:
* Bullish Setup: If GM holds $48, consider long positions targeting $50-$52, with a stop at $47.50.
* Bearish Setup: If GM fails $48, short setups targeting $47-$45, stop at $49.
* Options Play: Selling put spreads at $46 or call spreads near $50 resistance.
📌 My Thoughts & Suggestion:
* GM's rally is news-driven, meaning follow-through volume is crucial for further gains.
* Holding above $48 is key for a continued push toward $50-$52.
* A breakdown below $47.50 could bring $46 into play.
⚠️ Disclaimer:
This analysis is for educational purposes only and does not constitute financial advice. Always do your own research and manage your risk before trading. 🚀

General Motors: Is All the Bad News Priced In?Tariff fears have battered General Motors, but some traders may see an opportunity.
The first pattern on today’s chart is the price gap from January 28 after the automaker reported quarterly results. At the time, tariff fears overshadowed better-than-expected earnings and revenue. But now Trump has made his move and the crisis is showing signs of resolution. Could buyers feel more comfort and look for prices to revisit the gap?
Second is the price area zone around $50. It marked the highs last July, August and September. GM tried to find support at the old resistance in December and January. The same trade fears pushed the stock below it yesterday. But if those worries ease, investors may view the dip as an opportunity.
Next, prices are trying to hold the 200-day simple moving average. Stochastics have also dipped toward oversold territory.
Finally, GM is a relatively active underlier in the options market. (Its average volume of 46,000 contracts per day ranks in the top 10 percent of the S&P 500, according to TradeStation data.) That may help traders sell credit spreads if they think support will hold. Alternately they may use vertical spreads looking for the recent price gap to be filled.
TradeStation has, for decades, advanced the trading industry, providing access to stocks, options and futures. If you're born to trade, we could be for you. See our Overview for more.
Past performance, whether actual or indicated by historical tests of strategies, is no guarantee of future performance or success. There is a possibility that you may sustain a loss equal to or greater than your entire investment regardless of which asset class you trade (equities, options or futures); therefore, you should not invest or risk money that you cannot afford to lose. Online trading is not suitable for all investors. View the document titled Characteristics and Risks of Standardized Options at www.TradeStation.com . Before trading any asset class, customers must read the relevant risk disclosure statements on www.TradeStation.com . System access and trade placement and execution may be delayed or fail due to market volatility and volume, quote delays, system and software errors, Internet traffic, outages and other factors.
Securities and futures trading is offered to self-directed customers by TradeStation Securities, Inc., a broker-dealer registered with the Securities and Exchange Commission and a futures commission merchant licensed with the Commodity Futures Trading Commission). TradeStation Securities is a member of the Financial Industry Regulatory Authority, the National Futures Association, and a number of exchanges.
Options trading is not suitable for all investors. Your TradeStation Securities’ account application to trade options will be considered and approved or disapproved based on all relevant factors, including your trading experience. See www.TradeStation.com . Visit www.TradeStation.com for full details on the costs and fees associated with options.
Margin trading involves risks, and it is important that you fully understand those risks before trading on margin. The Margin Disclosure Statement outlines many of those risks, including that you can lose more funds than you deposit in your margin account; your brokerage firm can force the sale of securities in your account; your brokerage firm can sell your securities without contacting you; and you are not entitled to an extension of time on a margin call. Review the Margin Disclosure Statement at www.TradeStation.com .
TradeStation Securities, Inc. and TradeStation Technologies, Inc. are each wholly owned subsidiaries of TradeStation Group, Inc., both operating, and providing products and services, under the TradeStation brand and trademark. When applying for, or purchasing, accounts, subscriptions, products and services, it is important that you know which company you will be dealing with. Visit www.TradeStation.com for further important information explaining what this means.

$GM Continued Uptrend LONGRisk is the political landscape, but upside is 30% with sector P/E OF 8-11 excluding $TSLA.
You're getting fair value here with upside of forward EPS of >$10.
$10*8=80
Don't overthink it, ride the trend up. President could mess it up but until then we're wave riding.

GM Faces Pressure After Mixed Earnings and Key Technical BreakdoMarket Sentiment Overview
General Motors is under scrutiny after reporting better-than-expected revenue but revealing a net loss due to one-time charges. This mixed outcome has heightened volatility in GM's stock, with significant downward momentum visible in recent trading. The market appears to be recalibrating expectations amidst a challenging macroeconomic environment and sector-specific headwinds.
1. Technical Breakdown: The recent decline has broken below critical trendlines, signaling bearish sentiment and creating a wait-and-see environment for traders seeking a recovery or further downside momentum.
2. Gamma Exposure and Sentiment:
* Strong put wall concentrations below current levels suggest key support zones where downside momentum may slow.
* Limited call interest indicates weak bullish sentiment, keeping upward potential constrained unless broader market sentiment improves.
Gamma Exposure Highlights
1. Resistance Levels:
* Second Call Wall at 54: Moderate resistance, limiting immediate upside potential.
* Call Resistance at 55: A critical cap, unlikely to be breached without significant bullish momentum.
2. Support Levels:
* Second Put Wall at 48: Strong gamma support zone; price action here may stabilize in the short term.
* Highest Negative GEX at 45: Represents substantial put interest, where selling pressure could exhaust.
3. Volatility Metrics:
* IVR (Implied Volatility Rank): 47.7, indicating elevated implied volatility compared to historical ranges.
* The Puts-to-Calls Ratio (75.6%) heavily favors bearish sentiment, further emphasizing downward pressure.
Forecast for Tomorrow
* Bearish Bias: The combination of mixed earnings, technical breakdowns, and elevated negative gamma exposure suggests a continued bearish tone. However, strong support near the highest negative GEX levels could provide some stability.
* Neutral Scenario: Consolidation within the defined support/resistance range is also possible as traders await more clarity on GM’s outlook and broader market conditions.
Key Themes to Monitor
1. Earnings Sentiment: Mixed results have introduced uncertainty; any updates or commentary on future growth plans could influence sentiment.
2. Macro Trends: Broader market conditions, including consumer confidence and manufacturing data, will play a role in dictating GM’s price action.
3. Technical Recovery Potential: Traders will watch for signs of stabilization near gamma support levels to gauge if buyers will step in.
Conclusion
GM is at a critical juncture, with sentiment leaning bearish following mixed earnings and technical breakdowns. Elevated volatility and significant gamma exposure levels indicate potential for short-term price swings, but strong support zones may limit further downside. Traders should remain cautious and keep a close eye on broader market cues and GM-specific developments.
Disclaimer: This overview is for informational purposes only and does not constitute financial advice. Please conduct your own research and trade responsibly.

Broken Resistance re-testing area supported by OBV divergence Broken Resistance re-testing area supported by OBV divergence and William Vix indicator is a good indication also 50 is Low Gamma for weekly myonsa.com

Idea simpleThis can go one of 2 ways as the diagram shows but we will be seeing 45.00 again as it is now to be tested as support as we have failed to breakthrough 2021-2022 double top resistance and are currently red for the second week. looking like 2025 is the tell all for GM.

GM - an easy follow up on adequate fundamentalsHi , again traders we are continuing to our next positive stock outlook which we would look into, as we have followed up on the recent fundamentals how President Trump wants to focus and invest a big amount of his attention in the local production and in general in local institutions and adding the outlook of all the tarrifs that he will impose starting from neighbouring countries MEXICO & CANADA all the way to Europe and the biggest impact on China. Based on that I would be extremely bullish into the current example of GM as to they have shown amazing financial reports, they are sitting on a P/E ratio of 5.98 and an outstanding EPS at 9.37. So this is why I would like the completion of the current bull flag towards the strong resistance level before we revisit and go over future attention to this company
Entry 54.90
Target 65.47
As always happy trading!

General Motors ,,, Buy opportinity Uptrend
It's been a small correction in this great uptrend, and I am waiting for a good bullish candle in this S/R level to get a new position on it.
As you see in the chart, there are two Doji candles (neutral) on the line that means the power of Bulls and Bears are equal.
Buy recommended after forming a good bullish candle.

GMA nice inverted HS. Target is $64
Just FYI: DMA200 is often a nice dynamic support to go long. Reinforced by the VWAP, anchored to the start of the impulse.

$GM with a bullish outlook following its earnings #StocksThe PEAD projected a bullish outlook for NYSE:GM after a positive under reaction following its earnings release placing the stock in drift A with an expected accuracy of 71.43%.


GM General Motors Company Options Ahead of EarningsIf you haven`t bought the dip on GM:
Now analyzing the options chain and the chart patterns of GM General Motors Company prior to the earnings report this week,
I would consider purchasing the 50usd strike price Calls with
an expiration date of 2024-11-1,
for a premium of approximately $1.29.
If these options prove to be profitable prior to the earnings release, I would sell at least half of them.

Will GM be electrified, or will combustion pull it down?CAPITALCOM:GM was in a nice uptrend on the daily all the time since November last year, and then it broke down, leaving the path big time. Made its way back up, only to be pushed back out. Now, it is once again knocking on the door from below. Should it be able to cross into the channel, I believe it could potentially move up towards the recent high of around $50, where it would run into resistance. I would look for a break into the channel, keep an eye of the $50 mark, and then decide forward. Breaking down, there is support just above. $42. Breach of this would open for a short.

General Motors (GM) Shares Surge Nearly 10%General Motors (GM) Shares Surge Nearly 10%
According to the chart for General Motors (GM), the following points stand out:
→ Yesterday, the share price closed above $53, a significant rise from just below $49 the previous day.
→ Since the beginning of the year, the stock has experienced an increase of around 50%.
The sharp rise in price can be attributed to the company's robust Q3 earnings report:
→ General Motors reported a 10% year-on-year increase in gross revenue for Q3, reaching $48.75 billion, significantly higher than analysts' expectations of $44.67 billion.
→ Earnings per share climbed by 30% year-on-year to $2.96, compared to a forecast of $2.49.
→ Additionally, the company raised its earnings guidance for the next quarter and indicated that it is intensifying efforts to launch autonomous vehicles.
Technical analysis of General Motors' stock reveals that:
→ In 2024, the stock has formed an upward channel (highlighted in blue), and the current price has reached its upper boundary.
→ The psychological barrier at $50 per share, which has acted as resistance since July, has now been breached. Notably, the $42 level served as resistance for several months before changing its role; $50 may follow this pattern in the future.
→ The RSI indicator has entered overbought territory.
Will the stock's upward trajectory continue? It is plausible that as investor enthusiasm from the strong earnings report subsides, GM's share price could experience a correction. This seems likely, given its proximity to the upper channel boundary and the overbought status indicated by the RSI. In such a scenario, the price could drop back towards the median line of the blue channel.
According to TipRanks, 11 out of 20 analysts recommend buying GM shares, with an average target price of $55 within the next 12 months. Given the strong fundamental data from General Motors, analysts' forecasts for GM stock may be adjusted upwards.
This article represents the opinion of the Companies operating under the FXOpen brand only. It is not to be construed as an offer, solicitation, or recommendation with respect to products and services provided by the Companies operating under the FXOpen brand, nor is it to be considered financial advice.

GENERAL MOTORS rally expected ahead of major 1W Golden CrossGeneral Motors (GM) is close to a Golden Cross on the 1W time-frame, which is a major bullish development as since its first trading days in November 2010, it has only been formed twice.
The first one was on the week of June 19 2017 and second on March 29 2021. In both cases, the price rallied aggressively and reached the 2.0 Fibonacci extension of the pull-back that took place before. On top of that, its last two lows and the August 05 in particular, tested and successfully held both the 1W MA50 (blue trend-line) and 1W MA200 (orange trend-line).
As a result, we expect the price to extend the rally and target at least $65.00.
-------------------------------------------------------------------------------
** Please LIKE 👍, FOLLOW ✅, SHARE 🙌 and COMMENT ✍ if you enjoy this idea! Also share your ideas and charts in the comments section below! This is best way to keep it relevant, support us, keep the content here free and allow the idea to reach as many people as possible. **
-------------------------------------------------------------------------------
💸💸💸💸💸💸
👇 👇 👇 👇 👇 👇
