Hood gonna pop. people like to gamba. volumes gonna go crazyRobin Hood is a legendary heroic outlaw originally depicted in English folklore and subsequently featured in literature, theatre, and cinema. According to legend, he was a highly skilled archer and swordsman.
Trade ideas

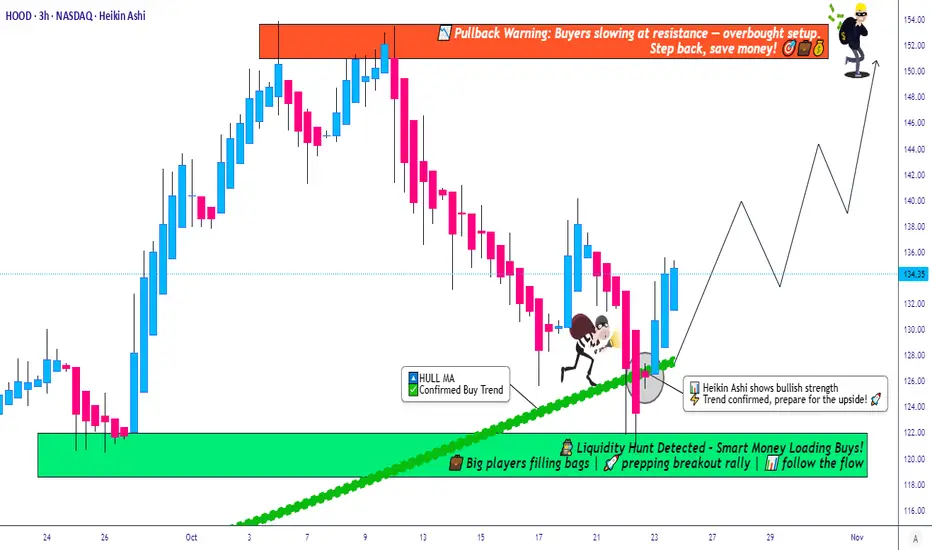
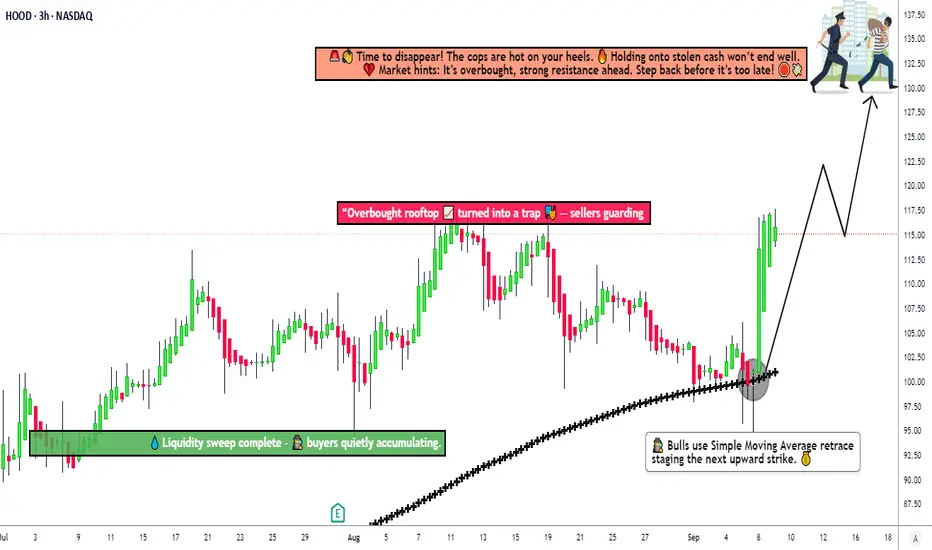
Is HOOD Ready for a Bullish Comeback?🎯 HOOD: The Pullback Heist - When Robinhood Gets Robbed! 💰
📊 Asset Overview
Robinhood Markets Inc. (HOOD) - Because even Robinhood needs a little robbing sometimes! 🏹
🔍 Technical Setup - The Perfect Storm ⛈️
Ladies and gentlemen, gather 'round! We've got ourselves a textbook setup that's so clean, even your grandma's trader boyfriend would approve!
What's Cooking:
✅ Demand Zone Double Bottom - Price said "nah, I'm good down here" twice!
✅ 786 Hull Moving Average Pullback - The golden fibonacci level that traders dream about
✅ Heikin Ashi Bullish Doji - Indecision turned into a straight-up reversal signal
✅ Buyers Flexing Strength - The bulls are back in town, and they brought receipts! 📈
🎯 The Heist Plan - "Thief Strategy" Layering Edition
💵 Entry Strategy (Choose Your Adventure):
Option 1: YOLO Entry 🎲
Jump in at any current price level (for the degenerates with strong conviction)
Option 2: The Thief's Layered Approach 🧅
Multiple limit buy orders to average in like a professional sniper:
🎯 Layer 1: $126.00
🎯 Layer 2: $130.00
🎯 Layer 3: $134.00
(Pro tip: Add more layers based on your risk appetite and portfolio size)
🛡️ Risk Management - Don't Be a Hero
Stop Loss: $120.00 🚨
⚠️ Reality Check: This is the Thief's stop loss, but YOU need to manage YOUR risk. This isn't financial advice - it's just one trader's playbook. Take profits, cut losses, and live to trade another day!
🎯 Target Zone - Where We Cash Out
Target: $150.00 🎊
Why we're taking profits here:
📍 Strong resistance at higher highs
🔥 Overbought conditions brewing
Potential trap zone - don't be the last one at the party!
⚠️ Friendly Reminder: This is MY target, not a command. You do you! Scale out, take partials, or hold for Valhalla - it's YOUR money and YOUR decision!
📈 Related Pairs to Watch - The Correlation Game
Keep your eyes on these connected movers:
NASDAQ:SOFI (SoFi Technologies) - Fellow fintech disruptor, tends to move in sympathy
NASDAQ:COIN (Coinbase) - Crypto exposure correlation with retail trading volume
SET:SQ (Block Inc.) - Payment processing and fintech sector bellwether
NASDAQ:AFRM (Affirm Holdings) - BNPL fintech momentum tracker
Key Correlation Point: When retail trading volume spikes or crypto markets heat up, HOOD typically catches a bid alongside its fintech cousins. Watch sector rotation patterns!
📝 Trade Management Tips
🎪 Scale in gradually if using the layer strategy
📊 Monitor volume - confirmation is key!
⏰ Watch intraday levels for day trading setups
🎢 Swing traders - give it room to breathe on the daily chart
🔔 Set alerts at key levels so you're not glued to the screen
⚡ Final Thoughts
This setup is cleaner than a hospital floor! The confluence of technical factors here is chef's kiss. But remember - markets are wild, unpredictable beasts. Trade what you see, not what you hope!
Stay sharp, stay disciplined, and may the pips be ever in your favor! 🎰
✨ If you find value in my analysis, a 👍 and 🚀 boost is much appreciated — it helps me share more setups with the community!
#HOOD #RobinhoodStock #SwingTrading #DayTrading #TechnicalAnalysis #StockMarket #ThiefStrategy #BullishSetup #DemandZone #PullbackPlay #FinTech #TradingIdeas #PriceAction #RiskManagement #TradingStrategy #LayeringStrategy #HullMA #HeikinAshi
Momentum QuantSignals AI Screener 2025-11-01Momentum QuantSignals AI Screener 2025-11-01
🎯 UNUSUAL OPTIONS ACTIVITY DETECTED
AI Momentum Scanner Results
🎯 TOP STOCK MOMENTUM OPPORTUNITIES
NASDAQ:PYPL - Score: 72/100
• Setup: Strong order imbalance (+66.7%) and tight spreads indicate institutional accumulation.
• Catalyst: High buying pressure breakout above $70.00 resistance.
• Target: $75.00 within 3 days.
• Options: $70 CALL exp 2025-11-07.
• Risk: Close below $68.50 invalidates setup.
NASDAQ:INTC - Score: 68/100
• Setup: High liquidity with +63.4% buying imbalance signaling momentum shift.
• Catalyst: Breakout above key $40.00 psychological level.
• Target: $42.50 within 4 days.
• Options: $40 CALL exp 2025-11-07.
• Risk: Failure to hold $39.50 support.
NASDAQ:SOFI - Score: 65/100
• Setup: Recent base formation with volume acceleration pattern.
• Catalyst: Break above $8.50 with expanding volume.
• Target: $9.25 within 5 days.
• Options: $8.50 CALL exp 2025-11-14.
• Risk: $8.20 support break.
NASDAQ:ARM - Score: 63/100
• Setup: Consolidation near highs with rising relative strength.
• Catalyst: Momentum continuation above $120.00.
• Target: $128.00 within 3 days.
• Options: $120 CALL exp 2025-11-07.
• Risk: $117.50 failure level.
NASDAQ:MARA - Score: 60/100
• Setup: Crypto-correlated momentum with volume spike.
• Catalyst: Bitcoin momentum breakout above $70,000.
• Target: $25.00 within 2 days.
• Options: $23 CALL exp 2025-11-07.
• Risk: $21.50 support break.
⚠️ Risk Management: Use 2-3% position sizing. Momentum can reverse quickly.
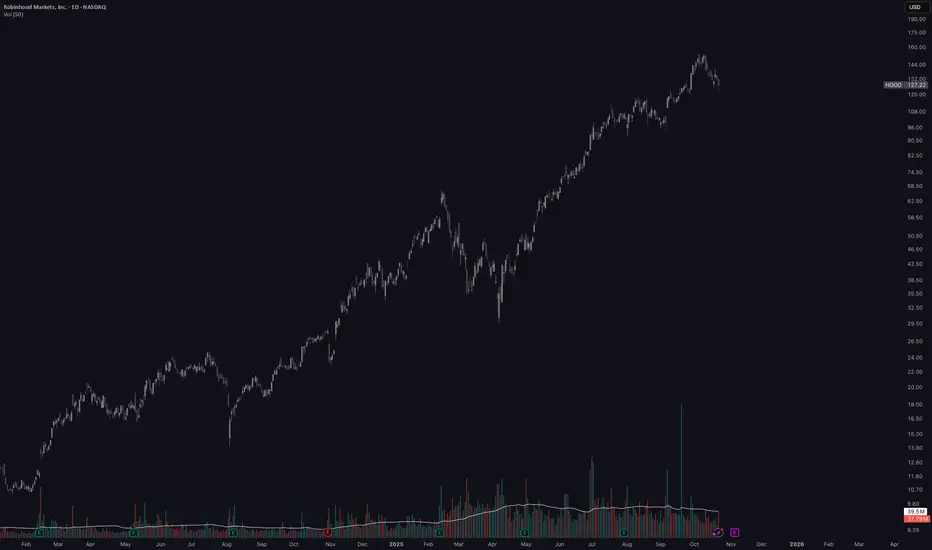
HOOD Bullish Breakout? Flag Continuation Toward 170/185HOOD’s 1D trend remains decisively up after a run from ~$70 to above $155, with price consolidating around $144.80 in what looks like a Bull Flag. The key supply is the recent peak near $155.40, while demand sits at prior resistance-turned-support around $125.75, broadly aligning with the MA60. Volatility has cooled, consistent with a maturing consolidation.
Primary path: look for a break-and-hold through the flag’s upper boundary near $150–$152, then a daily close > $155.50 to confirm continuation. If that triggers, the next objectives are the psychological $170 and a measured move toward $185. For positioning, conservative traders can wait for the close > $155.50; aggressive participants might stalk the $135–$138 pullback zone only with bullish confirmation. For breakout longs, a pragmatic invalidation sits beneath $147; for range-bound longs, below $132.
Alternative path: failure to reclaim $150–$152 and a daily close < $135 would warn the flag is failing, opening a deeper test toward $120. A decisive close below $125.75 would negate the broader bullish setup in the near term and shift bias bearish until reclaimed.
This is a study, not financial advice. Manage risk and invalidations.

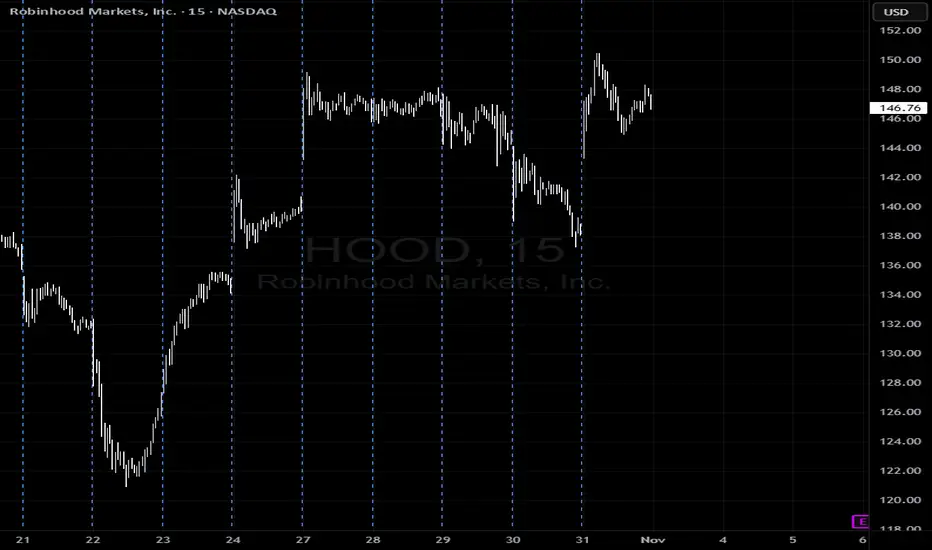
Playing the HOOD BounceHood took a big fall today, I'm long @ 122.80, I paired it with selling a 10/24 CALL option @ 125. If it hits, it will represent a 3.5% gain in 2.5 trading days. If it fails to hit, it lowers my entry point to 122.70
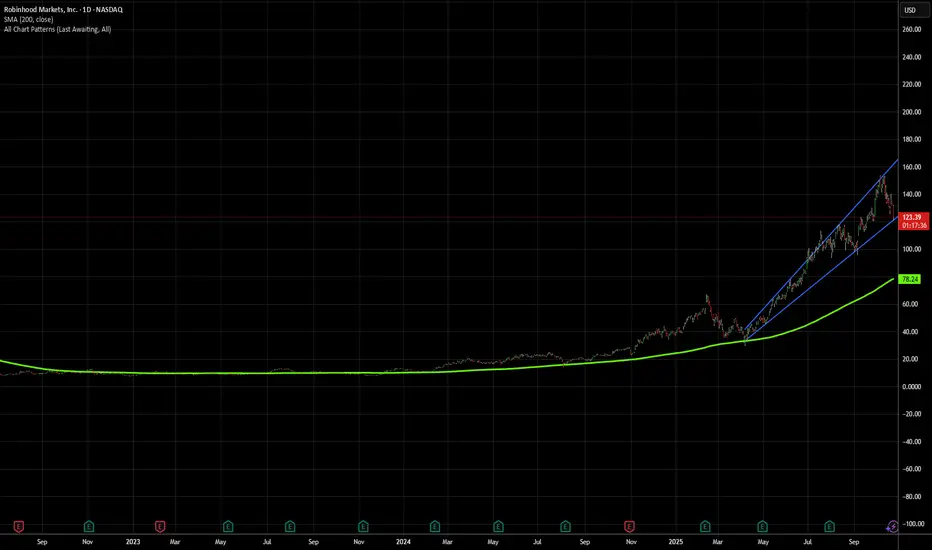
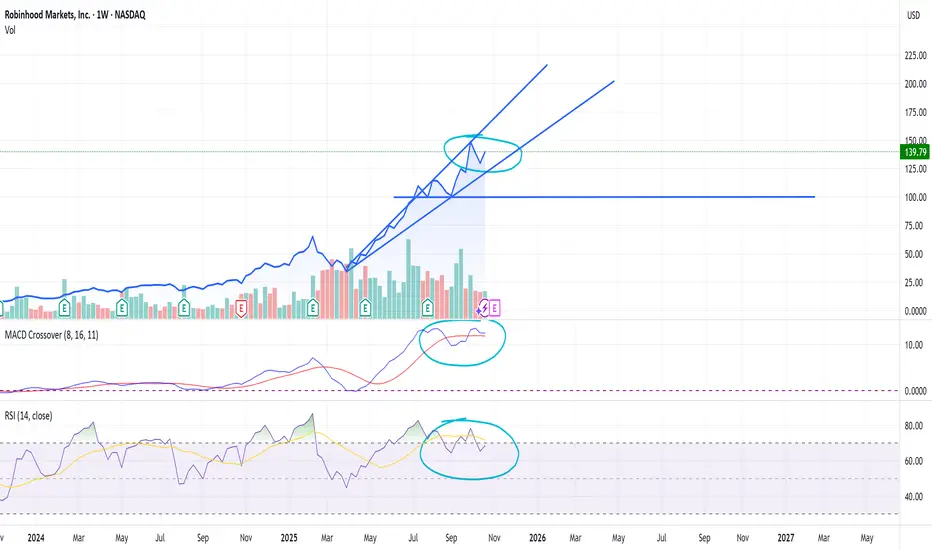
Over extended - a bit higher? or drop to $1006 Months of Green since April 25, now a monthly Red candle.
Weekly showing overbought. It could go a little higher, then drop. Base support would be $100
$HOOD: The market is pricing yesterday’s app, not tomorrows.Robinhood has bounced around this year, and the easy take is that the move is already done. That view is dated. The market keeps valuing HOOD like a single-product US brokerage. The 2025 version looks more like a lightweight bank plus payments and credit plus global crypto rail plus options powerhouse. That bundle throws off more and more durable cash than the meme app label implies.
What changed under the hood
It is solidly profitable. Robinhood moved from proving it can make money to showing it can stack it, with meaningful operating leverage as assets and engagement scale.
Idle cash is a quiet engine. When customers park cash, the company earns a spread. Sweep balances have grown fast, creating a recurring, rate-sensitive annuity that does not depend on frenetic trading.
Optionality everywhere: card, retirement, crypto, events.
The Gold Card turns high-intent traders into daily spenders, boosting interchange and nudging more users into the paid Gold tier.
The IRA with match deepens wallet share and keeps assets stickier.
Crypto expansion plus acquired licenses open doors outside the US and widen the product set.
Event and prediction markets increase session frequency, which is the lifeblood of any consumer finance platform.
That is not a conventional brokerage. That is a financial OS for the under-40 cohort.
Valuation check
On surface multiples, HOOD screens expensive versus legacy brokers. That is the easy bear case. The better question is whether the market is over-charging for cyclical growth or under-charging for structural growth. The mix is tilting structural: net interest from sweeps, card interchange, retirement assets, securities lending, and crypto spreads reduce dependence on bursts of volatility. Even in sleepy markets, those lines hum.
The underrated thesis in three bullets
Bundling creates pricing power. Free trades were the entry. The margin lives in the bundle. Gold subs plus card plus retirement make each feature amplify the others and raise switching costs. That looks more like software ARPU expansion than traditional brokerage take rate.
International is barely in the story. US comps miss what a licensed, mobile-first, crypto-capable onramp can do in Europe and the UK where fees remain fatter and habits are shifting. Licenses plus local rails equal real optionality.
Engagement glue matters. Events and prediction markets are not about revenue today. They keep attention during dull markets so the platform is top of mind when volatility returns.
What could break it
Regulation is the evergreen risk, especially around crypto, and lower rates would compress net interest margins. Those risks are known and already haircut into sentiment. Execution against licensing, card adoption, and retirement asset growth is the counterweight.
Bottom line
If you price HOOD like a US discount broker, it looks rich. If you price it like a high-margin, software-style financial platform with a growing annuity base, expanding rails outside the US, and a daily card and retirement relationship, today’s multiple looks far more reasonable. The market keeps arguing about 2021. Robinhood is building a 2027 balance sheet.
Not investment advice. Manage risk, size positions, and beware of letting a cashback card talk you into extra snacks.
Levels to trade HOOD's confirmed Wyckoff Markdown phaseBias: The current short-term trend is strongly bearish. It is immediately oversold, suggesting a short-term bounce is likely before the next major leg down.

ROBINHOOD MARKETS INC.It is not just the SPX that completed
a 180 calendar day count over the
weekend. HOOD did also. Keep
an eye on HOOD.
IN MY OPINION ONLY!!!!! Robinhood just may crash as the stock market crashes.
Brokers like HOOD are starting to crash. This is your "canary in the coal mine." Once we get a full on correction HOOD and other brokers will lose at least 50% of their value from the top. Investors will stop buying stocks. They say there are now only 65 million boomers left in the US. I'm one of them. As the boomers start dying at ever faster rates, they tend to invest less of their money in the stock market. (MY OPINION ONLY)

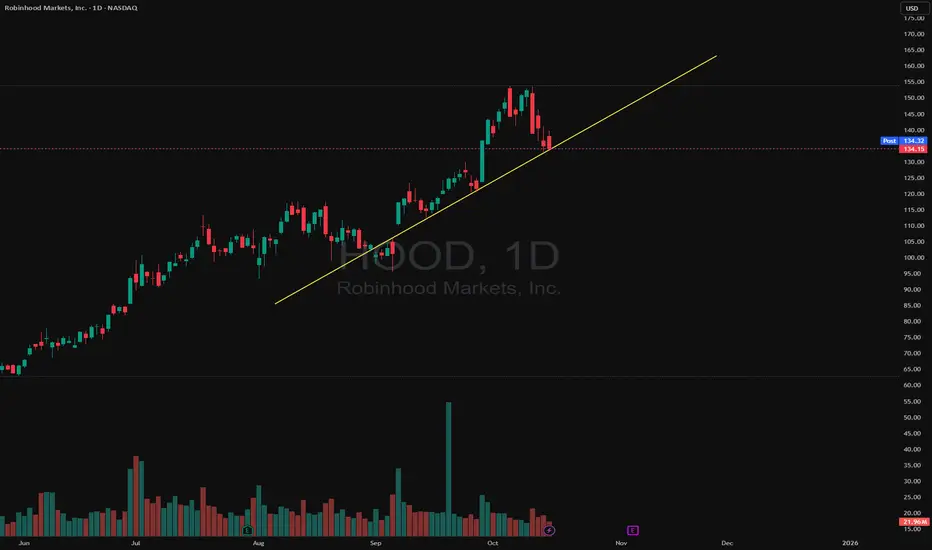
$HOOD by OceanNASDAQ:HOOD is retesting its ascending trendline after a strong rally. The stock continues to form higher highs and higher lows, keeping the uptrend intact.
It’s on high watch for next week —
Bullish scenario: A move above $140 could confirm momentum for a retest of the $155–$160 resistance zone.
Bearish scenario: A break below $130 would signal trend weakness, with $118–$120 as the next support area.
👉 Watch the $133 level for a potential CALL confirmation if buyers step back in.
HOOD — In Key Macro Resistance ZonePrice has reached a major resistance zone, with the 110 level marking an ideal spot where downside pressure may begin to dominate and a mid-term top could start forming. Macro support for the macro-uptrend structure is at the 80–65 area.
Hedging near current levels may be prudent - especially ahead of earnings and while volatility remains relatively cheap.
Weekly view
Daily view:
Thank you for your attention and I wish you successful trading decisions!
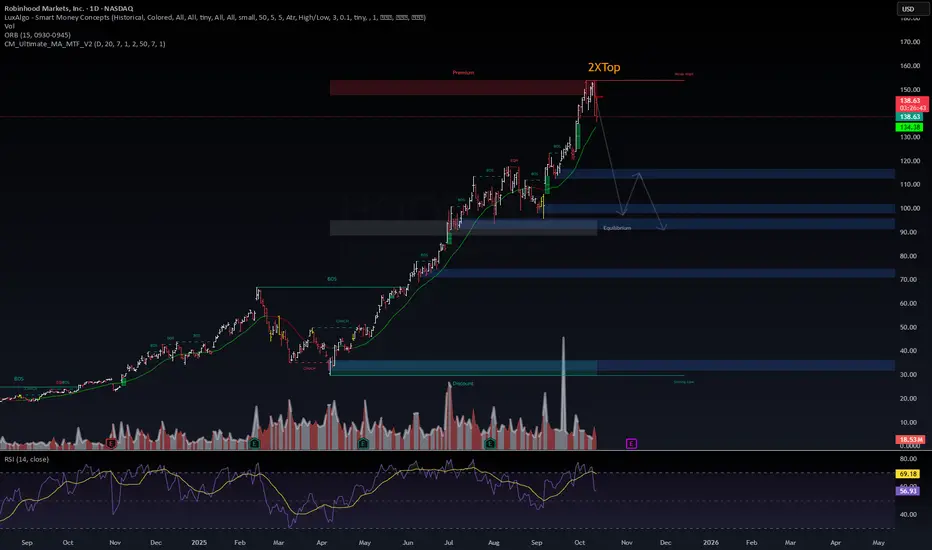
$HOOD — Double Top Confirmed?📉 NASDAQ:HOOD — Double Top Confirmed?
Robinhood formed a clean 2X Top around $155, rejecting from the premium zone with strong volume confirmation. Price is now retracing under the daily BOS, testing 138–134 — the prior short-term demand.
💡 Trade Setup:
🐻 Bias: Short-term bearish continuation
Entry: near 138–140 (after rejection confirmation)
Target 1: $125–$120 (previous structure demand)
Target 2: $110–$105 (equilibrium zone)
Stop: >150 (above 2X top zone)
📊 RSI rolled over from 70 → 57, signaling loss of momentum. Until HOOD closes above 150, rallies may face heavy supply.
#HOOD #Trading #SMC #VolanX #WaverVanir #Stocks
Not Investment Advice ⚡
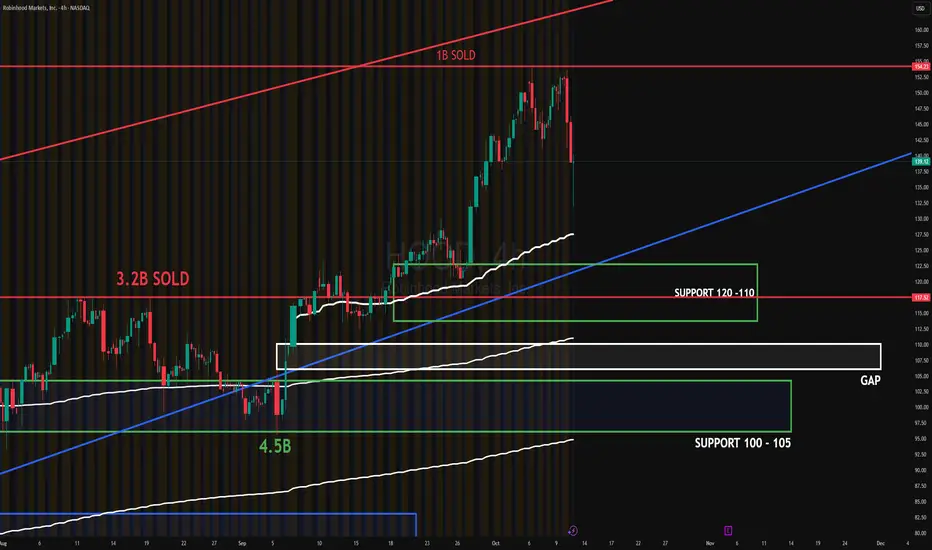
HOOD OCT - 2025HOOD 4H — Clear rejection at 154–155 supply where heavy selling hit; price pulled back but still above the rising trend. Distribution evident near 154; prior absorption sits at 120–110 and again at 100–105. Watch the open gap around 110–108 if momentum fades.
• Target up: 145 first, then 154–155 retest
• Target down: 130, then 120–110 (gap fill to 110–108), extension 100–105
NASDAQ:HOOD #globaltrade #investment #investing #stockmarket #wealth #realestate #markets #economy #finance #money #forex #trading #price #business #currency #blockchain #crypto #cryptocurrency #airdrop #btc #ethereum #ico #altcoin #cryptonews #Bitcoin #ipo
Hello trader, easy money with HOOD: This HAPPENED TODAY 10/10/25www.tradingview.com
anticipating entries simply because this strategy is free, no, it doesn't mean it has no value. This scheduled entry is a liquidity entry. As you can see, there's a possible rebound in the 148.00 area.
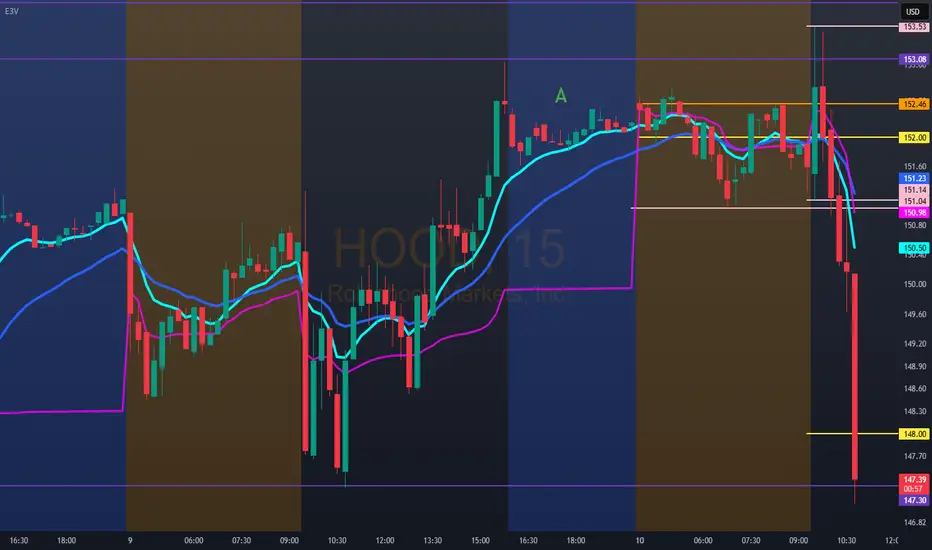
Hello trader, for tomorrow, HOOD: 152.46 10/10/25Hood is showing a double top. Bullish entry above 154.00/156.00.
Technical bearish entry below 152.00. The stock could set a bearish stop and then seek bullish entries.

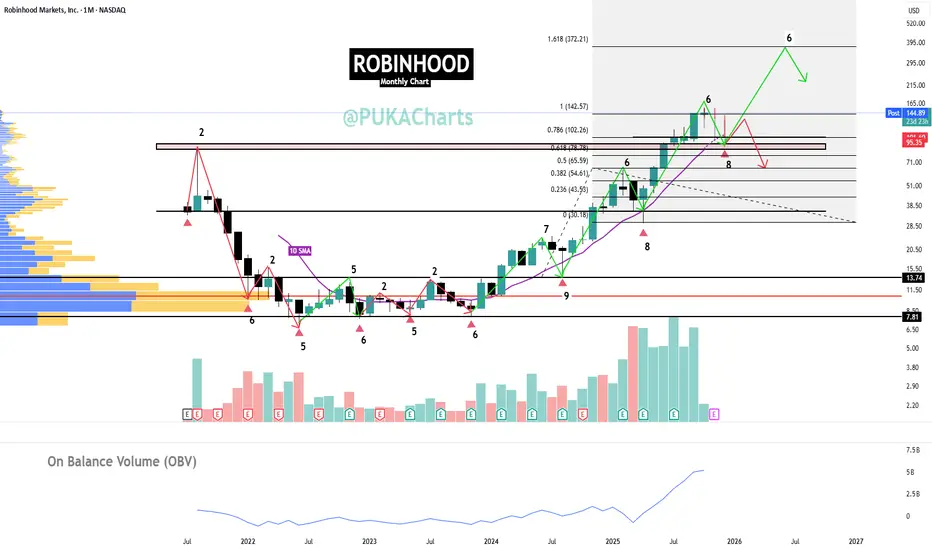
ROBINHOOD - $HOOD - Cycles Study / Profit taking / Monthly Chart
ROBINHOOD - NASDAQ:HOOD
✅868.40% unrealized profit to date.
🖊️Average Buy In: $13.74 / Price Today $144.90
⚠️Looking to extract some profit and consider re-entry
▫️ We have hit the 1.0 Fib extension level resistance.
▫️Since up thrust, cycles bottom to bottom 8 - 9 months
▫️ Top of right translated cycles (green) have been 6 - 7 months. We are in a month 6 now. Probable move down into month 8 or 9. Month 7 to decide direction. Left translated cycles are in red.
▫️ I will remove 30% position here and re-enter on a visit of 10 month moving average and bounce. TRADERS CAN ENTER FOR BOUNCE FROM 10 MONTH SMA.
▫️70% to remain allocated, in case of further upside in the event of no 10 month SMA revisit in month 7 - 9.
▫️ If the 10 month moving average does not hold and is lost (first warning).
▫️If the $87 level is lost on a weekly close, I will exit full position.
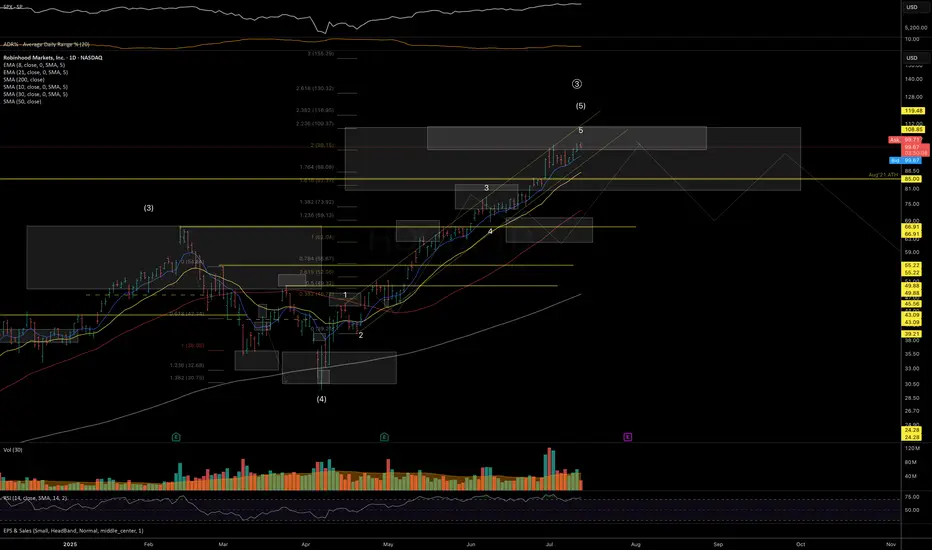
Is Robinhood (HOOD) Set To Soar? Analysis & Entry Plan.HOOD: The Money Heist Plan 🎭💰
Asset: ROBINHOOD MARKETS INC (HOOD)
Timeframe: Swing Trade / Day Trade
Direction: Bullish
🎯 The Thief's Entry Plan (Layered Strategy)
Ladies & Gentlemen, Thief OG's! 🎭 The plan is to enter using a layered limit order approach. This allows for scaling into the position and optimizing your average entry price.
🛒 Layer Buy Zones: 108.00 | 110.00 | 112.00 | 115.00
Pro Tip: You can add more layers based on your capital and risk appetite.
⛔ The Escape Route (Stop Loss)
Every good thief needs an exit strategy. This is mine, but adjust based on your own risk!
🚨 Thief's Stop Loss: $102.00
A break below this level suggests the heist is compromised.
🎪 The Getaway (Take Profit)
The strong resistance and potential trap (overbought signals) are near our target. Escape with the stolen money before the "police barricade" forms!
💰 Primary Target: $130.00
Disclaimer: This is my plan. I am not recommending you use only my SL/TP. Manage your risk and take profits at your own discretion.
🔍 Why This Heist? The Bullish Case:
This isn't a random grab; it's a calculated plan based on multi-factor analysis.
📊 Fundamental & Technical Fuel:
🚀 Rocketing Performance: YTD +208.29%! Trading near 52-week highs shows immense strength.
💪 Blowout Earnings: Q2 EPS of $0.50 smashed estimates by +41%. Revenue growth is explosive at +71.54% YoY.
💰 Profit Machine: A stunning 50.13% profit margin – this company is highly profitable.
📈 Technical Momentum: Price is in a powerful uptrend, using key EMAs as support.
🧠 Sentiment & "The Crowd"
😰 Fear & Greed Index (Neutral 52/100): The overall market is not in extreme greed, leaving room for upside.
Sub-indicators show Greed in Momentum, Volatility, and Junk Bond Demand – a risk-on environment.
Institutional Demand: Net institutional adds are positive (702 increased positions vs. 427 decreases), with major players like JPMorgan adding significantly.
Retail Buzz: Mixed sentiment post-earnings can create opportunities; the crowd is often late.
⚠️ Risks & The Bear Case (Know Before You Go!)
High Beta (2.36): HOOD is highly volatile and will amplify any market moves. Watch related indices: SP:SPX , NASDAQ:NDX , AMEX:IWM
Macro Events: The upcoming CPI Report (Sep 11) and Fed Meeting (Sep 16-17) are key risk events that could cause market-wide volatility.
Valuation Concerns: High P/E ratio (58.45) suggests the stock is priced for perfection; any misstep could lead to a sharp pullback.
Insider Selling: Executives have been net sellers. Always a note of caution.
📈 Related Pairs to Watch
Broader Market: SP:SPX , NASDAQ:NDX
FinTech Sector: AMEX:XLF , AMEX:IPO
Meme/Retail Sentiment: NYSE:GME , NYSE:AMC
🎭 Final Heist Debrief
Short-Term: Neutral market sentiment suggests cautious optimism. Watch the macro cues (CPI/Fed).
Long-Term: Bullish fundamentals are strong, but high volatility and valuation require smart risk management.
The plan is set. The layers are in place. Execute like a pro, manage your risk, and may the odds be ever in your favor!
✨ “If you find value in my analysis, a 👍 and 🚀 boost is much appreciated — it helps me share more setups with the community!”
#HOOD #Trading #SwingTrading #DayTrading #Bullish #Stocks #Investing #FinTech #TradingPlan #MoneyHeist #TechnicalAnalysis #Fundamentals
Vlad chickened out on top ↓- NASDAQ:HOOD phenomenal numbers will start to deteriorate as soon as trading volume dries up.
- This will happen the moment we enter a bear market or a correction.
- NASDAQ:HOOD will look overvalued in books, numbers for growth will turn south.
- Silver lining is Vlad Tenev emptied his bag and dumped it on institutional investors and retail investors.
- There would be race to exit very soon.
- Good luck everyone.

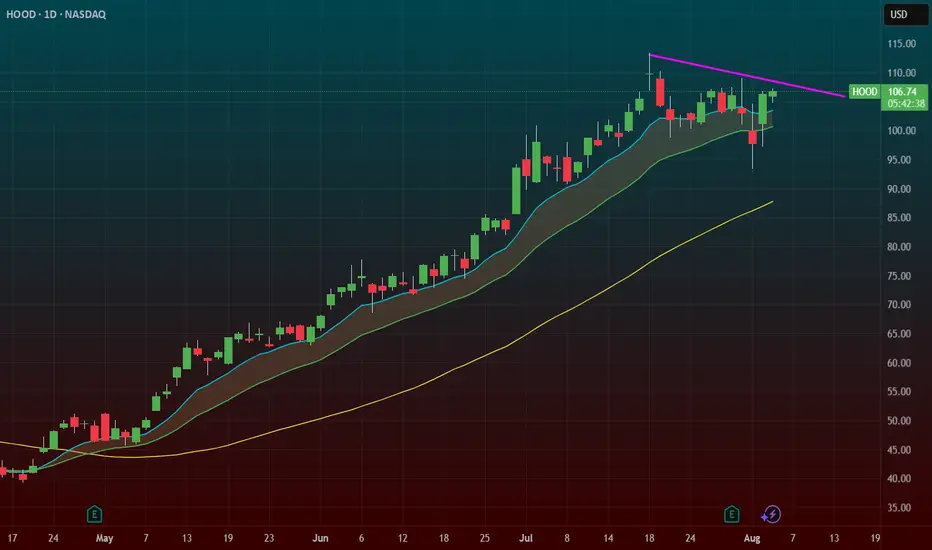
$HOOD – Flag Breakout Setup with Post-Earnings Shake & BakeNASDAQ:HOOD – Hot Momentum + Crypto Tailwind + Flag Breakout in Motion
Robinhood ( NASDAQ:HOOD ) is setting up for a momentum breakout after delivering a perfect post-earnings shake & bake — and now it’s reclaiming key levels with force.
🔹 The Setup:
After earnings, NASDAQ:HOOD flushed under $100, shaking out weak hands and triggering stop runs.
Since then, it's remounted the moving averages and is now pushing through the $107 breakout zone.
Price is flagging cleanly — compression before expansion.
🔹 Why It’s Got Juice:
Strong bounce post-earnings = real buyer interest.
Flag breakout forming with crypto sector strength ( CRYPTOCAP:BTC , CRYPTOCAP:ETH running).
NASDAQ:HOOD often rides crypto momentum — it’s a sleeper sector sympathy play.
🔹 My Trade Plan:
1️⃣ Position: Picked up $105 calls on the morning dip.
2️⃣ Add: Eyeing $110 calls with a few weeks out if we clear the flag.
3️⃣ Stop: Under today’s low or 9 EMA, depending on how it behaves into the breakout.
Why I Like It:
Shakeout + reclaim = powerful combo.
Flag structure is clean, volume is stabilizing, and crypto sector tailwinds add fuel.
When NASDAQ:HOOD runs, it runs fast — and it loves trending when sentiment flips.
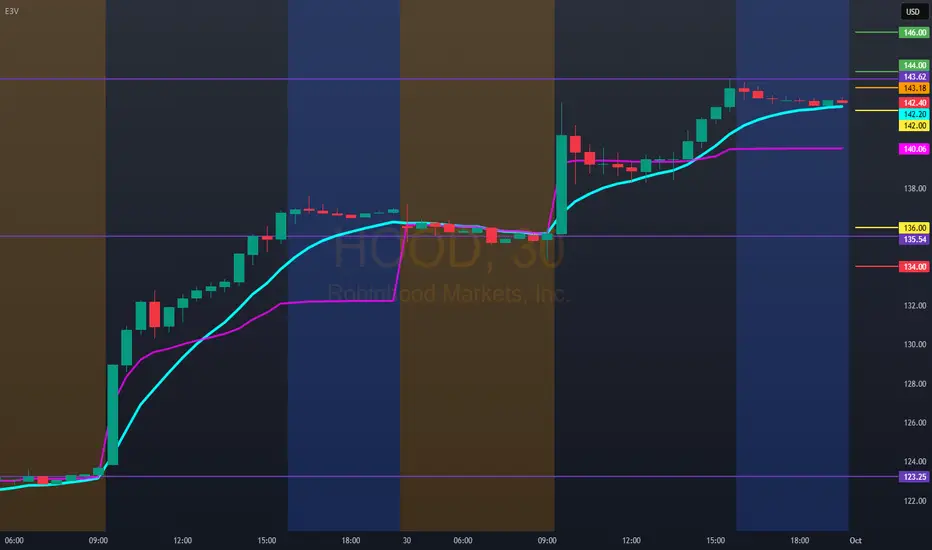
Hello trader, for tomorrow, 10/01/25, HOOD 143.18Bullish entry above 144.00/146.00 is overbought. Stop below VWAP.
Quick technical bearish entry below 142.00 to the 136.00 area. If there is a rejection in this area, the price could rebound, taking a bullish entry above VWAP. If it breaks 136.00, our bearish entry will reverse below 134.00.
Note: For my fellow PLTR traders: an entry above 186.00/188.00 is still pending. QQQ: Double top 602.00 pending an entry above 604.00/606.00.
Hood Plan Sept 30
Over 138.71 with volume → I’m riding it to 140.
Under 134.65 → I’m looking for 133.65.
Between 136–138 → just noise, I’ll chill.
🧠 Market feels shaky, so I’m not going all-in. Just keeping it light, take the quick wins, don’t overstay.
🐋 Big money is buying calls (bullish), but heavy sellers parked at 140. That’s the wall → I’ll cash out if we touch it.
✅ Simple read: scalp it up to 140, or fade it down to 133.65. Don’t force it if it chops around

Robinhood Markets, Inc. 1W NASDAQ NASDAQ:HOOD is exploring new highs. #HOOD is targeting $162.69, which is the target price based on the chart pattern. It's amazing how the crypto world is gaining more and more adoption every day. The top 5 digital currency exchanges (BNB, Coinbase, Robinhood, etc.) seem to be aiming for a price of $1000.There's a significant price gap in the range of $106 to $110.

HOOD – TA for Sep 29HOOD – Slipping in a Channel as Gamma Points to Big Floors and Ceilings ⚠️
1-Hour Technical Outlook
Robinhood continues to grind inside a descending channel, with sellers controlling the short-term structure. Price is hovering near $121.8, caught between lower highs and the key $120.6 pivot. MACD is negative but flattening, while the Stoch RSI is trying to rebound from mid-range, hinting at a possible pause or minor bounce before the next big move.
Upside resistance stands at $122.6 (immediate trendline cap) followed by $125 and $130. On the downside, the most critical support is $120–$119, with the next strong floor at $112.5.
Gamma Exposure (GEX) Confirmation:
Options positioning underscores these chart levels:
* Massive Call Resistance is stacked at $125 and $130, with ~94–96% call concentration there, forming heavy topside gamma walls.
* Strongest Put Support / Highest negative GEX lies at $112.5, creating a powerful downside cushion.
* Mid-range gamma pivot near $120 aligns with the channel floor, making it a key inflection point.
If HOOD can reclaim $125 on volume, dealers may be forced to hedge by buying, opening a path toward $130. A decisive break under $120 would likely trigger hedging pressure toward $115–$112.5.
Trade Ideas & Option Plays for This Week
* Bullish Play: Long on an hourly close above $125, targeting $130. Options: 1-week 125 calls or 125/130 call spreads to limit premium.
* Bearish Play: Short below $120, aiming for $115–$112.5. Consider 120/112.5 put spreads or short-dated puts for defined risk.
* IVR near 21 and IVx around 62 suggest premiums are moderately rich—good for credit spreads if you expect continued chop.
My Take
HOOD is still in a short-term downtrend, but gamma positioning shows very clear lines in the sand. Bulls must flip $125 into support to change momentum, while bears will press for a $120 breakdown to unlock lower targets.
Disclaimer: This analysis is for educational purposes only and does not constitute financial advice. Always do your own research and manage risk before trading.
