CBDCs in the World Trading System1. What Are CBDCs?
A CBDC is a digital form of legal tender issued by a country’s central bank. It is:
Sovereign-backed
Regulated and stable
A digital liability of the central bank
Designed for domestic and international use
CBDCs generally come in two forms:
Retail CBDCs – used by the general public for everyday transactions.
Wholesale CBDCs – used by financial institutions for large-value payments and settlements.
In the context of world trade, wholesale CBDCs hold greater significance due to their ability to streamline international payments and reduce reliance on intermediary banking systems.
2. Current Problems in the World Trading and Payment System
Before understanding the value of CBDCs, it's important to consider the limitations of the existing trading and settlement framework:
a. High Cost of Cross-Border Payments
International transactions often involve multiple banks, SWIFT messaging, and correspondent banking networks. This leads to:
Expensive transfer fees
Slow processing times
Reliance on intermediaries
b. Dollar-Dominated Global Trade
Over 80% of global trade is invoiced in USD. This creates:
Dependency on US monetary policy
Currency risk for emerging markets
High demand for dollar liquidity
c. Slow Settlement Processes
Cross-border trade can take days to settle due to:
Time zone differences
Compliance checks
Lack of common settlement rails
d. Fragmented Financial Infrastructure
Different countries use incompatible regulations, payment systems, and messaging formats, making interoperability difficult.
CBDCs are considered a strategic solution to all these challenges.
3. How CBDCs Can Transform the World Trading System
CBDCs have the potential to reshape global trade in multiple ways.
a. Instant and Low-Cost Cross-Border Settlements
CBDCs can enable near-instant settlements by connecting central bank systems directly through digital ledger technology (DLT).
Benefits:
Reduced transaction fees
Faster trade finance processes
Lower counterparty and settlement risk
b. Reduced Dependence on Intermediaries
Traditional cross-border payments rely on correspondent banks. CBDCs, however, enable:
Direct central bank-to-central bank transactions
Fewer intermediaries
Reduced complexity in the payments chain
This leads to greater efficiency and transparency.
c. Enhanced Transparency and Anti-Fraud Controls
CBDCs allow full traceability. This is advantageous for global trade because:
Money laundering can be detected easily
Fraud and trade-based financial crimes reduce
Compliance becomes more automated
With programmable features, central banks can embed smart compliance rules into the currency itself.
d. Strengthening of Local Currencies in Trade
If CBDCs become interoperable, nations may settle trades in their own currency instead of relying on USD.
This will help countries:
Reduce dollar exposure
Stabilize local exchange rates
Enhance monetary sovereignty
China’s Digital Yuan (e-CNY) is already being tested for cross-border trade to promote Yuan internationalization.
e. Programmability in Trade Finance
CBDCs can support programmable smart contracts, enabling automated trade functions such as:
Conditional payments
Automated customs clearance
Real-time shipment tracking linked to payment triggers
Smart invoices and escrow systems
This reduces human error, delays, and contract disputes.
4. CBDCs and Global Trade Networks
a. Interoperability Projects
Many global initiatives aim to connect CBDCs across borders:
mBridge (Hong Kong, China, UAE, Thailand, BIS)
Project Dunbar (Australia, Malaysia, Singapore, South Africa)
Project Icebreaker (BIS, Sweden, Norway, Israel)
These projects test how CBDCs can settle international trade without SWIFT.
b. Digital Trade Corridors
CBDC-enabled digital trade corridors can make it easier for regions to conduct business without dependency on legacy systems. They also facilitate:
Bilateral and multilateral trade agreements
Currency swap arrangements
Real-time settlement layers
c. Impact on SWIFT and Correspondent Banking
CBDCs could reduce global reliance on SWIFT. Although SWIFT is adapting through digital integration, CBDCs bypass many of SWIFT’s limitations.
5. Challenges and Risks of CBDCs in World Trade
Despite their potential, CBDCs face significant challenges.
a. Lack of Global Standards
Without common frameworks for:
Cybersecurity
Privacy
Settlement rules
Regulatory alignment
interoperability will be limited.
b. Cybersecurity Concerns
CBDCs increase vulnerability to:
Cross-border cyber-attacks
Systemic risk if central bank networks fail
State-sponsored digital warfare
c. Geopolitical Competition
Countries may use CBDCs to:
Avoid sanctions
Reduce dependence on dominant currencies
Create regional trade blocs
This could reshape global power balances.
d. Privacy Concerns
Governments may monitor transactions too closely, raising:
Data security issues
User privacy concerns
Risks of misuse of financial information
e. Impact on Commercial Banks
If businesses prefer using CBDCs for trade:
Commercial banks may lose transaction revenue
Deposits could shift away from banks
Banks may face funding pressure
Central banks must balance innovation without destabilizing financial institutions.
6. Future of CBDCs in the World Trading System
CBDCs are still in their experimental stage, but global momentum is strong:
Over 130 countries are exploring CBDCs
Over 20 countries are in pilot or launch phases
Major economies like China, India, UAE, and the EU are leading adoption
CBDCs will likely become a core settlement infrastructure in global trade within the next decade.
Future expectations:
CBDC-based trade hubs in Asia and the Middle East
Digital currencies replacing letters of credit (LCs)
Automation of global supply chain finance
Programmable trade contracts integrated into logistics systems
Rise of multi-CBDC platforms creating a unified digital trade layer
Conclusion
CBDCs represent a revolutionary step in the evolution of the world trading system. By providing a faster, cheaper, and more transparent method of cross-border settlement, CBDCs have the power to significantly reduce inefficiencies in global trade. They also promote monetary sovereignty, reduce dependence on the US dollar, and enable programmable trade finance. Although challenges such as cybersecurity, privacy, and geopolitical tensions persist, the direction of global finance clearly indicates that CBDCs will play a major role in shaping the future of international commerce.
Trade ideas
MSTR (possible short)Alot going on here, but its jus because I have been charting this out since around March.
BTC has a bearish setup where we could possibly see 92.5Kish.
Looking at MSTR which is a huge follower, we broke below the 200 on the daily.
My reasoning for possible short entry (red dot).
1. Trend Based Fib (3-point in green): shows we could bounce here, but extend down toe the $200 level.
2. We could bounce here because we are re-testing the monthly IB that we broke out, we are at the 50% quadrant of that IB.
3. However, we are currently trading within the 3M quarterly candle, and the HTF breakout we had was never re-tested. Sweeping this 3M candle, would put us in a good spot for long term growth.
4. Short entry would be red dot, with covering at the last high on daily ($358ish).

MSTR Bounce Time???Looking at the perfect pullback spot for MSTR. We rejected the 1.618 of my fib and have pulled all the way back to the 50% mark of the original fib value. As well, this is the POC of the consolidation zone before the last run up. I would expect buyers to show up here and try to defend.
This is not financial advice. Just telling you what I see and hope to see in the coming weeks.

MSTR falling into buying territory I’m planning to open a small starter position at today’s open to catch a short-term bounce. If price continues to dip, I’ll scale in gradually until my full position is built. From there, I’ll be targeting a move back to the upside toward my projected exit level.
157This channel is not providing individualized trading or investment advice, nor is it a banking service, brokerage service, trading service, investment service or money management service

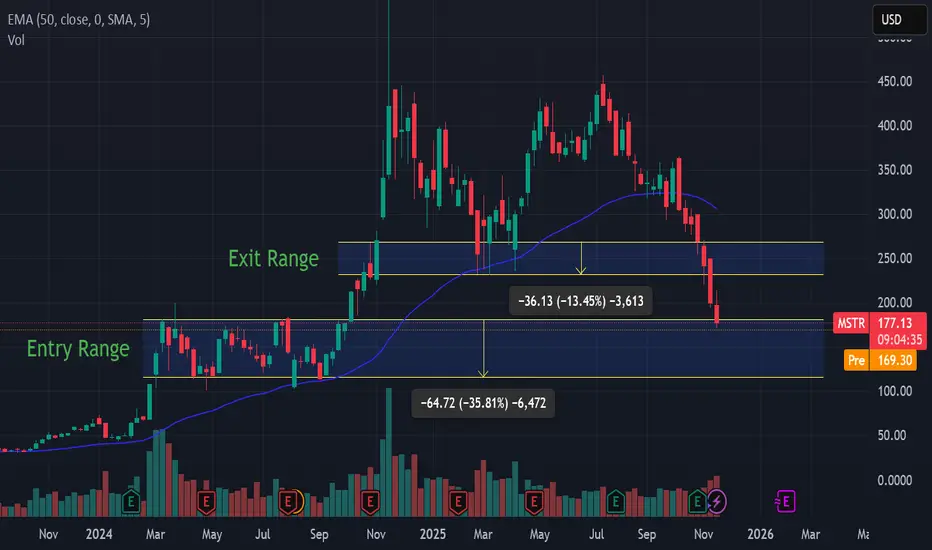
MSTR chart update. Bounce to $266-315 before more downside?Updating the prior chart as the levels I had were off. I think it's likely that we bounce from this level.
You can see we've now hit a key support and filled a gap that was on the chart at $176. I think it's likely that we see a strong bounce from this level.
Reasons being:
1. We're at a key support
2. 3 touches of bottom of flag, usually 4th one breaks it, 3rd creates a powerful move in the opposite direction
3. Strong call flow on MSTR the past few days
I think it's likely we bounce up to the $266 or 315 resistance levels. This is a trade, not a long term position to hold.
Let's see if it plays out. Breaking this level as lower support will open up the possibility to see lower levels.

MSTR to $676MSTR is on major support, looking to run to $676 once bitcoin lifts (currently just below it's long term trend buy area).
Good luck!

MSTR - Ripping Short Squeeze Could Be In The PipelineHas looked terrible for quite some time now.
And although it may not ever make another high, I think it may be time for a hard bounce.
Notice that as Bitcoin hits $94K, it has gone oversold on the week RSI and has re-tested the previous tier - 2024 peak.
For this to be a perfect setup, MSTR would be within the 1:1 Golden Window, but it is not - the 1:1 GW is slightly below.
This may signal that it may slip down a little more to that ratio band.
But bounces do also arrive without perfect ratio - especially in selling climaxes.
MSTR is a very popular stock for shorts and Michael Saylor seems to be a popular villain character amongst crypto bears.
So I think we may get a ripping short squeeze either here or slightly lower.
Remember that MSTR often leads Bitcoin at the start of bullish phases - so perhaps that may happen again.
If it did then we may see a swift recovery if Bitcoin is also finding a low 🤨.
This analysis is shared for educational purposes only and does not constitute financial advice. Please conduct your own research before making any trading decisions.

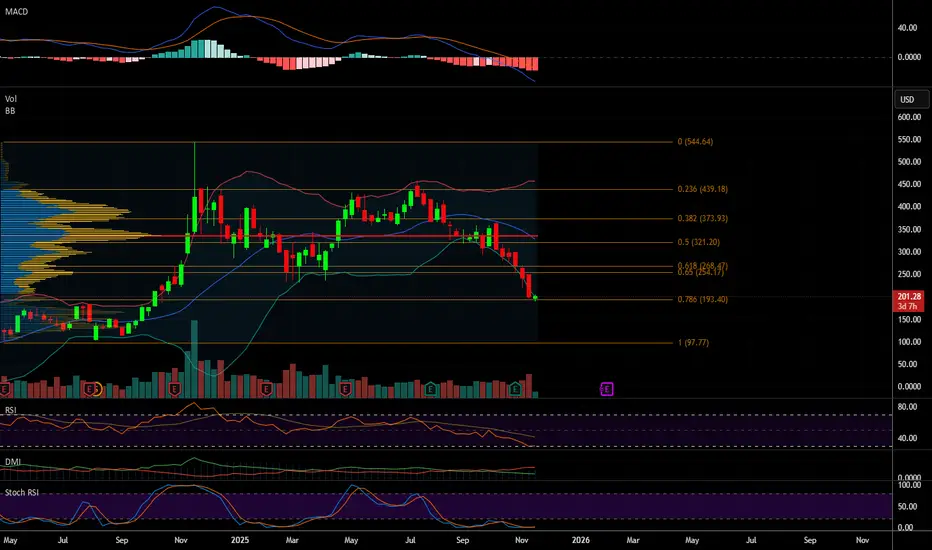
MSTR GOES 'BATSHIT STRATEGY', SHED 65% in 12 MONTHS. HERE'S WHY.Strategy stock ( traded as NASDAQ:MSTR ) has experienced dramatic volatility and a downward trend over the past 6 months, shaped by both technical factors and its close link to the cryptocurrency sector, particularly Bitcoin.
Technical Analysis
Strategy Inc stock saw significant declines over the last half-year and twelve-months periods, dropping nearly 65% from its highs. The technical readings depict a persistently bearish scenario:
The stock plummeted from $543 per share (reached a year ago) and from around $457 reached in May 2025 to $195 in November, marking a decline of more than 50%.
Relative Strength Index (RSI) metrics remain deep in oversold territory; recent values are in the teens and twenties, indicating very low momentum and signaling a potential exhaustion in selling pressure.
Key moving averages over the 50-, 100-, and 200-day periods all show substantial price declines, and the stock is trading well below all these averages.
Were you hoorayed recently in October (with hopium of 140K and above for bitcoin) but NASDAQ:MSTR has started so-called Uptober - under its major support - 52-week SMA (which was previously successfully broken in September, 2025).
Model 2020/21 has repeated in 2024/25: after the first swing-high printed, no new high anymore were posted - see green/red marks on the chart (Bitcoin did it in both cases).
Technically, Strategy Inc is at or near multi-month lows, having broken several support levels. Short-term momentum oscillators and slow stochastic readings remain extremely low, emphasizing ongoing market weakness.
Fundamental Developments
On a fundamental basis, Strategy Inc continues to be strongly correlated to crypto and digital asset movements, as its financials are heavily exposed to Bitcoin:
The decline mirrors the drop in Bitcoin prices over similar periods, given the company's massive holding of the digital currency on its balance sheet.
Revenue and operating performance are relatively stable compared to its crypto-linked metrics, but shareholders largely view NASDAQ:MSTR as a proxy for Bitcoin exposure, which adds extraordinary risk and volatility and (what important) an extra large "hopium" for NASDAQ:MSTR
The company regularly receives coverage from major investment analysts, though consensus remains divided due to the unpredictability of its underlying asset base.
Significant risks remains also if crypto markets continue their decline, which could amplify volatility and downside risk further.
Conclusion
Over the past 6 - 12 months, Strategy Inc stock has dramatically underperformed, mirroring crypto sector volatility and enduring technical weakness. While analysts see sizeable rebound potential, future prospects are highly sensitive to both digital asset price movements and broader market trends.
Investors should approach with caution, given both the technical oversold conditions and the fundamental dependence on Bitcoin.
Tehnically saying, NASDAQ:MSTR immediate support could be seen in 145-180 range.
--
Best wishes,
@PandorraResearch Team

Exited 75% of my short trade - relief rally incoming?Before you ask me if I am crazy for closing my short and expecting a bounce, you should know I caught the exact top in MSTR at $560; when people were falling over themselves to buy this ponzi (see linked trade idea). The bulls laughed at that trade when I took it, but it's been one of the best shorts yet.
Now that we are down 66% I have closed 75% of my short position and I have tightened up my stop loss as I expect there to be a relief rally soon.
Could there be a long trade to hadd here? Possibly. I would wait for a change in market structure first. A reclaim of $200 and this could catch a bid. BTC just tanked below 90k, it needs to stabilise first. And this could be good to go with a defined stop loss.
Not financial advice, do what's best for you!

MSTR: WHAT'S NEXTHi guys, these levels are very important right now.
I'm not saying we have bottomed but if a bounce is coming, maybe we're close.
Let's see.

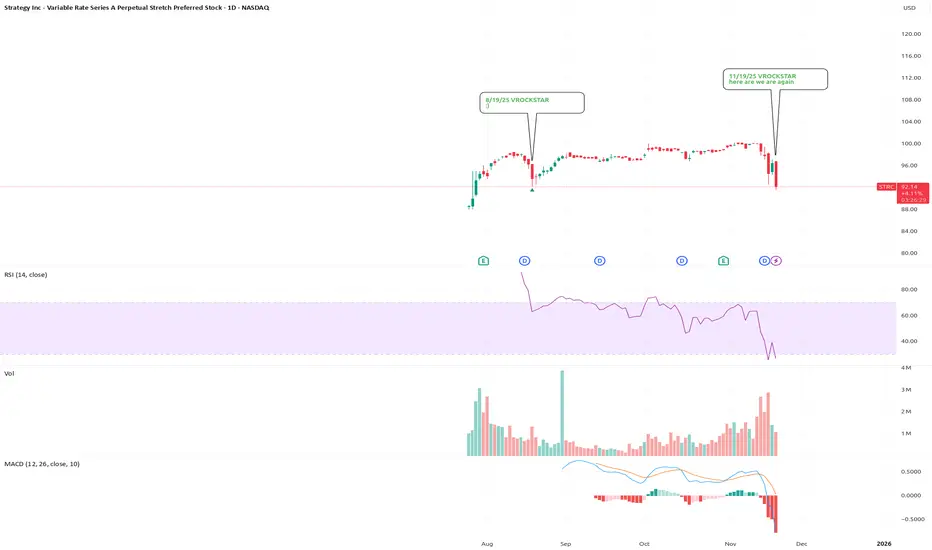
11/19/25 - $strc - here are we are again11/19/25 :: VROCKSTAR :: NASDAQ:STRC
here are we are again
- not really much to say here
- just pointing it out and biting for the trade
- incredible how little brainwork must be going on in these mkts
- just show up and do a bit more than scroll X
- use your brain: the new "alpha"
V
$MSTR monthly -- Long TermI don't own NASDAQ:MSTR shares and I do not plan to trade this name. I chart NASDAQ:MSTR to gauge CRYPTOCAP:BTC , which I do long.
I'm counting NASDAQ:MSTR as in a Primary Wave correction.
Wave ABC correction looks like a flat. AB = CD projects to $146. Wave should not overlap Wave so this count is invalidated if NASDAQ:MSTR drops below $131.50.
Price is approaching CD = 88.6% AB at $181. If BTC turns around, I believe NASDAQ:MSTR will turn around as well.
ABC correction often enters the region of Wave 4 of one lesser degree, in this case, the price range from the top of Wave III ($200) to the bottom of Wave IV ($101). An ABC correction can go lower than Wave IV but in this case, since it's Wave , it needs to stay above Wave , which is $131.50.
If CRYPTOCAP:BTC goes down to $78K area, I'm guessing it'll correspond to NASDAQ:MSTR going down to $145.
Bulls seem to be defending $89K on BTC. I'm leaning towards $89K being the bottom for $BTC.
I'll wait and see as I'm not selling my Bitcoin below $90K.

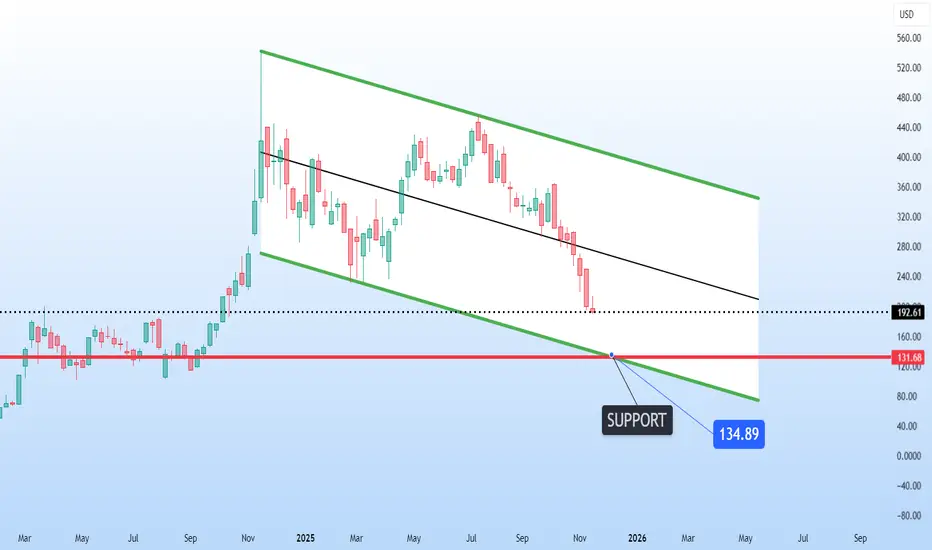
Strategy is sliding deeper inside its descending chanStrategy NASDAQ:MSTR is sliding deeper inside its descending channel, drifting toward a heavyweight support zone near 134–135. Price isn’t touching the channel bottom yet, but the structure is clearly guiding it toward that confluence level where major reactions tend to happen.
This support has history. It’s been a battleground before, and it could become the line where momentum flips once again. If buyers step in as price approaches that zone, it could set the stage for a powerful reversal.

$MSTR - Some Temporary Bottom PossibleNot a bad place to pick up some MSTR if you've been looking to purchase shares. Overall, it remains a high-volatility, high-convexity speculative play tied directly to Bitcoin’s trajectory.
Disclaimer:
I do not provide personal investment advice and I am not a qualified licensed investment advisor. I am an amateur investor.
All information found here, including any ideas, opinions, views, predictions, forecasts, commentaries, suggestions, or stock picks, expressed or implied herein, are for informational, entertainment or educational purposes only and should not be construed as personal investment advice. While the information provided is believed to be accurate, it may include errors or inaccuracies. I will not and cannot be held liable for any actions you take as a result of anything you read here.
Conduct your own due diligence, or consult a licensed financial advisor or broker before making any and all investment decisions. Any investments, trades, speculations, or decisions made on the basis of any information found on here, expressed or implied herein, are committed at your own risk, financial or otherwise.
Feel free to give us a follow and shoot us a like for more analysis updates
Inflation & CPI Trends Across Major Economies1. What Inflation and CPI Represent
Inflation represents the rate at which the general level of prices increases over time. It shows how much the purchasing power of money declines—meaning the same amount of money buys fewer goods and services. The Consumer Price Index (CPI) is one of the most widely used indicators to measure inflation. CPI tracks the price changes of a "basket" of essential goods and services such as food, housing, healthcare, education, transportation, energy, and other everyday items.
Most central banks aim to keep inflation around 2%, believing this level balances economic growth and price stability. Too little inflation risks deflation, while too much inflation destroys purchasing power and can destabilize an economy.
2. United States – Inflation Led by Services and Wages
The U.S. has experienced significant inflationary fluctuations in recent years. After rising sharply due to pandemic-related supply disruptions, labor shortages, and aggressive fiscal stimulus, inflation began to cool. However, the U.S. economy also faced persistent services inflation, driven by rising wages, rent growth, and strong consumer spending.
The Federal Reserve uses the CPI and its preferred measure, the PCE index, to assess inflation pressure. To control inflation, the Fed raised interest rates aggressively. Cooling inflation in the U.S. is heavily influenced by:
Stabilization of supply chains
Declines in energy prices
Slower wage growth
Softening consumer demand
Still, services and housing costs often remain elevated, making full normalization slower. The U.S. inflation trend has major global implications because of the dollar’s role in global trade and finance.
3. Eurozone – Energy Prices and Weak Growth Dynamics
Inflation in the Eurozone has been heavily affected by energy price shocks, particularly due to geopolitical tensions and disruption of natural gas supply. When energy prices surged, CPI reached decades-high levels. As energy prices normalized, inflation cooled significantly.
However, inflation dynamics in Europe differ from the U.S. because of:
Weak GDP growth
Higher dependence on imported energy
Slower wage gains
Fragmented labor markets across member countries
While headline inflation eased, core inflation—which excludes volatile items like food and energy—sometimes remained elevated. The European Central Bank (ECB) aims for a 2% target, but must balance inflation control with the region’s fragile economic growth, making policy decisions more challenging.
4. United Kingdom – Stubbornly High Inflation Pressures
The UK experienced one of the highest inflation rates among developed economies due to a combination of factors:
Brexit-induced supply chain disruptions
Declines in labor supply
High food and energy prices
Strong services inflation
The Bank of England faced a difficult environment: inflation stayed high even as economic growth weakened. Food inflation and rising rents were particularly sticky. Although inflation eventually began easing, services inflation and wage pressures remained key challenges. The UK’s unique mix of structural and cyclical inflation forces continues to make inflation management more difficult compared with the U.S. or Eurozone.
5. Japan – Moving From Deflation to Inflation
Japan historically struggled with deflationary pressures for decades. However, global supply chain disruptions, higher import prices, and a weaker yen pushed Japan’s inflation upward more recently. Japanese inflation trends differ from the West:
Price rises are often driven by cost-push rather than demand-pull factors
Wage growth tends to be modest
Consumer behavior is highly price-sensitive
Firms are reluctant to raise prices
The Bank of Japan maintained ultra-loose monetary policy longer than other central banks due to its long deflation history. Inflation rising closer to the BOJ’s target was seen as a structural shift, but sustainability remains uncertain. Japan’s inflation is typically lower and more fragile than Western economies.
6. China – Low Inflation and Risk of Deflation
Unlike the West, China’s inflation trends have been very subdued. Several factors contribute to China’s low CPI:
Weak domestic demand
Property market slowdown
Falling producer prices
Slow wages growth
Consumers increasing savings rather than spending
At times, China even faces deflationary pressures, especially in the manufacturing sector. China’s CPI is heavily influenced by food prices, particularly pork, which can cause short-term volatility but not persistent inflation. The People’s Bank of China typically uses supportive monetary policy, contrasting sharply with the tightening cycles in Western countries.
China’s low inflation is a sign of economic softness rather than stability, impacting global trade demand and commodity markets.
7. India – Balancing Growth and Inflation
India's inflation trends often revolve around food, fuel, and commodity prices, which make CPI more volatile compared with advanced economies. Seasonal factors, monsoon quality, and global oil prices heavily influence inflation in India. Food inflation—especially vegetables, cereals, and pulses—plays a significant role.
The Reserve Bank of India targets a 4% inflation midpoint. Despite fluctuations, India often manages inflation reasonably due to:
Strong supply-side interventions
Government food subsidies
A diversified economy
A growing services sector
However, persistent food shocks and high global oil prices can challenge India’s inflation stability.
8. Emerging Markets – More Volatility, Higher CPI Pressures
Emerging markets such as Brazil, Turkey, South Africa, and Indonesia often face higher and more volatile inflation due to:
Exchange rate fluctuations
High dependence on imported fuel and food
Political instability
Limited monetary policy credibility
Lower household income buffers
Turkey has experienced hyperinflation-like conditions at times due to unorthodox monetary policy, while Brazil and others use very high interest rates to stabilize inflation.
Inflation management in emerging markets is fundamentally more complex, with structural challenges and external shocks playing a larger role.
9. Global Trends – What Unites and What Differentiates
Several global inflation themes have emerged:
Common Factors Across Economies
Supply chain disruptions
Energy and commodity price volatility
Labor market shifts
Climate-related food supply issues
Geopolitical tensions
Key Differences
Advanced economies face wage-driven services inflation.
China and Japan face weak demand and deflation risks.
Emerging markets face currency-driven inflation shocks.
Central banks globally aim for price stability but must balance inflation control with economic growth. Fiscal policies, demographics, globalization trends, and technological innovation also shape long-term inflation trajectories.
Conclusion
Inflation and CPI trends across major economies are shaped by a mix of global and domestic forces. While the U.S. and Europe focus on cooling services inflation, Japan and China deal with the opposite challenge: ensuring demand is strong enough to prevent deflation. Emerging markets juggle inflation volatility due to external shocks. Understanding these regional differences is essential for investors, businesses, and policymakers to navigate an interconnected global economic landscape.

Full Reset before Full SendWhy March 2025 Could See New Highs
What's Happening Right Now?
Everyone is freaking out right now, but this is actually creating one of the best buying opportunities we've seen. Bitcoin is trading around $95,600 after dropping about 24% from its peak of $126,000 in October.
The Fear & Greed Index is at 10 (Extreme Fear) – and you know what they say? Be greedy when others are fearful. But, also, be patient and set limits.
The thing is, most people don't understand the economics behind Bitcoin or how liquidity actually works in crypto markets. We're playing a completely different game than stocks here.
The Real Cost to Mine Bitcoin (And Why It Matters)
Here's where it gets interesting. The big mining operations are producing Bitcoin for around $26,000-$28,000 per coin, while less efficient miners saw costs spike to $114,842 in October 2025... That's a massive range, and it tells you everything about where the floor is.
After the April 2024 halving, it now takes 854,400 kilowatt-hours to mine just one Bitcoin – that's about 81 years of electricity for an average home, just for one coin. That's a fun fact.
No smart miner is going to sell at a loss when they're paying that much for electricity and equipment (GPUs, etc). They'll just hold and wait. This creates natural supply constraints.
The Liquidity Trap
Right now, the market is in what I call a liquidity trap. As Bitcoin crashed from $126K down to where we are now, all the leveraged traders got wiped out. We saw $870 million in Bitcoin ETF outflows in a single day – that's both panic selling and intelligent, planned shorting, not fundamental weakness.
Here's what most people are missing: if Bitcoin drops to around $75K, it's going to unlock massive amounts of liquidity – I'm talking hundreds of millions, possibly billions of dollars that's currently locked up in long positions (Futures).
When those long get liquidated, the shorts will likely reverse their positions, that money floods back into the market and creates a supply shock. Basic economics: limited supply + sudden demand increase = price explosion.
Price Targets & When to Buy
I think we'll see $89K very soon – possibly this week between Monday and Wednesday (November 17-19, 2025). But here's my recommended strategy instead of trying to catch the exact bottom:
First Buy: $89K
Put in about 30% of what you're planning to invest. This is still a good entry even though it's not the absolute bottom.
Second Buy: $80K
Another 35% here. This is where things get really interesting from a risk/reward perspective.
Third Buy: $75K
The final 35%. This is the sweet spot where all that trapped liquidity gets released. Remember, demand increases as the price drops, and miners won't sell below cost. That's your supply shock waiting to happen.
What About MicroStrategy?
MSTR has crashed about 40% and is now trading at only 1.06 times its Bitcoin holdings, down from 2.7 times. The stock is around $200-$237 now, way down from its November 2024 high of $543.
My prediction: MSTR will probably hit the $140-$150 range, maybe even drop to $100-$120 (which is where it found strong support from March to September 2024). If we do see those lower prices, I'm going all-in on
MSTX
shares, not
MSTR
– the 2x leverage structure is better.
The Macro Picture
Fed rate cut expectations dropped from 90% to about 40%, which is why everything's selling off. But this is temporary sentiment, not permanent damage. The infrastructure is still being built, institutions are still coming in, and the fundamentals haven't changed.
Bottom Line
Be patient. Wait for the dips. Bitcoin will likely hit $89K this week, and from there we could see further drops to $80K and $75K. Each level is a buying opportunity. By March 2025, I expect we'll be making new all-time highs.
The key is understanding that crypto operates on different rules than stocks. Liquidity and supply dynamics matter more than anything else right now.
Good luck,
Terrapins

MSTR – Approaching Major Support as Downtrend ContinuesMicroStrategy remains in a clear higher-timeframe downtrend, and if Bitcoin continues to weaken, NASDAQ:MSTR could slide further toward the next major support level — now sitting roughly 63% below its all-time high. This zone may act as a potential reversal area, especially if market sentiment stabilizes.
Trade Setup:
• Entry Zone: $170 – $180
• Take Profit Targets:
🥇 $280
🥈 $360
• Stop Loss: $122

Global Commodity Impact1. Commodities as the Foundation of Global Economic Activity
Commodities are basic raw materials used to produce goods and services. The global economy depends on stable commodity supply because:
Energy commodities (oil, gas, coal) power industries and transportation.
Agricultural commodities feed the world’s population.
Industrial metals (copper, aluminum, nickel) build infrastructure, technology, and machinery.
Precious metals (gold, silver) act as safe-haven assets.
When commodity markets fluctuate, it creates ripple effects across multiple sectors.
2. Impact on Global Inflation and Cost of Living
One of the biggest impacts of commodities is their influence on global inflation.
Energy-Driven Inflation
Oil and natural gas are input costs for almost every industry—transport, manufacturing, electricity, fertilizers, and logistics.
When oil prices rise sharply, transportation and manufacturing costs increase.
This leads to cost-push inflation, causing higher prices for goods and services worldwide.
Countries heavily dependent on imported oil (like India, Japan, and many EU nations) are especially vulnerable.
Food Inflation
Agricultural commodities like wheat, rice, corn, soybeans, and sugar directly affect consumer food prices.
Extreme weather, wars, export bans, or supply shortages can spike global food inflation.
Poorer nations are hit hardest because food makes up a large portion of household expenditure.
3. Impact on Global Trade and Economic Growth
Commodity-exporting countries—such as Saudi Arabia (oil), Australia (iron ore), Brazil (soybeans), and Chile (copper)—depend on global commodity cycles.
Commodity Booms
When prices rise:
Export revenues increase
Budget deficits shrink
Currency strengthens
GDP growth accelerates
For example, high oil prices boost the economies of Gulf countries.
Commodity Crashes
When prices fall:
Export earnings drop
Currencies weaken
Government spending contracts
Unemployment rises
Many African and Latin American countries suffer during commodity downturns.
Thus, commodities determine economic stability, especially in developing nations.
4. Geopolitical Power and Resource Control
Commodities are tools of geopolitical influence.
Energy as a Strategic Weapon
Countries with abundant energy resources can leverage them for political power.
Russia uses oil and gas exports to influence Europe.
OPEC+ uses output decisions to control global oil supply.
The U.S. uses its shale oil production to maintain energy dominance.
Strategic Metals
Critical minerals like lithium, cobalt, nickel, and rare earths are essential for:
EV batteries
Semiconductors
Renewable energy equipment
China controls a large share of global rare earth and battery mineral processing, giving it strategic leverage over technology supply chains.
5. Impact on Currency Markets
Currencies of commodity-exporting nations move in line with commodity prices.
Examples:
Canadian Dollar (CAD) moves with oil.
Australian Dollar (AUD) moves with iron ore and coal.
Russian Ruble (RUB) strongly correlates with oil and gas prices.
Brazilian Real (BRL) follows soybean and iron ore trends.
When commodities rise, these currencies strengthen; when commodities fall, they weaken.
6. Impact on Stock Markets and Sector Performance
Commodities influence the performance of entire stock market sectors.
Energy Sector
Oil rising benefits:
Oil & gas producers
LNG exporters
Oilfield service companies
But it hurts:
Airlines
Logistics companies
Chemical manufacturers
Metals and Mining Sector
Higher metal prices boost:
Mining companies
Steel and aluminum producers
Infrastructure-related sectors
Agriculture Sector
Higher food commodity prices benefit:
Fertilizer manufacturers
Agricultural machinery companies
Seeds and agri-tech firms
Thus, commodities directly shape corporate earnings.
7. Impact on Global Supply Chains
Modern supply chains rely on stable commodity inputs.
Supply Chain Disruptions Occur Due To:
Political conflicts (Russia-Ukraine war affecting oil, gas, and wheat)
Export bans (India’s wheat or rice bans impacting global food supply)
Natural disasters (floods impacting sugarcane or wheat crops)
Environmental restrictions (coal or mining regulations)
These disruptions lead to shortages, delivery delays, and price spikes in global markets.
8. Impact on Developing Economies and Poverty Levels
Poor and developing nations are disproportionately affected:
High fuel prices increase transportation and electricity costs.
Food inflation directly harms low-income households.
Commodity import bills worsen trade deficits.
For example, African countries struggle when fertilizer and wheat prices rise, pushing millions into poverty.
9. Impact on Industry Profitability
Every industry depends on commodities either directly or indirectly.
Industries Hurt by Rising Commodity Prices
Airlines (fuel cost)
Cement & steel manufacturers (coal and iron ore)
Textile & chemical firms (crude oil derivatives)
FMCG companies (palm oil, sugar, wheat)
Industries Benefited
Oil & gas companies
Mining companies
Agricultural producers
Renewable energy sectors (long-term benefit from high fossil fuel prices)
Commodity fluctuations thus shape global business cycles.
10. Impact on Investors and Financial Markets
Commodities are used as:
Hedging instruments against inflation
Safe-haven assets (gold)
Speculative opportunities (oil futures, metal contracts)
Institutional investors often shift capital to commodities during periods of economic uncertainty. This can drive prices higher and create volatility.
11. Environmental and Climate Impact
Climate change increasingly affects agricultural and energy commodities:
Droughts reduce crop yields
Floods damage plantations
Heatwaves reduce livestock productivity
Storms disrupt energy infrastructure
At the same time, global shifts toward renewable energy are changing the demand for fossil fuels and increasing demand for metals like lithium, copper, and nickel used in clean technologies.
12. Long-Term Global Commodity Trends
Energy Transition
A shift from fossil fuels to renewable energy is underway.
Oil demand may peak in coming decades.
Metals required for EVs and batteries will see massive demand growth.
Population Growth
More people means higher demand for:
Food commodities
Water
Energy
Housing materials
Technological Advancement
Automation, AI, and agri-tech may improve efficiency and reduce commodity price volatility.
Conclusion
The global commodity impact is vast, multidimensional, and deeply interconnected with economics, geopolitics, trade, financial markets, climate, and national policies. Commodity price movements can spark inflation, shift geopolitical power, disrupt supply chains, enrich exporting nations, and destabilize vulnerable economies. In a world facing climate change, technological shifts, and geopolitical tensions, commodity markets will continue to shape the global economic landscape.

Final Leg of Epic Run - Blow off top reaching climaxMicrostrategy has exceeded all expectations, smashing past previous all time highs along with Bitcoin. As Bitcoin approaches 100k, now is a good time for bears to consider where they can short Microstrategy in the event of a pullback.
I think this is setting up an opportunity for an epic short opportunity, not one that I will be immediately jumping into as I don't advocate shorting all time highs. However, if we reach my Fib extensions and if there is bearish divergences then this could be an epic drop.
It looks like this is the final 5th wave of a larger 5th wave Supercycle, the blow off top is almost complete. I'm waiting for a change in market structure. The price range of $530 to $650 is where I see the drop starting, I will wait patiently for the short trade. I will also be paying close attention to the Bitcoin price action.
Not financial advice, do what's best for you.

MSTR Short Closed: Michael Burry vibesI started my NASDAQ:MSTR short last November during the retail yeet. I really took a dislike to Saylor telling people to mortgage all they could to buy Bitcoin and then later to buy stock in his company. The history of finance is littered with con men saying and doing such things. History doesn't repeat but it rhymes.
Now the stock sits on a key Support; the March 2024 high and the prime Volume Profile level of the run up. Its time to unwind the position in profit and see what happens next.
MSTR hitting a Support coincides with CRYPTO:BTCUSD also hitting a major Volume Profile Support. The Weekly Ichimoku chart remains bullish. A recovery pullback up could happen from here.
Over the last year I've had to go through the cycle of being "right" and being "wrong" all the while being public in my position among Bitcoin Maxi friends. They enjoyed poking fun at me the whole way. Their arrogance and jabs did not change my mind, rather they gave me some confidence that I was properly contrarian. Hubris never pays off in investing. Every great trade I have made has begun (and lasted) in deep uncertainty. That is what it means to take risk.
I still believe that the narrative of MSTR has yet to completely dissolve among the faithful but I have a habit of always taking profit "too early."
Trade wisely. Stay convicted.
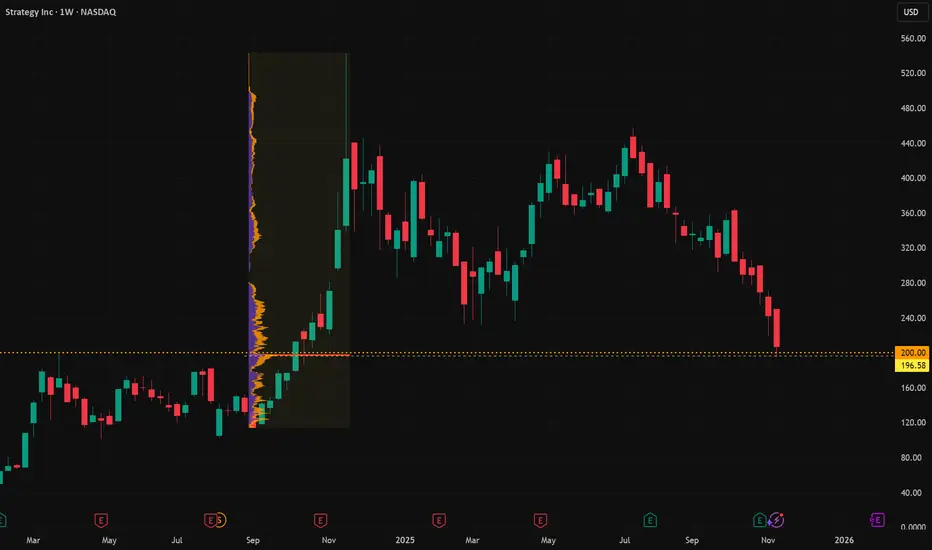
Strategy: Downward Pressure Intensifies Strategy has continued to develop downward pressure as anticipated since our last update, bringing it closer to the targeted low of the turquoise wave 2. Our alternative—and now grayed-out—Target Zone has been breached to the downside, allowing us to remove the alternative scenario of a premature breakout to the upside. Investors who speculated on this alternative and entered within the alternative Target Zone with a stop 1% below the lower edge have likely been stopped out by now. For now, we are still allowing some room for turquoise wave 2 to move lower; however, it should find its bottom above the support at $102.40 to set the stage for wave 3 to advance further above the resistance at $674.18.
