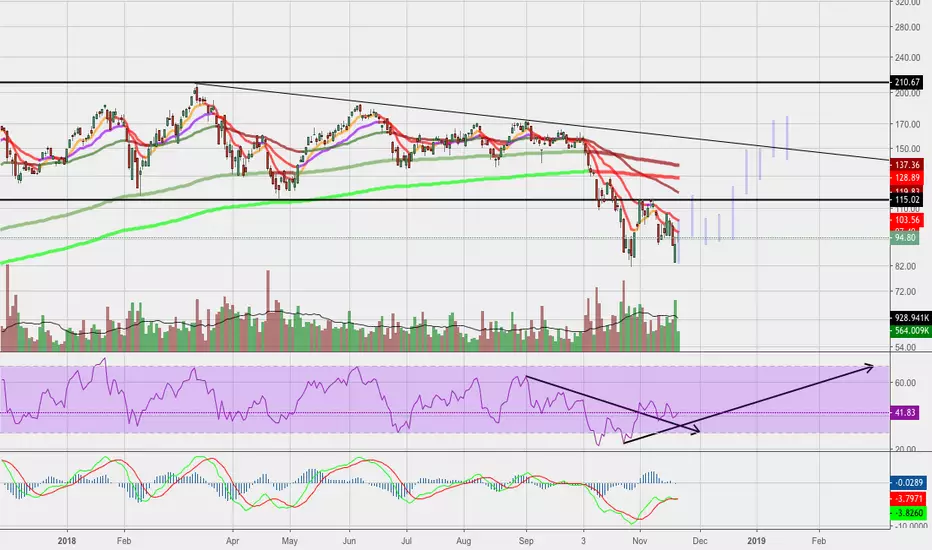
Price projection: Bear flag, target $42, low volumesBasically i would never go long now, would you?
Volatility, sell off, a bear flag, i don;t care if it goes 20-30% up, it is still a bear market.
Wait for price to drop to like 42 or something like that before accumilating..
Look for volumes, we need 2012,2013 to start selling their positions. That will be a clue when to get in.
Be mindful of fractal events, Looks like Jan 14 might the signal we need.
Good luck everyone ;)
**LEGENDS**
BLUE = Bear/Resistance
Yellow = Bull/ Support
~Explore the chart for possible scenarios of price actions - use zoom and scroll for better view.~
/*This information is not a recommendation to buy or sell. It is to be used for educational purposes only.*/
If you want your coin to be analyzed, JUST ask.
If you got a question, ASK away!
And please keep those Stop losses in place!
Fractal dates are moments of interest, where price and time collide to create oscillation - vertical lines!
Thank you,
Ajion
Trade ideas

SOXL start buying, save some money for 80s if they comeSome levels of interest. Caught this falling out of the diamond pattern.

Inverse Head and shoulders formation for semicondutors ETFBackground: Bullish trend finished on resistance 171 price level. Tripled top on sept 27, 29, and oct 04 on RSI on 70, then channeling wide and volatile through 140-160 price levels.
First: SHOULDER formation oct 02 starting RSI 65, 160-114-128 price oscilation.
Second: HEAD formation oct 17 to nov 02 starting RSI 62, 128-84- 114 price oscilation.
Third: waiting on heavy resistance a second SHOULDER formation. Best escenario: 122-112-128 on 18 days; Mid Escenario: 116-10-128 on 22 days; Worst Escenario: 114-88-128 on 26 days.
Notes:
- wait consolidation correction of this bull trend to complete de H&S patterb formation
- we need to see another bottom for the escenarions on November 12-15
- critical eventes: NVDA earnins 11-15-2018 (This will mark any movement)

Buy 110 support maybe and/ or Buy at 85$ rangeIf $110 doesnt hold then "the bubble of everything has popped" And buy at 84$


Short then long, or average in a position.Semi conductors are not going anywhere, they just completed a huge run. Fell out of the wedge and I dont see this going below 80$ ever but I see it testing a couple spots below and breaking north .


SOXL 50/50 Well A multi year flag? A big move is coming, My gut has been telling me to Buy TVIX or UVXY and DRV as my gut is bearish, no doubt SEMI's are not going anywhere, but the overall Bull market run tells me we are due for a shocker sometime soon, DRV soon looks to be profitable.

SOXL Semiconductor 3 X Bull ETF Potential Move Up to 200SOXL, Direction's Triple Bull Semiconductor ETF,
has formed what appears to be a powerful V bottom pattern formation
during the month of August with the chart pattern clearly showing
a bullish breakout above 170.50, from the recent low below 139,
would project the ETF back towards it's all time high at the 200 price area.
Semiconductor stocks are a market leading industry group have lead the recent sharp rally,
and a bullish breakout would certainly be a bullish continuation signal for the market.
I would use this ETF as a Bullish Hedge, against further advances in the market this fall.
STOP is at 138.00, 30 points away, so size position accordingly.
THE_UNWIND


#soxl bullish longterm ...long term view is the better way to go with this … don't trade it ...Buy it

Heading toward 106 by 08/15 and 77 by 2019Unless resistance line is broken, i say we are in the bear market.
Just look at the volumes at the prices ranges.
Big volumes at 95. That means if break bellow, panic selling will commence, and this will drag us down below $80.
Also, most bought at $20 and $40 so unless they are all stupid, and i don;t think so. They will be taking profits. To enter at a lower position.
I think we have to have ABC correction here, if we are aiming to go as high as $400.
~Explore the chart for possible scenarios of price actions - use zoom and scroll for better view.~
/*This information is not a recommendation to buy or sell. It is to be used for educational purposes only.*/
If you want your coin to be analysed, please PM me.
Thank you,
Ajion

Short now for 30% to 70% gain? We are heading to $80-70 rangeFrom it seems, we are about to enter a correction phase.
We still need a confirmation, but after A and 1, all i am seeing a volatility and not a uptrend.
We could go higher, but it seems short is the right call here.
/*This information is not a recommendation to buy or sell. It is to be used for educational purposes only.*/
If you want your coin to be analysed, please PM me.
Thank you,
Ajion

Reverse Triangle, heading into wave 5, into $400 territory!Looks like i was wrong previously, we were not in wave 5, we were still in wave 3-4, and this is a reverse Symmetrical triangle!
Well, it looks like we should be heading into $400 territory.
So i can market is going to go bust sometime early 2019.
/*This information is not a recommendation to buy or sell. It is to be used for educational purposes only.*/
If you want your coin to be analysed, please PM me.
Thank you,
Ajion

#SOXL beast MOde ETF lolI mean it could go back and test previous 52 weeks high , chart speak for itself

#SOXL this etf is FireThe chart speak for itself ...trade war drama cause the fall , that correction was well overdue now its over , bullish momentum back on

SOXL channel breaking + overbought zoneWe are spectating a channel breaking in SOXL resulting a strong price bounce on 120-122 support. 20 point up we can see how SOXL is making consistently new high spots despite several bull traps in the channel. Spectating uptrend continues to a new resistance near 150-160. Watch out for price drop back to 132. Stop loss at 132.5 so you can manage the risk for less of 10% of position value. We can notice that MACD is out of normal zone on 76 level, this is a clear bull signal leading to a overbought zone. Expectate upcoming correction in the next daily candles.I do not recommend to invest, just only commenting the chart. Before you do so please take several aditional information rather this chart comment.


SOXL: Direxion Semiconductor Bull 3X Leverage ETF Overview This ETF is one of my favourites, with a very consistent return
Year to Date* 26.14%
1 Year 171.57%
3 Years 85.12%
5 Years 85.46%
10 Years --
Since Inception 44.61%
Has shown a positive return every quarter since Q315
Reuters Lipper Fund Research:
Total Return: 5
Consistent Return 5
Tax Expense 4
BETA= 4.16
Holdings: (Top ten. Yes, there is AMD)
Dreyfus Government Cash Management (Institutional)
Texas Instruments Inc ORD TXN
Intel Corp ORD INTC
Qualcomm Inc ORD QCOM
NVIDIA Corp ORD NVDA
Broadcom Ltd ORD AVGO
Analog Devices Inc ORD ADI
Microchip Technology Inc ORD MCHP
Taiwan Semiconductor Manufacturing Co Ltd DR TSM
Micron Technology Inc ORD MU
Asset Allocation
Equities 65.44%
Cash 10.61%
Fixed Income 12.15%
Other 11.80%

SOXL - Going long 119.00 for a tradeLooks to be at a solid point that it should bounce. Looking for 140. Never got oversold on RSI
