Recessions and the Flight to SafteyEven though the great recession was ongoing for almost a year prior to being dated by the NBER, it was the announcement itself that started the massive migration from stocks to bonds. The purple square encapsulates this time range. It is best to enter this position before an announcement, which some market participants did.
At the current growth rate, we will be in a recession anywhere around October - January, after mass layoffs result in unemployment across the economy. The NBER has responded more quickly in dating the more recent COVID-19 2020 recession, which lasted only a few months and announced around four months after it started.
Trade ideas

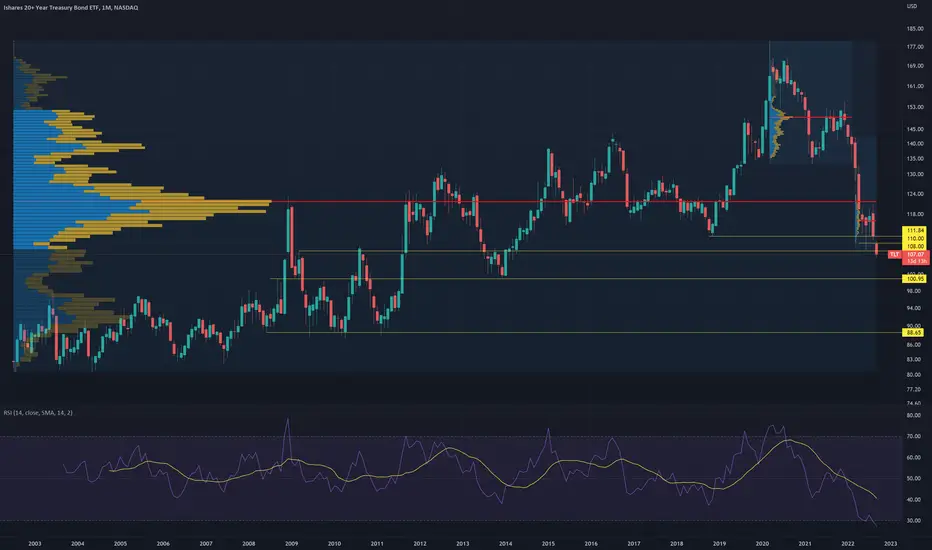
relief rally at 11212-116 area where there is major support dating back to 2018.
short term buy
midterm neutral
long term sell

Mixed picture on TLTTLT the long term Treasury ETF had been showing itself to be fairly resilient in recent weeks. However it is now trading below a key level of 108 which I'm sure some investors would regard as a sell signal. Could be more downside to come but I would expect strong support at the 101 level of the 2013 low.
How I Learned to Stop Worrying and Long the Treasury MarketHave you ever been told that stocks only go up? How about not trying to time the market? If you have, you might just be the exit liquidity the credit market needs. In this chart I will help you avoid losing money in the next two quarters by rolling your portfolio into cash and the treasury market.
If you have followed the last few charts, you are already sitting in a cash portfolio as we head into a disinflationary period. That's right, inflation has already peaked even though the credit market is pricing in a potential 100 basis point hike this month. What isn't being priced in is the recession coming around q4 or q1. This is an opportunity for you to roll some cash into the treasury market and make some gains on top of not losing money.
You may have heard something like "the treasury market is broken bro". This is from people that don't understand the dynamics of the treasury market. The treasury instruments do not perform well when interests rates are going up, but the up and coming recession will sharply slice inflation in a very short period of time. This will result in a fed pause. This isn't priced in yet because interest expectations are too high to account for a rapid recessionary disinflation.
Look at how quickly TLT started to make gains after the fed stimulated the economy during the pandemic. This is the ideal time to start a DCA into the treasury market because the credit market is still struggling to come to terms with the fact that a soft landing isn't going to happen. When they do, the treasuries will pump in anticipation of a fed pause or even a pivot. I don't think a pivot will happen without a pause, but the credit market, being the pack of wild dogs they are, will conflate the two.
This is a trade that might have a very small bit of downside to it at first because of a potential basis point increase, so if you can't handle that, a DCA over the next month or two is best.

Crash Incoming 11?Another simple and yet concern chart, at least for me. An almost perfect inverse correlation, right? There is a (high?) probability that the blue line (TLT/SPX) is about to go up towards the yellow line (S&P500)? We will see...

$TLT is in over sold territory $TLT is in over sold territory. And nearing a long term demand zone. Going into the crescendo of a bear market would it be a good idea to go Long $TLT and short $SPY ? However timing is everything.

TLT nearing bottom Still in line with my previous analysis. I approach this from an Elliot Wave perspective with Fibonacci relationship.
To me this looks like a macro ABC with final leg down reaching extremes. We are likely in a bullish divergence territory on a Weekly Chart.
The chart above is Daily for easier wave count to pin point where C might end. The support box is in gray; this is an area where a price could react with a strong bounce or reversal. As you can see we are already there so support could be found very soon.
Another fib support coming up in the 90-96 range where I feel there is a strong possibility for a bottom (not guaranteed, hunting bottoms is a dangerous game).
If we take a trend line in wave C from ii to iv and measure the trajectory of where v should end, it also points at a region of 90-96. If the market presents this opportunity it has a number of supports coming together all in that particular area. This bottom could mark the top in US10Y and other treasury bonds since they move inverse to TLT. Also the dollar index is hinting at a top and pushing extremes so I expect a reversal or a top in Sep-Oct timeframe. The month of September / October (2022) might come with fire works!
Not a financial advice.
Cheers,

Long Term Bonds Key LevelTLT daily is on key support as long term bond yields soar which is bearish for stocks. You can Also get a case where long term bonds rally and yields fall which is also bearish for stocks if short term yields continue to rise at the same time. This will likely be the case if the Fed pivots. By that point the yield curve has already kicked up at the short end resulting in a heavy landing recession.

Reaction Point Coming Soon...We're approaching obvious fib levels and a reaction line where this downtrend might reverse/bounce soon.

CTS - Treasury 20Y20Y Treasurys. So much debt. So much fear nearby. Good risk profit for me at last.
Give it a like, share. 👍

Dump likely to pauseThe countercyclical correllation when bonds sell off same time with stocks is likely to end, because investors need actial yield.

TLT daily wave count EWTLT on daily chart appears to be in the c wave of the abc retracement after the motive wave completion. Projecting to reach $120+.

TLT previous support level reachedWith hidden daily bullish divergence at this support level we SHOULD see some buying start to happen. If not, the channel will break and it will look like they want to test the lows. This week's closing candle is very important. Under 111 will look ugly on a daily close, under 110 even worse.

$TLT - chart update and investment. This is where I will be parking 401K money for the next 6-12 months. Large $TLT gap to fill at $168. Bonds will outperform as the market declines one last time before the recession. NFA/DOR

TLT - Possible 3 Peaks and Domed House in progressHaving seen price fully retrace to "G", odds favor this being a 3PDH formation.
Its possible we may see a rally should the potential inverted H&S materialize,
but there is no time limit for the target to be reached, so this could
occur at a later date. The targeting from this formation could easily be
combined with other T.A. methodology as supplemental information.

TLT Bond ETF Setup for Reversal to LONG Relatively WeakNASDAQ:TLT
In comparing the ratio of TLT to QQQ, I have found the ratio
or relative strength is at its historical low range.
I conclude, now may be an excellent time to shift
assets into TLT if a trader believes that the bear market rally
for equities is loosing momentum or possibly reversing.
This is not a recommendation as to a trade and just my perspective
from analysis.

TLT Bond ETF Setup for Reversal to LONGNASDAQ:TLT
On the 4H Chart, TLT is sitting on minor support with major support below that.
It is near to the bottom of open Bollinger Bands and is inclined to move through
the basis line closer to the upper band.
Significant resistance is 5 and 15% upside.
I see a swing long trade with the stop loss below the major support and targets
before the major resistances, yielding a very good reward for risk.
Call options are another possibility to consider.

monitoring inverse head and shoulders breakoutalso showing a buy off of c wave. The AD and Stoch Rsi also have bottom

TLT versus JNKTLT is long term low yield government bonds. JNK is corporate high yield high risk bonds. The chart shows that we are near the golden pocket fib retracement level as well as a long term support zone. This could indicate a potential rotation back into government treasuries.

TLT - Head and Shoulders formingJust a pretty straight forward head and shoulders forming. Guess market doesn't like low yields after all? Time frame - probably B-wave rally ahead of next FOMC, then dump before FOMC. I'm trying to trade bear call spreads above 114 using TBT (better use of capital at $26 strike on TBT) and will sell bull put spreads at TLT near 120...probably....on TBT that's a bull put spread somewhere around $22 or $23.
Thoughts?

TLTThe market is trying to have its cake and eat it too....
The market priced in a rate cut for next year which is why long term bonds rallied recently. Meanwhile they pumped stocks because earnings were good. Can't have it both ways, either we're headed for a recession and stocks should go down or we're not and TLT needs to head down.
TLT and the market heading up at the same time really doesn't make sense based on what the Fed is doing. Probably just money flowing out of commodity trading which now appears to be a dead play. I said this a couple of months ago, if they keep pumping oil prices then the Fed will keep raising rates so it's done.
Anyways, chart pattern is similar to the December top, made some money overnight with TLT puts, I figured employment numbers would be good.

TLT chartHere's how I interpret the TLT chart: A shallow upward sloping channel overall long bull trend which was severely disrupted by the Covid crisis where we saw bonds spike to extreme low levels as yields plummeted which was then followed by an extreme reaction the other way to the downside as investors bet against US debt. It looks to me like the current rally may be this TLT ETF getting back to its more 'normal' channel from its extreme low. It is not there yet.

New bullish trend is growing on US DEBTAfter the rate shock comes the big DOWN on rates so bond will grow again, HUGE movement inc
