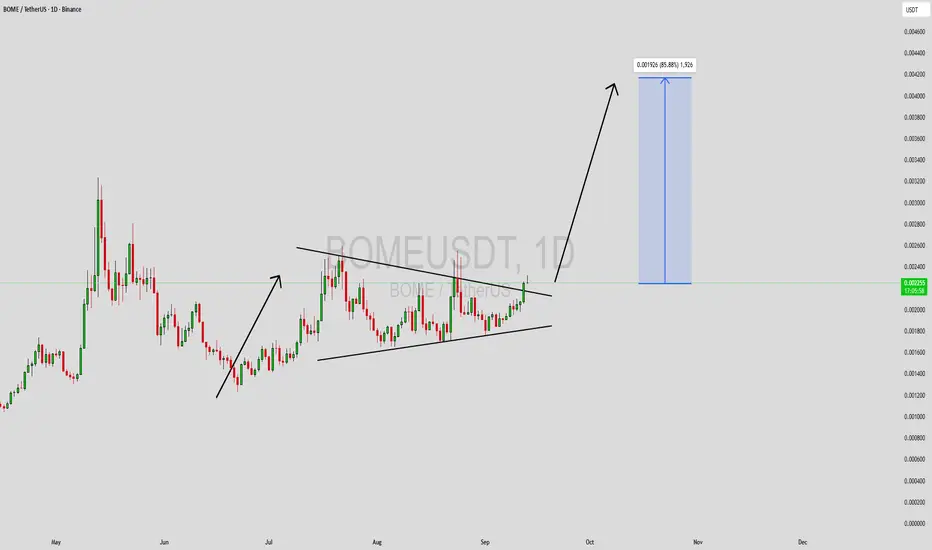
BOME fakeout to the downside and stop loss end time to fly As we can see we had a huge amount of dump here and i like these charts because explode and huge profits sometimes are in these charts and i think BINANCE:BOMEUSDT is now ready for one of those explosion to the upside.
breakout of this 0.0041$ can cause heavy pump and even more gain but for now it is our first target and take profit zone with +250% profit.
DISCLAIMER: ((trade based on your own decision))
<<press like👍 if you enjoy💚
BOMEUSDT.P trade ideas


BOMEUSDT UPDATE#BOME
UPDATE
BOME Technical Setup
Pattern : Bullish Falling Wedge Breakout
Current Price: $0.002246
Target Price: $0.00420
Target % Gain: 91.03%
Technical Analysis: BOME has confirmed a breakout from a bullish falling wedge on the daily chart. Price closed above trendline resistance, supported by steady accumulation and breakout momentum, pointing toward a strong upside potential.
Time Frame: 1D
Risk Management Tip: Always use proper risk management.

BOMEUSDT 1D#BOME has broken above the symmetrical triangle on the daily chart. In case of a successful retest, the targets are:
🎯 $0.002452
🎯 $0.002670
🎯 $0.002948
🎯 $0.003301
🎯 $0.003485
🎯 $0.003750
⚠️ Always remember to use a tight stop-loss and follow proper risk management.

BOMEUSDT Forming Bullish PennantBOMEUSDT is currently forming a bullish pennant pattern, which often signals continuation of upward momentum after a strong rally. This consolidation phase, combined with steady trading volume, reflects investor confidence and positions the pair for a potential breakout to the upside. Market participants are increasingly taking interest, making this setup attractive for both traders and investors.
The bullish pennant structure suggests that BOMEUSDT could gain strength once resistance is cleared, opening the path for a sharp upward move. Technical indicators are aligned with this view, as price action is holding above key support levels while showing signs of accumulation. A breakout confirmation would likely accelerate momentum, attracting more buyers into the market.
With an expected gain projection of 70% to 80%+, this setup offers a favorable risk-to-reward ratio. Traders watching BOMEUSDT will be focused on upcoming candles to confirm bullish continuation. If momentum sustains, the pair could see strong upside performance in the short to medium term.
✅ Show your support by hitting the like button and
✅ Leaving a comment below! (What is You opinion about this Coin)
Your feedback and engagement keep me inspired to share more insightful market analysis with you!
BOOK OF MEME · Leverage vs Spot · Should I Plan or Not?With the log chart we can focus on growth potential, the all-time high, highs and lows, the bigger picture, the chart structure and long-term cycles.
With the linear chart, we can know the truth of a pair. Are we looking at a cycle top or bottom prices?
BOMEUSDT (BOOK OF MEME) is bullish based on current price action and trading volume.
Looking at this linear chart, it is easy to see BOME consolidating sideways after hitting bottom. It is easy to see a major cycle (left), a major crash and then the market going sideways.
If I were to show a log chart, the action after February would be really pronounced and you would see lots of bullish and bearish moves. These are indeed happening but are minimum—small—compared to how the market actually moves. Market noise.
If I were to focus on the short-term, I would have to become Nostradamus in order to be able to predict the next move.
If I focus on the long-term as I usually do, I can easily predict what is going to happen next.
As a group, we cannot beat the market because we are the market; but, there is no need to "beat" the market, we only need to make money and there are many ways to make money; choose what works for you. We choose low risk vs a high potential for reward.
We choose simplicity and a strategy that works. Literally, just buy and hold.
I understand leverage (margin) and I use it of course, but I cannot cry if I incur a major loss. I cannot cry, blame and complain if things go wrong; why? Because before making the first purchase, the first move; before making a decision or any trade, the first thing to consider, adapt and accept, is the fact that all money can be gone in a flash, that's the thing about leverage trades. If things go right, you get to win big but, if things go wrong, you get to lose everything... Not really, if you control your position size your risk is limited.
Ok. Asymmetric risk/reward. Maximum 5% out of the risky trading capital goes on a single trade. It can be 3% or even 2% or 1%.
If you can't make money slow, you won't be able to make it fast. Making money is an art and trading is the same. It is a craft, a profession, a job, a career; call it what you want, but it takes effort, and, since there are so many smart people doing the same, we have to be smart when we decide to participate.
How can I be smart when trading?
Build a plan before taking action.
I love you. I am literally feeling true love right now as I write this, I hope it reaches you.
Thanks a lot for your continued support, it is appreciated.
Namaste.

BOMEUSDT Forming Bullish PennantBOMEUSDT is currently shaping a bullish pennant pattern, which typically indicates a period of consolidation before the next strong upward move. This pattern, combined with rising trading volume, highlights growing momentum and increased interest from market participants. If confirmed, this setup could drive a powerful breakout rally, with expected gains ranging between 70% to 80%+, making it an attractive opportunity for traders seeking high-potential setups.
The price action suggests that BOMEUSDT has been steadily building strength, with buyers maintaining control and supporting higher lows. A breakout above the pennant’s resistance could open the door to rapid upward movement, especially with volume confirming the momentum shift. Such formations are often seen as strong continuation signals, reflecting renewed confidence in the asset’s upside potential.
Investor sentiment around BOMEUSDT is also improving, with heightened interest suggesting strong demand in upcoming sessions. As more traders recognize the bullish technical pattern and increasing participation, the pair could capture even greater traction in the market. This aligns with the overall expectation that BOMEUSDT may deliver significant gains in the short to mid-term if momentum continues.
✅ Show your support by hitting the like button and
✅ Leaving a comment below! (What is You opinion about this Coin)
Your feedback and engagement keep me inspired to share more insightful market analysis with you!

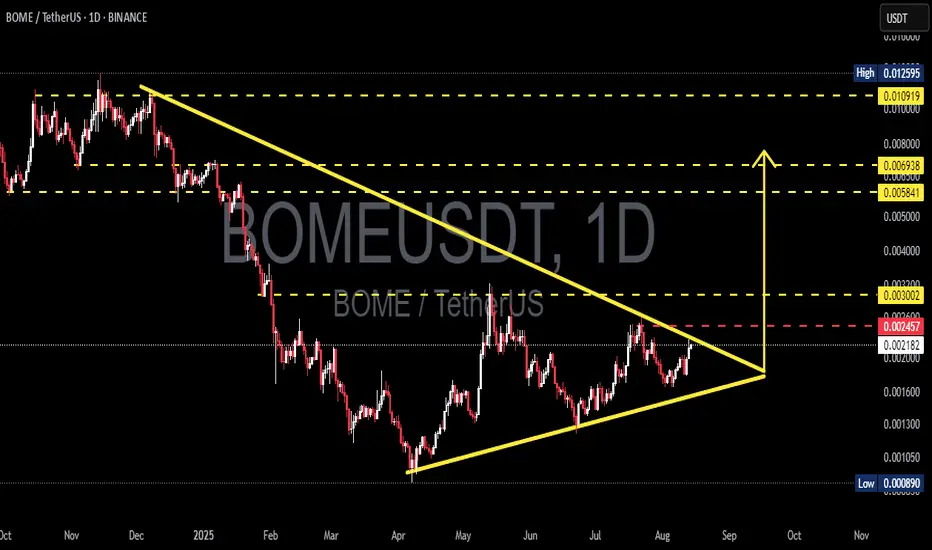
BOME/USDT — Symmetrical Triangle on the Verge of a Explosion?BOME/USDT has spent the past several months moving inside a Symmetrical Triangle pattern, formed by a series of lower highs from the peak around 0.0125 and higher lows from the April 2025 bottom at 0.000890.
This formation signals a major consolidation phase where buying and selling pressure are converging toward a single decision point (apex).
When price action approaches the tip of such a triangle, it often results in a volatility surge — either to the upside (breakout) or downside (breakdown).
Currently, price is testing the critical 0.00245–0.00255 zone, which will act as the gateway to the next major move.
---
Key Levels to Watch
Major Resistance:
0.00245–0.00255 → Upper trendline + horizontal resistance.
0.003002 → Initial breakout target & historical resistance.
0.005841–0.006938 → Strong supply zone from the previous rally.
0.010919 → Psychological target before the peak.
0.012595 → Main chart high.
Key Support:
0.00205–0.00215 → Rising trendline (dynamic support).
0.00170–0.00130 → Minor historical supports.
0.000890 → Yearly low and major support.
---
Pattern Characteristics
The Symmetrical Triangle is a neutral formation typically accompanied by:
Declining volume during consolidation.
Strong volume expansion upon breakout.
Initial move targets often equal the height of the triangle from the breakout point — providing significant upside/downside room.
---
Bullish Scenario
1. Breakout Confirmation: Daily close above 0.00255 with strong volume.
2. First Target: 0.003002.
3. Next Target: Sustained momentum → 0.00584–0.00694.
4. Extended Target: Breaking through the supply zone could drive price to 0.0109–0.0126.
5. Invalidation: Price re-enters the triangle and closes below 0.00220–0.00215.
---
Bearish Scenario
1. Rejection: Failure to break 0.00255 followed by a daily close below 0.00215.
2. Downside Target: 0.00200 → 0.00170–0.00130.
3. Breakdown Risk: A move below the rising trendline could trigger a retest of 0.000890.
4. Invalidation: Price reclaims 0.00245 and holds.
---
Trading Notes
Long consolidations like this often precede sharp moves — patience is key.
Wait for confirmation: Avoid entering prematurely; look for a clear breakout with volume.
Reward/Risk potential is attractive for swing traders in this setup.
#BOME #BOMEUSDT #Crypto #Altcoin #PriceAction #SymmetricalTriangle #Breakout #SupportResistance #ChartPattern #CryptoAnalysis
Bome Because of the high volatility that the coin has, it is still a RISK trade, but I characterize it as SWING, because the market may slow down.
The meme coin you must haveHello friends🙌
Given the decline we had, you can see that the price has exited the descending channel and entered the ascending channel. Now we can buy in steps with capital and risk management.
Follow us for more signals🔥
*Trade safely with us*

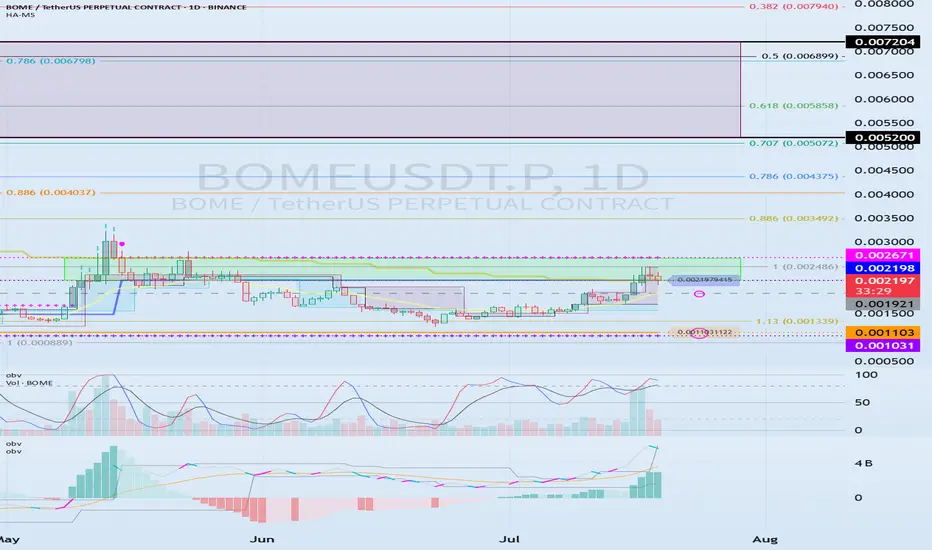
0.002198-0.002671 The key is whether it can break above
Hello, traders.
If you "Follow", you can always get new information quickly.
Have a nice day today.
-------------------------------------
(BOMEUSDT.P 1D chart)
BOME is a BOOK OF MEME, which is a meme coin and belongs to the Solana Ecosystem.
If the price breaks through the 0.002198-0.002671 section upward and maintains, it is expected to rise to around 0.005200-0.007204.
As a condition for this,
- The K of the StochRSI indicator should show an upward trend with K > D below the overbought section.
- The PVT-MACD oscillator indicator should show an upward trend. (If possible, it should be above the 0 point.)
- The OBV indicator of the Low Line ~ High Line channel should show an upward trend. (If possible, it should be above the High Line. It should maintain a state where at least OBV > OBV EMA.)
When the above conditions are met, if the 0.002198-0.002671 section breaks through upward, it is expected to continue the upward trend.
If not and it falls, you should check if it is supported near 0.001921.
This is because I think that the upward trend can continue if it receives support near the 0.001921 point, which is the volume profile section.
Therefore, if it falls below 0.001921, you should stop trading and watch the situation.
You can trade with a SHORT position in futures trading, but since it falls below the volume profile section, you should be aware of the volatility.
Therefore, if you insist on trading, a short and quick response is required.
-
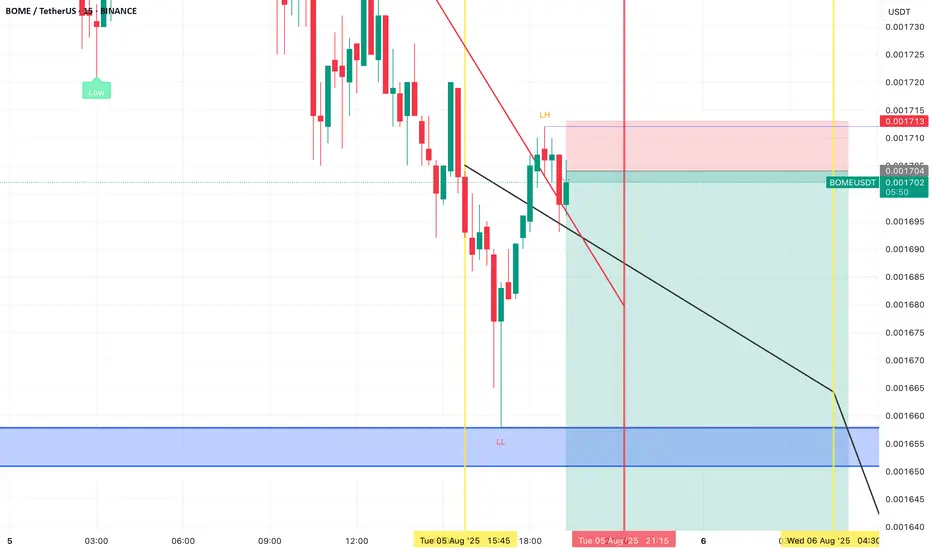
(15m chart)
The trading method is simple.
Buy near DOM(-60) ~ HA-Low, and sell near HA-High ~ DOM(60).
However, if it falls from DOM(-60) ~ HA-Low, it is likely to show a stepwise downtrend, and if it rises from HA-High ~ DOM(60), it is likely to show a stepwise uptrend.
Therefore, you should maximize your profits by taking a split transaction format.
Other indicators can be used as points where you can conduct split transactions depending on the situation.
That is, sell about 25% at the support and resistance points drawn on the 1M, 1W, and 1D charts, and sell about 10% at the support and resistance points on the 15m chart to maximize your profits.
While conducting transactions in this manner, you may wonder if you can actually drag the transaction to around 0.005200-0.007204, but it is possible.
It is good to hold to make a big profit, but since the current price range is in the support and resistance range, I think it is an unstable range to just hold.
-
Thank you for reading to the end. Wishing you a successful trade.
--------------------------------------------------
BOMEUSDT 12H#BOME — Bullish Setup in Play! 📈
#BOME is moving inside a Falling Wedge pattern on the 12H chart — a classic bullish reversal signal.
A breakout above the wedge resistance and the 12H MA100 could ignite strong upside momentum. Potential targets after breakout:
🎯 $0.002091
🎯 $0.002373
🎯 $0.002601
🎯 $0.002829
🎯 $0.003154
⚠️ Always use a tight stop-loss to manage risk and protect your capital.

BOMEUSDT UPDATE
Pattern: Falling Wedge Breakout
Current Price: \$0.001880
Target Price: \$0.003560
Target % Gain: 90.91%
Technical Analysis: BOME has broken out of a falling wedge pattern on the 12H chart. A bullish breakout is confirmed with a close above resistance and continued higher lows.
Time Frame: 12H
Risk Management Tip: Always use proper risk management.

Bomeusdt Buy opporutnityBOMEUSDT continues to trade within a clear descending structure, recently bouncing from a major low and now approaching a critical decision zone.
The price reclaimed the $0.001874 buy zone after a sharp recovery and is currently forming a minor bullish channel. If this structure holds, the next bullish objective lies around the $0.005838 supply zone a key resistance where strong rejection is likely, given previous sell-offs.
Any pullback into the $0.001874 zone could offer a strong re-entry opportunity before the next leg up. Stay alert for price reaction around this confluence area.

Go go BOME!!📢Price action is quite good. now standing on the yellow support line. potential to go to the white line resistance target, supported by divergence and small double bottom. I think this is a good time to take a long position📈.
⚠️Be careful if the price breakdowns the yellow line support because the market will reverse 📉and selling pressure is high.

BOME/USDT BullishMeme Coin Bome bullish, break the trendline, trend is change of character.
Let's see.
BINANCE:BOMEUSDT

BOMEUSDT 1DBOME ~ 1D Analysis
#BOME This trade is very high risk. Buy gradually from here with a short -term target of at least 10%+.

BOME to Boom 500% by end of March?Price action has corrected 85% since mid November, a number of reasons now exist to have long exposure. They include:
1) Price action and RSI resistance breakouts.
2) Regular bullish divergence. Look left.
3) Falling wedge confirmation forecasts circa 550% extension.
Is it possible price action continues correcting? Sure.
Is it probable? No.
Ww

BomeusdtBOME/USDT Breaks Downtrend: A Potential Price Explosion Ahead?
BOME/USDT has successfully broken above its descending trendline on the daily timeframe, signaling a potential shift in market sentiment. Several technical and market-based factors suggest that a strong upward move could be on the horizon:
1. Trendline Breakout Confirmation: The breakout from the long-term downtrend indicates that selling pressure has weakened, and bullish momentum is gaining strength. A daily close above this trendline adds further confirmation.
2. Increased Volume: A surge in trading volume during the breakout phase often suggests strong participation from buyers, reducing the likelihood of a false breakout.
3. Key Moving Averages Turning Bullish: If BOME/USDT is reclaiming key moving averages (such as the 50-day and 200-day EMAs), it could confirm a shift from a bearish to a bullish trend. A golden cross (where the short-term moving average crosses above the long-term moving average) would further reinforce this bullish outlook.
4. RSI and Momentum Indicators: If the Relative Strength Index (RSI) is moving above 50, it signals growing bullish momentum. A breakout above 60 or 70 could indicate an overbought condition, but it may also suggest strong buying pressure in the short term.
5. Fibonacci Retracement & Resistance Levels: If BOME/USDT has broken through key Fibonacci retracement levels (such as the 38.2% or 50% levels), it may indicate a move toward the next resistance zones, potentially leading to a parabolic move.
6. Market Sentiment & Liquidity: If open interest and funding rates are increasing, it suggests that traders are positioning themselves for a larger move. A positive funding rate indicates that long positions are willing to pay a premium, reflecting strong bullish sentiment.
7. Macroeconomic & Sector Trends: If the broader crypto market is experiencing an uptrend, especially in the meme coin sector, it could provide additional tailwinds for BOME/USDT. Bitcoin’s price action also plays a crucial role—if BTC remains bullish, altcoins like BOME could see accelerated gains.
Potential Price Targets:
Immediate resistance levels could be the recent swing highs.
If the breakout sustains, psychological levels (such as 2x or 3x the breakout point) may become achievable.
While the breakout is promising, traders should remain cautious of potential retests of the broken trendline or liquidity hunts before a sustained move higher. Risk management is key in volatile assets like BOME/USDT.

Bomeusdt trading ideaBOMEUSDT has achieved a major breakout from a falling wedge, with price stabilizing above the wedge after a pullback. The accumulation zone presents a key buying opportunity, with the immediate target aligned with the proposed neckline and the final target clearly outlined on the chart. Additionally, the external demand zone provides a robust support level for potential price retracements.

Did we hit the bottom on BOME? Is it time for a rise to 0.0105?Currently, on BOME, Smart Money has created an equality pattern AB=CD.
Point C is at the 68.8 Fibonacci level of wave AB.
Point D is at the 127.2 Fibonacci level of wave AB.
Additionally, on the D1 timeframe, we have a trend reversal candle.
At the moment, the price should bounce upwards to the 61.8 retracement level of wave AD, which is around 0.0105$.

#BOME It's nearing the end.This is the result of investing in shitcoins.
Some naive people think that Trump is a savior and a hero who will bring the crypto market to an altcoin season (Alt Season) with his arrival. Unaware that Trump will do something with crypto that will be recorded in history and the Guinness Book of Records, leading to the complete destruction of this market. It all started with his own meme coin, which caused a severe crash in the entire altcoin and meme coin market. The damage he inflicted on the market with his meme coin had not yet healed when he introduced his wife's meme coin. After that, we witnessed the foolish political-economic statements of his son. Now, he has also started a trade war between countries, and its effects are visible in the crypto market. Do not forget what happened to Trump in America after Trump's presidency ended. Now, he is full of resentment and anger and no longer cares about the people. He is doing everything he can to ensure that he and his inner circle accumulate enough wealth and power so that no one can harm him again.
My advice to you is to avoid trading in the futures market for the next three months, or even six months, and focus only on options and spot trading, with Bitcoin being your primary focus, as government entities are also buying it. However, altcoins and meme coins will soon experience a more severe crash, as Trump has proven that he is not someone who solves problems peacefully and always takes the worst possible actions.
Every crisis in the market is not opportunity to exit altcoins and meme coins. Please adapt yourself to the current conditions; it is no longer like previous years, and do not wait for an altcoin season. There is no altcoin season anymore, because in the past, these seasons were due to the limited number of coins in the market, not now when thousands of new coins are created daily, and governments have also entered the crypto market. Any market that governments enter will never benefit ordinary people unless a miracle happens and conditions change, which I doubt will occur anytime soon.
You never thought prices would reach this level, but they did. Do not think that now is a good time to buy, because prices will go even lower, and this is the beginning of a massive crash that will be recorded in history. Also, keep in mind that since government entities and large companies are buying Bitcoin, they will certainly do something to cause its price to drop so they can buy Bitcoin from ordinary people at lower prices.
Ethereum has also proven that it has not had significant growth during this period. Therefore, try to protect your capital until we get through this crisis created by Trump.
