BLMN - Dec 24 100SMA StrongWeak BounceBLMN
Sector: Restaurants
Falling revenue and EPS
Nov Bloomin' Brands is selling 67% of its Brazilian business to focus on the struggling U.S. market, facing strong competition and declining sales.
The sale to Vinci Partners will simplify operations and provide funds for necessary U.S. re
Bloomin' Brands, Inc.
No trades
Next report date
—
Report period
—
EPS estimate
—
Revenue estimate
—
−0.60 EUR
−123.66 M EUR
3.82 B EUR
83.15 M
About Bloomin' Brands, Inc.
Sector
Industry
CEO
Michael L. Spanos
Website
Headquarters
Tampa
Founded
1988
IPO date
Aug 8, 2012
Identifiers
3
ISIN US0942351083
Bloomin' Brands, Inc. engages in the acquisition, operation, design, and development of restaurant concepts. It operates through the U.S. and International geographical segments. The U.S. segment operates in the USA and Puerto Rico. The International segment operates in Brazil, South Korea, Hong Kong, and China. Its brands include Outback Steakhouse, Carrabba's Italian Grill, Bonefish Grill, and Fleming's Prime Steakhouse and Wine Bar. The company was founded by Chris Thomas Sullivan, Robert Danker Basham and John Timothy Gannon in March 1988 and is headquartered in Tampa, FL.
Related stocks

$BLMNGreen: Entry Point
Blue: Start of Week
Red: End of Week
Thumbs Up: Trade Available for Week
Numbers: Price Targets
*For share traders only. Not meant for options.

bollinger shows mid 14 bounce possibleIf history repeats, then we should be seeing a reversal soon, but we should keep a close eye on this.

LONG BLMN 041824This may be a good opportunity for a breakout in Bloomin Brands.
We have reached the lower swing and are looking for support at current level.
Setup an alert to $27.30 and take a long one it goes above.
Happy Trading,

$BLMN Setting UpRestaurant sector looking constructive. Might help put a floor under NASDAQ:WING
But where is NASDAQ:BLMN that's looking pretty sweet.

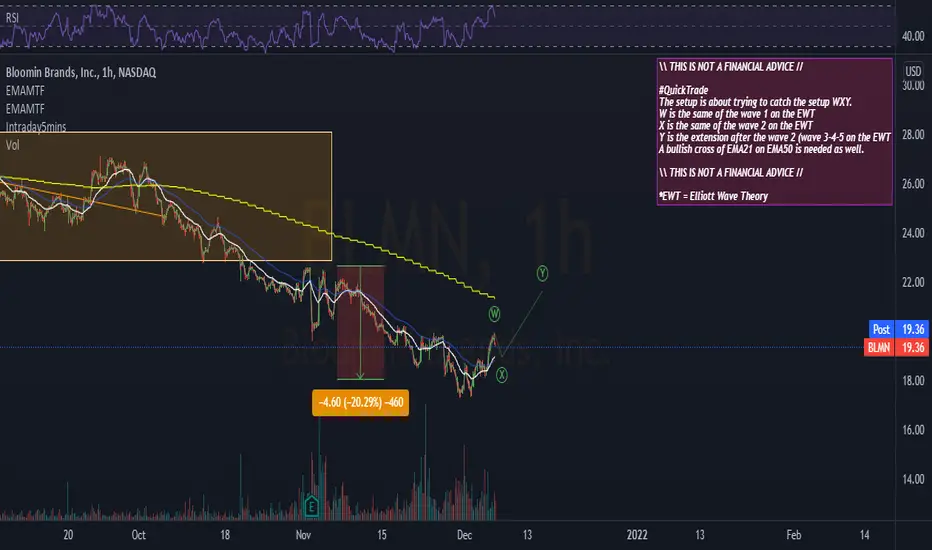
QuickTradeBLMN shows the beginning of my #WXYSetup
First 1-2 + Bullish cross
RSI Overbought
Stops at 18.45 / 17.8
$BLMN Bloomin’ Brands Promotes Danielle Vona to Executive Leader$BLMN Bloomin’ Brands Promotes Danielle Vona to Executive Leadership Team. New CMO Brings tremendous marketing experience to the table, Recent PT Upgrades and unusual darkpool activity. This looks like a no brainer.
www.businesswire.com

Expectation Record BLMN for 10 - 14 May 2021Resistance 1 : 32.80
Support 1 : 28.80
Support 2 : 27.20
BLMN after hit new High at 32.80 and now close above 30.00. Support_1 (28.80) will be support point for BLMN in short period of time.


Target hit !Earnings boosted the price to its target. Now a fast EMA must act as support for the uptrend (if any).
The 21 daily will be used as main support as well.

See all ideas
Summarizing what the indicators are suggesting.
Neutral
SellBuy
Strong sellStrong buy
Strong sellSellNeutralBuyStrong buy
Neutral
SellBuy
Strong sellStrong buy
Strong sellSellNeutralBuyStrong buy
Neutral
SellBuy
Strong sellStrong buy
Strong sellSellNeutralBuyStrong buy
An aggregate view of professional's ratings.
Neutral
SellBuy
Strong sellStrong buy
Strong sellSellNeutralBuyStrong buy
Neutral
SellBuy
Strong sellStrong buy
Strong sellSellNeutralBuyStrong buy
Neutral
SellBuy
Strong sellStrong buy
Strong sellSellNeutralBuyStrong buy
Displays a symbol's price movements over previous years to identify recurring trends.
Frequently Asked Questions
The current price of BOO is 5.20 EUR — it has increased by 2.97% in the past 24 hours. Watch Bloomin' Brands, Inc. stock price performance more closely on the chart.
Depending on the exchange, the stock ticker may vary. For instance, on GETTEX exchange Bloomin' Brands, Inc. stocks are traded under the ticker BOO.
BOO stock has fallen by −5.45% compared to the previous week, the last month showed zero change in price, over the last year Bloomin' Brands, Inc. has showed a −56.67% decrease.
We've gathered analysts' opinions on Bloomin' Brands, Inc. future price: according to them, BOO price has a max estimate of 9.26 EUR and a min estimate of 4.21 EUR. Watch BOO chart and read a more detailed Bloomin' Brands, Inc. stock forecast: see what analysts think of Bloomin' Brands, Inc. and suggest that you do with its stocks.
BOO stock is 5.00% volatile and has beta coefficient of 1.24. Track Bloomin' Brands, Inc. stock price on the chart and check out the list of the most volatile stocks — is Bloomin' Brands, Inc. there?
Today Bloomin' Brands, Inc. has the market capitalization of 431.56 M, it has decreased by −21.05% over the last week.
Yes, you can track Bloomin' Brands, Inc. financials in yearly and quarterly reports right on TradingView.
Bloomin' Brands, Inc. is going to release the next earnings report on Feb 12, 2026. Keep track of upcoming events with our Earnings Calendar.
BOO earnings for the last quarter are −0.03 EUR per share, whereas the estimation was −0.10 EUR resulting in a 75.36% surprise. The estimated earnings for the next quarter are 0.21 EUR per share. See more details about Bloomin' Brands, Inc. earnings.
Bloomin' Brands, Inc. revenue for the last quarter amounts to 791.53 M EUR, despite the estimated figure of 772.39 M EUR. In the next quarter, revenue is expected to reach 834.91 M EUR.
BOO net income for the last quarter is −39.56 M EUR, while the quarter before that showed 20.16 M EUR of net income which accounts for −296.23% change. Track more Bloomin' Brands, Inc. financial stats to get the full picture.
Yes, BOO dividends are paid quarterly. The last dividend per share was 0.13 EUR. As of today, Dividend Yield (TTM)% is 11.56%. Tracking Bloomin' Brands, Inc. dividends might help you take more informed decisions.
As of Feb 4, 2026, the company has 81 K employees. See our rating of the largest employees — is Bloomin' Brands, Inc. on this list?
EBITDA measures a company's operating performance, its growth signifies an improvement in the efficiency of a company. Bloomin' Brands, Inc. EBITDA is 265.99 M EUR, and current EBITDA margin is 9.68%. See more stats in Bloomin' Brands, Inc. financial statements.
Like other stocks, BOO shares are traded on stock exchanges, e.g. Nasdaq, Nyse, Euronext, and the easiest way to buy them is through an online stock broker. To do this, you need to open an account and follow a broker's procedures, then start trading. You can trade Bloomin' Brands, Inc. stock right from TradingView charts — choose your broker and connect to your account.
Investing in stocks requires a comprehensive research: you should carefully study all the available data, e.g. company's financials, related news, and its technical analysis. So Bloomin' Brands, Inc. technincal analysis shows the sell today, and its 1 week rating is sell. Since market conditions are prone to changes, it's worth looking a bit further into the future — according to the 1 month rating Bloomin' Brands, Inc. stock shows the sell signal. See more of Bloomin' Brands, Inc. technicals for a more comprehensive analysis.
If you're still not sure, try looking for inspiration in our curated watchlists.
If you're still not sure, try looking for inspiration in our curated watchlists.