BRETT - TECHNICAL OUTLOOK$BRETT - Price Analysis 🔍
🟨 Neutral vibes on the daily chart right now.
The price is still stuck below that key $0.05800 weekly resistance, bulls just can’t break through yet!
🚦 Green light only if we close and consolidate above $0.05800. That’s the level to watch for any real breakout and bullish

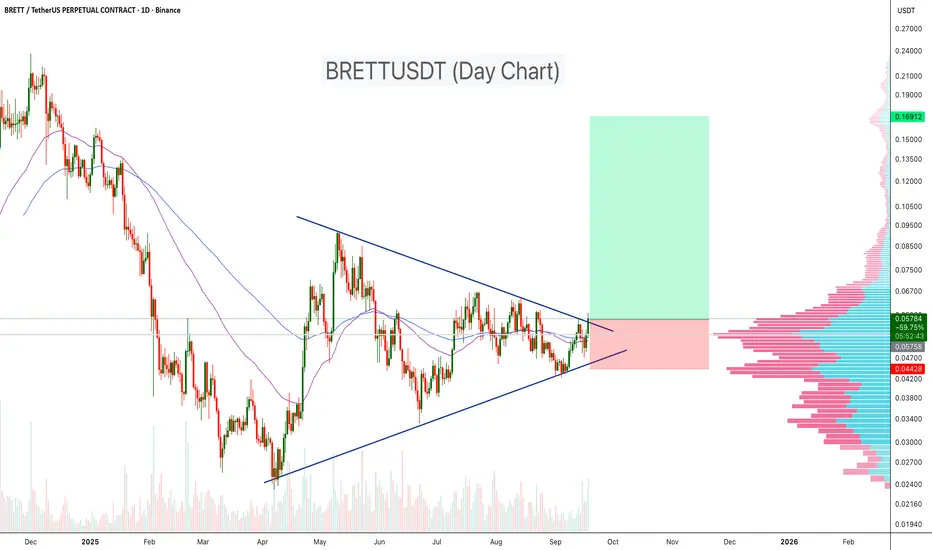
BRETTUSDT – Symmetrical Triangle Breakout!BRETTUSDT has been consolidating within a symmetrical triangle for several months, showing strong compression between ascending support and descending resistance. Recently, price action has started to break above the resistance trendline, signaling a possible bullish continuation. With moving averag
BRETT HTF Liquidity Raid + Demand TapWhat’s up, Candle Craft fam 🔥
We’re eyeing a high-probability bounce zone below structure for BRETT. No need to wait for confirmation here — the liquidity + structure setup is too clean.
📍 Updated Setup:
– Price broke rising wedge + retracing
– Anticipating dip into HTF demand pocket
– Bounce expec

BRETT / USDT : Breaking out from symmetrical triangleBRETT / USDT is breaking out from the symmetrical triangle. If this breakout holds, we could see a strong rally towards $0.085 – $0.095 in the short term.
Always wait for confirmation and manage risk properly.

BRETTUSDTIf you buy Brett today you are still early buyer of this coin, There is so much potential in Brett ,One of the leading meme coin on base chain, try to accumulate as much as you can....

Brett pump to $0.06 todaySl: 0.05434
Tp: 0.06
Brett looks very likely to pump. Closed the day at relatively low point on lower tf structure like 1hr timeframe....Buy low and sell high.
DTT strategy applied
3RR

BRET/USDT/300%/Daily - Not an investment advice ! 300%Hello there guys
I only use 2 Fibs and it works great for long term time frames
it's so simple.
Don't depend on others perspectives about charts and movements !

BRETT/USDT — End of Consolidation, Beginning of a Big Move?BRETT/USDT is currently forming a symmetrical triangle pattern on the Daily timeframe (1D). This structure is shaped by lower highs (selling pressure) and higher lows (buying pressure), which are now converging near the apex zone (0.049–0.064). As price approaches the tip of the triangle, volatility

BRETT - The #1 meme on BASE - Looking for breakoutR/R 9.25
Enter 0.06392
Stop 0.05327
Int 1 0.07
Int 2 0.086
Target 0.16240

BRETT - The #1 meme on BASE It looks like Brett is setting up for continuation upside. Target around 0.11. Lets see if we get a final low to form this potential pattern.
I'm keeping a close eye on this one as twice this year Brett has over performed similar patterns and by far my best two trades this year.
The narrative beh

See all ideas
Summarizing what the indicators are suggesting.
Oscillators
Neutral
SellBuy
Strong sellStrong buy
Strong sellSellNeutralBuyStrong buy
Oscillators
Neutral
SellBuy
Strong sellStrong buy
Strong sellSellNeutralBuyStrong buy
Summary
Neutral
SellBuy
Strong sellStrong buy
Strong sellSellNeutralBuyStrong buy
Summary
Neutral
SellBuy
Strong sellStrong buy
Strong sellSellNeutralBuyStrong buy
Summary
Neutral
SellBuy
Strong sellStrong buy
Strong sellSellNeutralBuyStrong buy
Moving Averages
Neutral
SellBuy
Strong sellStrong buy
Strong sellSellNeutralBuyStrong buy
Moving Averages
Neutral
SellBuy
Strong sellStrong buy
Strong sellSellNeutralBuyStrong buy
Displays a symbol's price movements over previous years to identify recurring trends.