Facing channel trendline resistance .....can be shortedCan be shorted at Trendline resistance area for 25 points Targets SL 2340
ASIANPAINT trade ideas

Go long if cross levelRange breakout but still pending for move, Go long if open flat or almost flat and cross level

#ASIANPAINT equal leg move at a faster pace#ASIANPAINT equal leg move at a faster pace while crude has jumped 40% in 2 month.

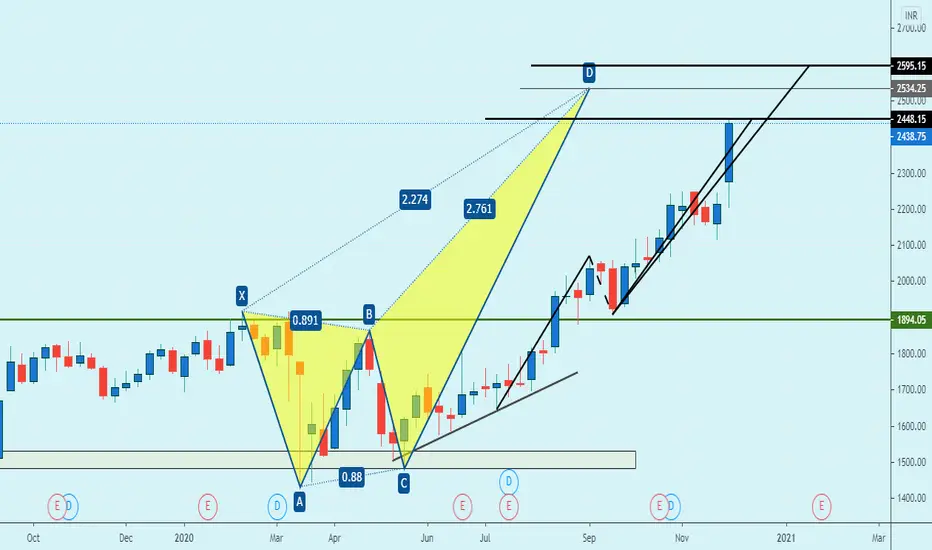
Time to be Cautiousmultiple Resistance as per Harmonics... lets see how price reacts here.... if u are long... trails your Sl... or book 50% at PRZ
Asian Paints - Breakout with Volume - Blue sky, wait for retestBreakout with Volume - Blue sky, wait for retest to enter


ASIANPAINT - Bullish view - Short Term/IntradayThis analysis is purely based on price action and Chart Patterns.
The analysis is on 30min TF hence target can be achieved in intraday trade or in couple of days
Trade strategy is explained in image itself. Don't chase the price.
Always plan your trade & trade your plan
Keep trailing SL accordingly once entered into the trade.
Trade at your own risk and money management. Do your own study before taking any trade
Feel free to comment for any queries & suggestion


ASIAN PAINTS LOOK OUT FOR THESE LEVELS!!! ALL THE LEVELS AND PATTERNS ARE MARKED ON CHART, RED ZONES DENOTES SUPPLY ZONES AND GREEN IS FOR DEMAND ZONE.
PRICE WAS TAKING SUPPORT FROM DAILY 20 EMA BUT FINALLY GAVE A CLOSING BELOW IT. 2150-2155 HAS ACTED AS A MAJOR SUPPORT. INCASE THE STOCKS BREAKS THIS LEVEL, WE MIGHT SEE 2135/2100. INCASE OF UPPER BREAKOUT OF TRIANGLE PATTERN NEARBY RESISTANCE IS ALREADY MARKED ON CHARTS (RED LINES)
The indicator used:
1) Daily Lines plots Daily 20 (BLACK) & 50 EMA (GREY) on lower time frame charts
2) TE-REKAB
- PB : PULLBACK
If you like the analysis, do leave a like and follow for more such content coming up.
The analysis is my POV, hope you got bucks in your pocket to consult a financial advisor before investing :P :)
HAPPY TRADING!


#AsianPaintsAsian Paints is bullish on every TF. Here on Daily chart we are seeing a Rising Wedge Pattern indicating a strong trend reversal. We can confirm the bearishness once the pattern is broken.

ASIANPAINT - Short-term TradeThis analysis is purely based on price action and Chart Patterns.
The analysis is on 30min TF hence target can be achieved within couple of days
Trade logic and strategy is explained in image itself. Don't run after the price.
Always plan your trade & trade your plan
Keep trailing SL accordingly once entered into the trade.
Trade at your own risk and money management. Do your own study before taking any trade
Feel free to comment for any queries & suggestion


Uptrend channel with a triangle breakout, good to watchoutJust watch the trendline break and trade accordingly.

Live Intraday Trading - How to identify a "W" pattern !!It is a bullish formation pattern . Every time a breakout in this pattern gives a handsome profit !!


Asian paints good short candidateAsian paints spot cmp 2220
Deep crab pattern formation, bearish
PRZ around 2215 to 2240
Pattern violation above 2260 on closing basis
counter is trading around trend line resistance of rising channel pattern
price is making higher high and RSI is making lower high, bearish divergence
Good short candidate
Down side levels of 2121,,2060,,2010 possible
