IOL Chemicals & Pharmaceuticals Ltd. Bullish Reversal SetupSharing a fresh daily chart setup for IOL Chemicals & Pharmaceuticals Ltd. (NSE:IOLCP). The price has pulled back to the ₹100–₹98 support zone after a recent decline and is attempting to hold above the ₹103–₹106 structure flip, indicating potential buyer interest.
Trade Plan
Entry Zone: ₹101–₹104 (
Next report date
—
Report period
—
EPS estimate
—
Revenue estimate
—
3.95 INR
1.01 B INR
20.72 B INR
122.38 M
About IOL Chemicals & Pharmaceuticals Ltd.
Sector
Industry
CEO
Vikas Gupta
Website
Headquarters
Ludhiana
Founded
1986
ISIN
INE485C01029
FIGI
BBG000CT9DX8
IOL Chemicals & Pharmaceuticals Ltd. engages in the manufacture of organic and inorganic chemical compounds. It operates through the following geographical segments: India and Rest of the World. The company was founded on September 28, 1986 and is headquartered in Ludhiana, India.
Related stocks

IOLCPMonthly Chart
RSI above 60 Daily / Weekly / Monthly
2 Years Breakout
Volume Growth on Daily Candle
Expected level aal time High

Amazing breakout on WEEKLY Timeframe - IOLCPCheckout an amazing breakout happened in the stock in Weekly timeframe, macroscopically seen in Daily timeframe. Having a great favor that the stock might be bullish expecting a staggering returns of minimum 25% TGT. IMPORTANT BREAKOUT LEVELS ARE ALWAYS RESPECTED!
NOTE for learners: Place the break
iolcpOL Chemicals and Pharmaceuticals (IOLCP) is a leading organic chemicals manufacturers and suppliers. They are Indian manufacturer of industrial chemicals & bulk drugs for over two decades, by pursuing & implementing the highest standards of excellence in their operations, they have nurtured their ca

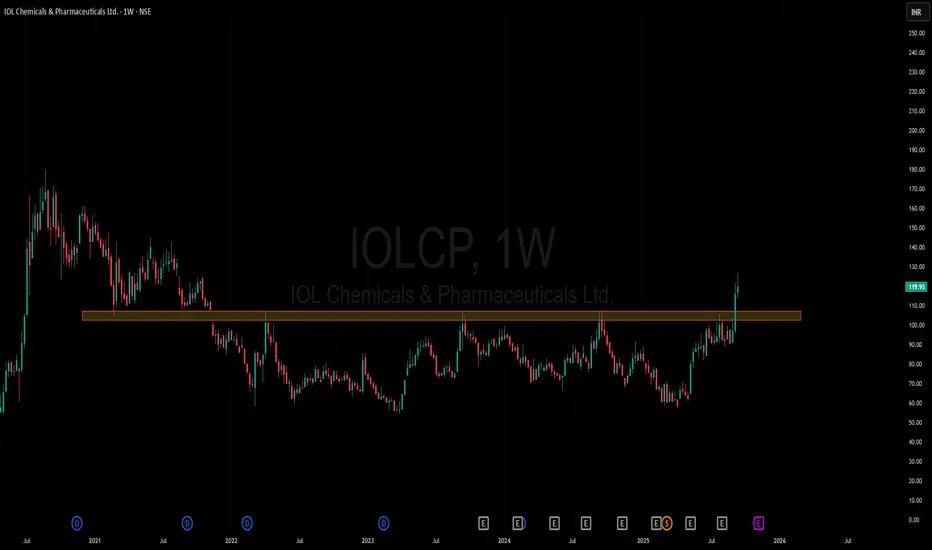
IOLCP – Multi-Year Breakout Setup Forming? | Inverse H&S in FocAnalysis:
IOL Chem & Pharma is showing signs of life after years of consolidation. A potential inverse Head & Shoulders pattern is forming with a neckline around ₹90–91.
📍 Key Levels:
✅ ₹91 – Breakout level on daily close
⚡ ₹111 – Multi-year breakout confirmation
🛡️ SL: ₹75 (below recent structu

Stage Breakout - IOLCPStage Breakout - IOLCP
This counter had hit my SL in 2023 & 2024 B/o attempts. I am hopeful it would not disappoint me this time. B/o with volume seems it's getting ready.
Stage Breakout with interesting pattern. Let's see whether it reaches & crosses 180 level.
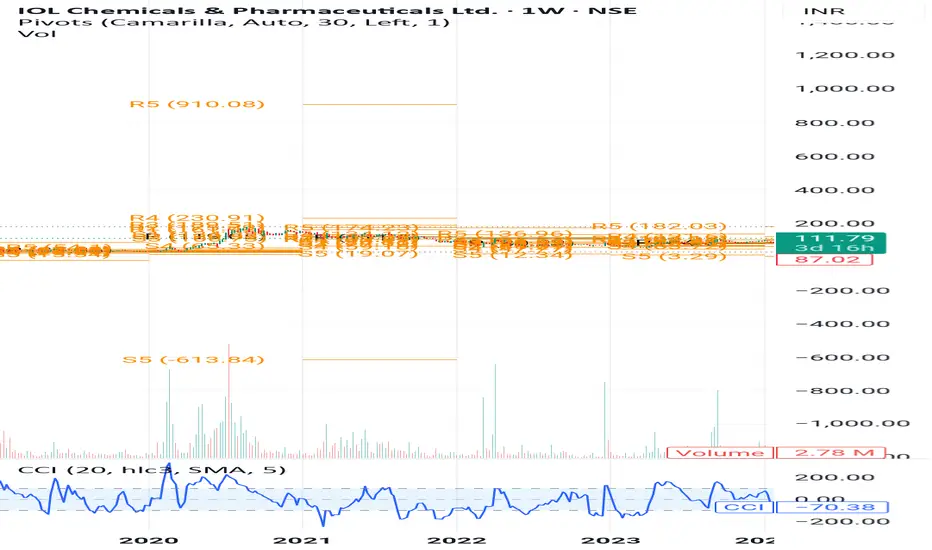
IOL.ChemicalsIOL Chemicals & Pharmaceuticals – Strong Breakout 🚀
💰 Capital to deploy: ₹20,000
📌 Entry / Breakout Zone: ₹105 – ₹110
🛑 Stoploss: ₹85 (Risk: ~₹20/share)
🎯 Targets: ₹182 / ₹230 / ₹910
🔹 Risk–Reward Ratio:
To ₹182 → ~1 : 3.8
To ₹230 → ~1 : 6.2
To ₹910 → ~1 : 40+ 🚀
🔹 Potential Upside: +65% /
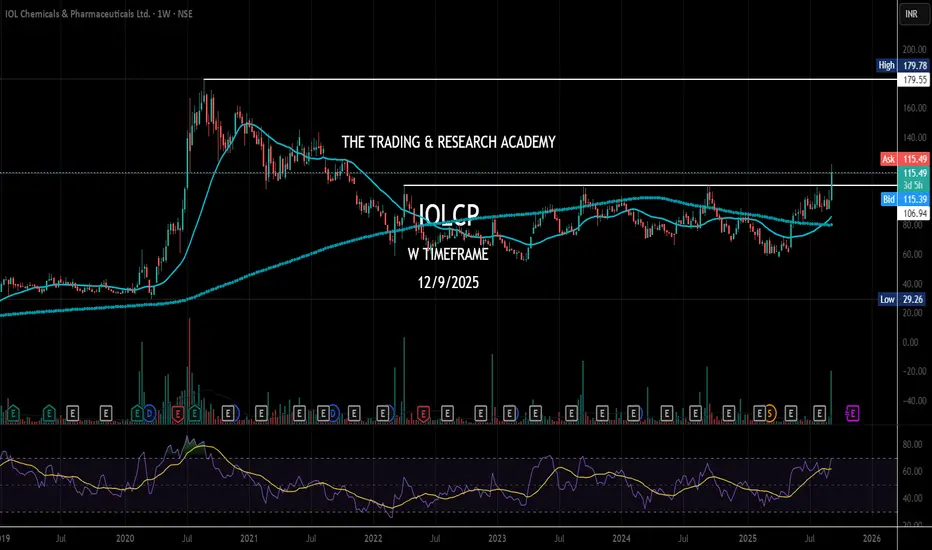
IOLCP positionally looking goodIOL CHEM AND PHARMA LTD (Weekly Chart) – Key Points
Trend:
The stock has finished a long consolidation (Wave ④) and is starting a new upward rally (Wave ⑤ expected).
Price Movement:
Current price: ₹101.47 after a recent sharp rise.
Important resistance to watch: ₹120–₹130 zone.
Momentum (RSI):

Triangle Breakout Alert: IOLCP Eyes ₹100!Key Observations:
Symmetrical Triangle Pattern:
The price was consolidating within a symmetrical triangle, marked by:
Descending trendline (upper resistance)
Ascending trendline (lower support)
Breakout:
On May 15, 2025, the stock broke out above the descending trendline with a strong bullish c

IOLCP stock is hovering around SupportPharma Sector Stock
Leading API (Active Pharmaceutical Ingredients) Manufacturer
IOLCP (IOL Chemicals & Pharmaceutical Ltd) Technical Analysis
After 70% correction from ATH supports visible in IOLCP:
Parallel Channel
Law of Polarity
Volume Profile
Anchored VWAP
RSI

See all ideas
Summarizing what the indicators are suggesting.
Neutral
SellBuy
Strong sellStrong buy
Strong sellSellNeutralBuyStrong buy
Neutral
SellBuy
Strong sellStrong buy
Strong sellSellNeutralBuyStrong buy
Neutral
SellBuy
Strong sellStrong buy
Strong sellSellNeutralBuyStrong buy
An aggregate view of professional's ratings.
Neutral
SellBuy
Strong sellStrong buy
Strong sellSellNeutralBuyStrong buy
Neutral
SellBuy
Strong sellStrong buy
Strong sellSellNeutralBuyStrong buy
Neutral
SellBuy
Strong sellStrong buy
Strong sellSellNeutralBuyStrong buy
Displays a symbol's price movements over previous years to identify recurring trends.
Frequently Asked Questions
The current price of IOLCP is 92.71 INR — it has decreased by −1.01% in the past 24 hours. Watch IOL Chemicals & Pharmaceuticals Ltd. stock price performance more closely on the chart.
Depending on the exchange, the stock ticker may vary. For instance, on BSE exchange IOL Chemicals & Pharmaceuticals Ltd. stocks are traded under the ticker IOLCP.
IOLCP stock has fallen by −6.73% compared to the previous week, the month change is a −5.60% fall, over the last year IOL Chemicals & Pharmaceuticals Ltd. has showed a 34.38% increase.
We've gathered analysts' opinions on IOL Chemicals & Pharmaceuticals Ltd. future price: according to them, IOLCP price has a max estimate of 110.00 INR and a min estimate of 110.00 INR. Watch IOLCP chart and read a more detailed IOL Chemicals & Pharmaceuticals Ltd. stock forecast: see what analysts think of IOL Chemicals & Pharmaceuticals Ltd. and suggest that you do with its stocks.
IOLCP reached its all-time high on Aug 25, 2020 with the price of 179.68 INR, and its all-time low was 0.40 INR and was reached on Feb 20, 2004. View more price dynamics on IOLCP chart.
See other stocks reaching their highest and lowest prices.
See other stocks reaching their highest and lowest prices.
IOLCP stock is 4.78% volatile and has beta coefficient of 2.18. Track IOL Chemicals & Pharmaceuticals Ltd. stock price on the chart and check out the list of the most volatile stocks — is IOL Chemicals & Pharmaceuticals Ltd. there?
Today IOL Chemicals & Pharmaceuticals Ltd. has the market capitalization of 26.51 B, it has increased by 7.82% over the last week.
Yes, you can track IOL Chemicals & Pharmaceuticals Ltd. financials in yearly and quarterly reports right on TradingView.
IOL Chemicals & Pharmaceuticals Ltd. is going to release the next earnings report on Feb 10, 2026. Keep track of upcoming events with our Earnings Calendar.
IOLCP net income for the last quarter is 299.70 M INR, while the quarter before that showed 339.30 M INR of net income which accounts for −11.67% change. Track more IOL Chemicals & Pharmaceuticals Ltd. financial stats to get the full picture.
As of Nov 24, 2025, the company has 3.37 K employees. See our rating of the largest employees — is IOL Chemicals & Pharmaceuticals Ltd. on this list?
EBITDA measures a company's operating performance, its growth signifies an improvement in the efficiency of a company. IOL Chemicals & Pharmaceuticals Ltd. EBITDA is 2.29 B INR, and current EBITDA margin is 9.44%. See more stats in IOL Chemicals & Pharmaceuticals Ltd. financial statements.
Like other stocks, IOLCP shares are traded on stock exchanges, e.g. Nasdaq, Nyse, Euronext, and the easiest way to buy them is through an online stock broker. To do this, you need to open an account and follow a broker's procedures, then start trading. You can trade IOL Chemicals & Pharmaceuticals Ltd. stock right from TradingView charts — choose your broker and connect to your account.
Investing in stocks requires a comprehensive research: you should carefully study all the available data, e.g. company's financials, related news, and its technical analysis. So IOL Chemicals & Pharmaceuticals Ltd. technincal analysis shows the sell today, and its 1 week rating is neutral. Since market conditions are prone to changes, it's worth looking a bit further into the future — according to the 1 month rating IOL Chemicals & Pharmaceuticals Ltd. stock shows the buy signal. See more of IOL Chemicals & Pharmaceuticals Ltd. technicals for a more comprehensive analysis.
If you're still not sure, try looking for inspiration in our curated watchlists.
If you're still not sure, try looking for inspiration in our curated watchlists.