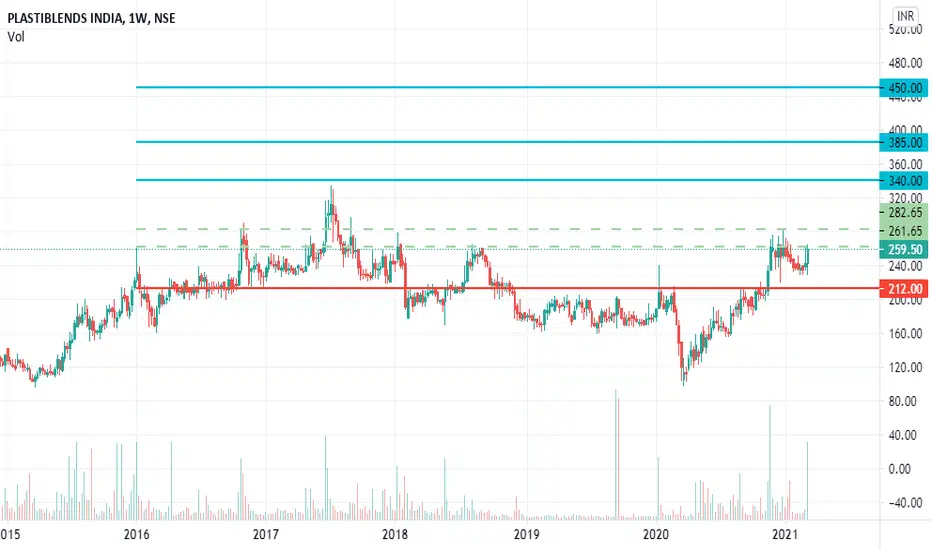
PLASTIBLENDS - ROUND BOTTOM BREAKOUT8 Months of Round Bottom breakout
BUY PRICE : 353
SL : 304 (only for swing traders)
TARGET : 480 (36%)
Disclaimer - All information on this page is for educational purposes only,
we are not SEBI Registered, Please consult a SEBI registered financial advisor for your financial matters before in
12.55 INR
334.42 M INR
7.80 B INR
8.66 M
About Plastiblends India Limited
Sector
Industry
Website
Headquarters
Mumbai
Founded
1991
ISIN
INE083C01022
FIGI
BBG000CXTWP4
Plastiblends India Ltd. engages in the manufacture and distribution of master batches. Its product range includes white masterbatches, black masterbatches, color masterbatches, additive masterbatches, filler masterbatches, PET masterbatches, and conductive masterbatches. The company was founded on January 21, 1991 and is headquartered in Mumbai, India.
Related stocks

7 year old high breakoutGood volume buildup in daily as well as weekly timeframe.
7year old high breakout with good volume.
Smallcap⚠️⚠️.
Cup and handle pattern formation.
Fundamentals are OK.
NOTE: I do my analysis, do yours before trade.


50 SMA Rising - Positional TradeI am not a Sebi registered adviser.
This Idea is publish purely for educational purpose only before investing in any stocks please take advise from your financial adviser.
It 50 SMA Rising. Suitable for Positional Trading Initial Stop loss lowest of last 2 candles and keep trailing with 50 days SMA

Plastiblends - Near Multi year breakout on Weekly chartsI love weekly multi year breakouts because the margin of error is significantly lower, that too when the stock did not rally one way from rock bottom levels to ATH but has been hovering around the neckline for quite sometime.
This is not a reco. DYOR. I am sharing the charts so that we can all lear

PLASTIBLENThis stock breakout nearly 8 years level if close strong weekly candle then breakout will confirmed and this is only for educational purpose only

PlastiblendsPlastiblends
Forming a nice pattern yet again for a bullish rally.
Last time around, The crossing of the 5-day Simple Moving Average (SMA) over the 20-day SMA resulted in a significant rally.
Now, it appears that a similar setup is about to repeat again. The previous rally lasted for 18 months,

Bullish PLASTIBLENBuy = 276.2
Stop Loss = 265.85
Target 1 = 296.9
Target 2 = 307.25
8Sep2021
Bullish PLASTIBLEN PLASTIBLENDS India
Buy for short term

resiatance break out in plastiblendshorizontal resistance breakout
buy above 286 on closing basis
RSI convergence
only glitch is volume

See all ideas
Summarizing what the indicators are suggesting.
Oscillators
Neutral
SellBuy
Strong sellStrong buy
Strong sellSellNeutralBuyStrong buy
Oscillators
Neutral
SellBuy
Strong sellStrong buy
Strong sellSellNeutralBuyStrong buy
Summary
Neutral
SellBuy
Strong sellStrong buy
Strong sellSellNeutralBuyStrong buy
Summary
Neutral
SellBuy
Strong sellStrong buy
Strong sellSellNeutralBuyStrong buy
Summary
Neutral
SellBuy
Strong sellStrong buy
Strong sellSellNeutralBuyStrong buy
Moving Averages
Neutral
SellBuy
Strong sellStrong buy
Strong sellSellNeutralBuyStrong buy
Moving Averages
Neutral
SellBuy
Strong sellStrong buy
Strong sellSellNeutralBuyStrong buy
Displays a symbol's price movements over previous years to identify recurring trends.
Frequently Asked Questions
The current price of PLASTIBLEN is 176.70 INR — it has decreased by −4.82% in the past 24 hours. Watch Plastiblends India Limited stock price performance more closely on the chart.
Depending on the exchange, the stock ticker may vary. For instance, on BSE exchange Plastiblends India Limited stocks are traded under the ticker PLASTIBLEN.
PLASTIBLEN stock has fallen by −3.60% compared to the previous week, the month change is a −11.43% fall, over the last year Plastiblends India Limited has showed a −35.51% decrease.
PLASTIBLEN reached its all-time high on Sep 2, 2024 with the price of 398.65 INR, and its all-time low was 1.50 INR and was reached on May 12, 1997. View more price dynamics on PLASTIBLEN chart.
See other stocks reaching their highest and lowest prices.
See other stocks reaching their highest and lowest prices.
PLASTIBLEN stock is 5.39% volatile and has beta coefficient of 1.63. Track Plastiblends India Limited stock price on the chart and check out the list of the most volatile stocks — is Plastiblends India Limited there?
Today Plastiblends India Limited has the market capitalization of 4.82 B, it has increased by 0.98% over the last week.
Yes, you can track Plastiblends India Limited financials in yearly and quarterly reports right on TradingView.
PLASTIBLEN net income for the last quarter is 74.36 M INR, while the quarter before that showed 89.23 M INR of net income which accounts for −16.67% change. Track more Plastiblends India Limited financial stats to get the full picture.
Yes, PLASTIBLEN dividends are paid annually. The last dividend per share was 2.50 INR. As of today, Dividend Yield (TTM)% is 1.35%. Tracking Plastiblends India Limited dividends might help you take more informed decisions.
Plastiblends India Limited dividend yield was 1.39% in 2024, and payout ratio reached 19.43%. The year before the numbers were 1.84% and 31.99% correspondingly. See high-dividend stocks and find more opportunities for your portfolio.
As of Oct 17, 2025, the company has 479 employees. See our rating of the largest employees — is Plastiblends India Limited on this list?
EBITDA measures a company's operating performance, its growth signifies an improvement in the efficiency of a company. Plastiblends India Limited EBITDA is 502.34 M INR, and current EBITDA margin is 6.83%. See more stats in Plastiblends India Limited financial statements.
Like other stocks, PLASTIBLEN shares are traded on stock exchanges, e.g. Nasdaq, Nyse, Euronext, and the easiest way to buy them is through an online stock broker. To do this, you need to open an account and follow a broker's procedures, then start trading. You can trade Plastiblends India Limited stock right from TradingView charts — choose your broker and connect to your account.
Investing in stocks requires a comprehensive research: you should carefully study all the available data, e.g. company's financials, related news, and its technical analysis. So Plastiblends India Limited technincal analysis shows the strong sell today, and its 1 week rating is strong sell. Since market conditions are prone to changes, it's worth looking a bit further into the future — according to the 1 month rating Plastiblends India Limited stock shows the sell signal. See more of Plastiblends India Limited technicals for a more comprehensive analysis.
If you're still not sure, try looking for inspiration in our curated watchlists.
If you're still not sure, try looking for inspiration in our curated watchlists.