Mastering Impulses and CorrectionsHello,
Successful trading in the stock market requires a comprehensive understanding of market trends and the ability to identify price patterns. One such pattern is the interplay between impulses and corrections. By recognizing these alternating phases, traders can gain valuable insights into potential market movements and make more informed trading choices. In this article, we will explore how to identify impulses and corrections in stocks and leverage this knowledge to guide our trading decisions.
Understanding Impulses and Corrections
Impulses and corrections are two primary components of price movements in the stock market. They represent the cyclical nature of stock prices, characterized by alternating phases of strong trending moves (impulses) and temporary price retracements (corrections). These patterns are largely influenced by the collective behavior of market participants, as supply and demand dynamics drive price action.
Impulses: The Power of Momentum
Impulses are the strong, directional moves that propel stock prices in a particular trend. They typically occur in the direction of the prevailing market sentiment and are characterized by higher volume and strong momentum. Impulses can result from a variety of factors, including positive news, strong earnings reports, or broader market trends.
To identify impulses, traders should look for the following characteristics:
Strong Price Movement: Impulses are marked by significant and sustained price advances or declines. These moves often occur in a relatively short period, indicating a surge of buying or selling pressure.
Volume Expansion : Increasing trading volume during an impulse signifies market participation and validates the strength of the move. Higher volume confirms the presence of eager buyers or sellers, further reinforcing the direction of the trend.
Break of Key Resistance or Support Levels : Impulses often break through important technical levels, such as support or resistance, further establishing the strength of the trend. These breakouts serve as confirmation points for traders.
Corrections: The Breath Before Resuming the Trend
Corrections, also known as retracements or pullbacks, are temporary price reversals that occur within an ongoing trend. They serve as a natural pause or breathing space for the market before resuming the dominant price direction. Corrections are characterized by price pullbacks against the prevailing trend, often retracing a certain percentage of the previous impulse.
To identify corrections, traders should consider the following factors:
Counter-Trend Price Movement : Corrections exhibit price movement in the opposite direction of the prevailing trend. These retracements can be shallow, typically ranging from 25% to 50% of the previous impulse's range.
Decreased Volume : Corrections usually occur on lower trading volume compared to impulses. This decline in volume suggests a temporary reduction in market participation and reinforces the notion of a temporary price reversal.
Support and Resistance Levels : Corrections often find support or encounter resistance at previously established price levels. These levels can act as potential reversal points, creating opportunities for traders to enter or add to positions.
Using Impulses and Corrections in Trading :
Recognizing impulses and corrections can provide valuable guidance for trading decisions. Here are some ways to leverage this knowledge:
Trend Identification:
By observing a sequence of impulses and corrections, traders can identify the prevailing trend. Understanding the broader market direction can help align trades with the momentum and improve the odds of success.
Entry and Exit Points: Impulses provide opportunities for traders to enter positions in the direction of the trend. Once an impulse is identified, traders can look for suitable entry points during corrections, aiming to enter at favorable prices before the next impulse begins.
Risk Management:
Understanding the interplay between impulses and corrections can help traders set appropriate stop-loss levels. Placing stops below significant support levels during corrections can protect against adverse price movements while still allowing the trade to capture potential gains.
Conclusion:
Recognizing and understanding the patterns of impulses and corrections in stock prices is a valuable skill for traders. By identifying these phases, traders can gain insights into market trends, determine entry and exit points, manage risk, and develop effective trading strategies. Incorporating this knowledge into trading decisions can significantly enhance the chances of success in the dynamic world of the stock market.
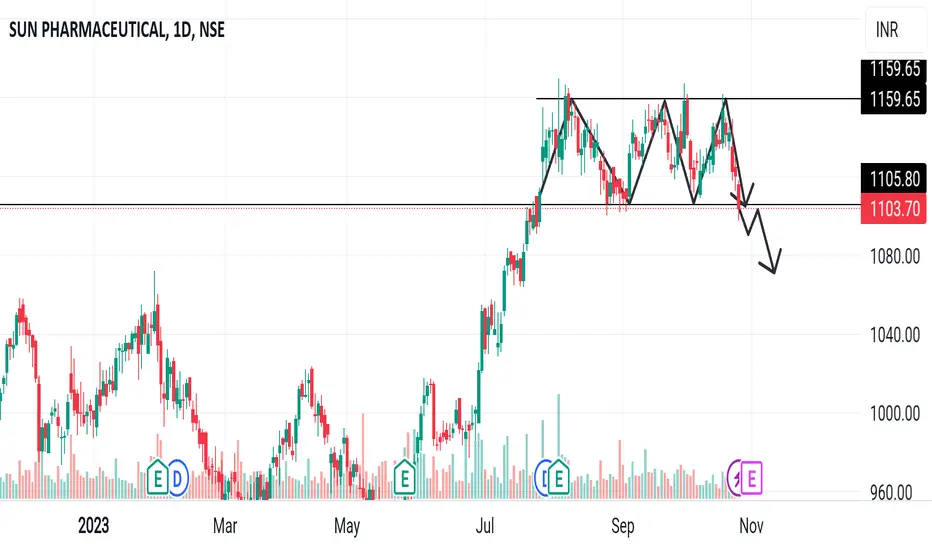
The above chart clearly shows you the Impulses and corrections on the Sunpharma chart.
Good luck and all the best in your trading!
SUNPHARMA trade ideas

Sunpharma📢 Three too pattern 📢
These are swing ideas which you can add your watchlist and analysis for yourself !
Keep on your radar 📡
This content only education purpose!
❗I am not sebi ragister❗
Short SunpharmaSunpharma has given a closing below 50SMA on daily chart pattern. Expecting a further downfall in stock.


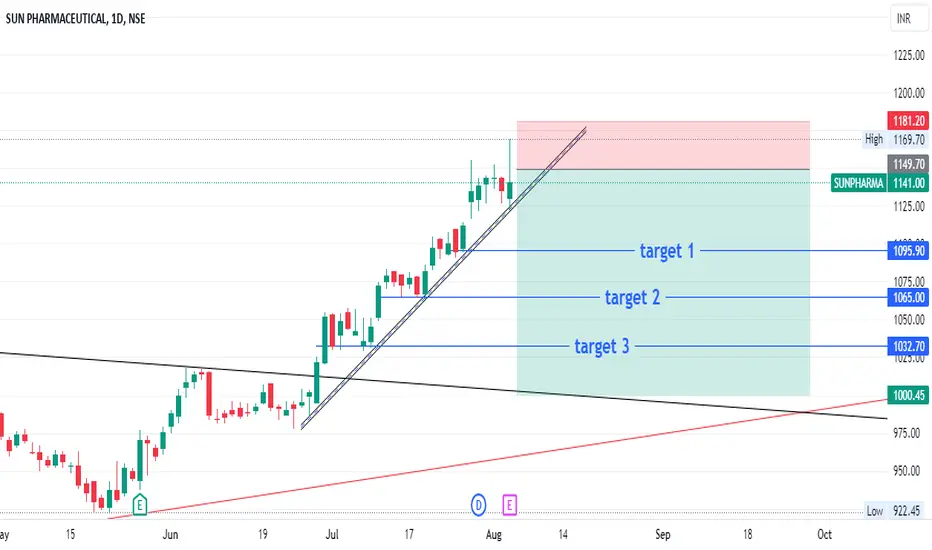
sunpharma sell @ 1132.95 target 1104, 1100, 1095 channel breakdsunpharma sell @ 1132.95 target 1104, 1100, 1095
channel breakdown
risk reward 1.2
sl@1170

SUNPHARMA bullish pennant chart pattern formationbullish pennant pattern formed in 15 min timeframe in SUNPHARMA
Go long once 1153.60 level breaks which appears to be a good resistance level.
SL should be at ~1149.50 level
Your first target could be 1169.70 level (52-week high level)
Happy Trading :)

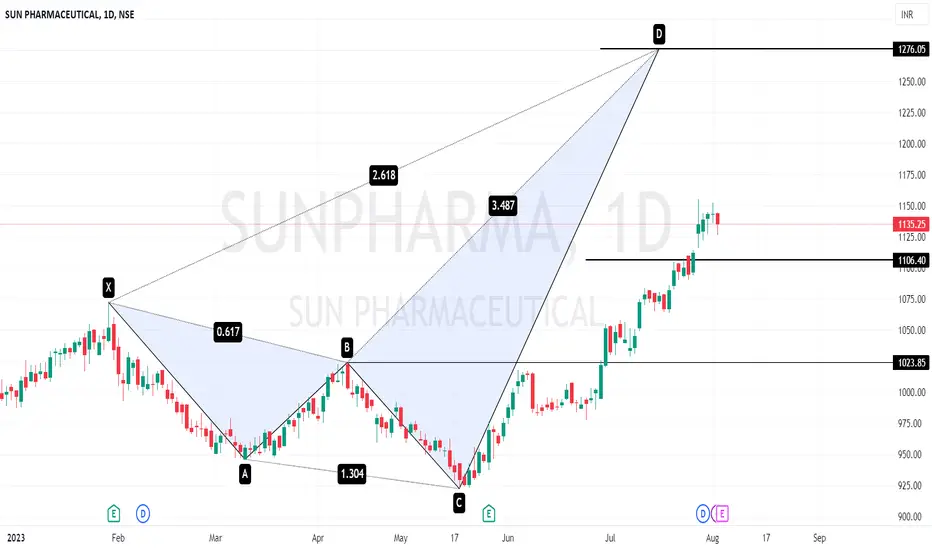
Sun Pharma ready for firing on upside For all trade on my Auto Harmonic patterns indicator trade setup -
Risky trades can take trade after crossing 23.6% on either side and safe traders can take trade after 41% We can start buying when our Trailing SL hit at 23.6% with SL of recent low our Target will be 41%, 78.6% , 127.2% 161.8% and 223.6 % , when reversal pattern appears on chart we have to trail our SL if trailing SL hit exit from long trade and initiate sell trade ,

Sun pharma - Wave countSun pharma - Wave Count NSE:SUNPHARMA BSE:SUNP1!
Correction may start soon.
Trade with Caution!

Sun Pharma Looking Weak | SELL 🐻Stock is facing resistance at Current levels since last 3 weeks and given price rejection from Upside. Any daily candle close below 1120, Can lead to downside till 1080 (Support on Chart). Watch closely for triangle breakout/ Breakdown.

Sun Pharma Looking Weak, Watch Closely 🐻Sun Pharma is looking bearish as last 3 week Stock facing resistance at current lavel and not able to break it. Any daily candle closing above 1120 can lead to downside till 1080 as its next support. Nifty Pharma is also looking slightly weak after continuous rally. Watch Sun Pharma closely for Traingle Breakout/Breakdown.

DO YOUR OWN ANALYSIS..if candle close below 1040 then look for sell
ENTRY - 1140
SL -1155
TARGET - 1114

MyPOV @ Sun PharmaI am looking at today's Closing which is at crucial level. according Fib level from previous swing low to today's High give 0.618 retracement.
What I am Assuming :
with Reference of RSI Level previously 60 to give deep towards 40 Level then around 6% retraced. same way if current RSI go to touch the level of 40 then one interesting pattern will emerge which is Head and Shoulder (Mark on Chart).
I know there is many if and else in this scenario to play, I am waiting to break Recent Swing Low (980)for put trade for Target 945 and defiantly change the view at 945 level and switch to find buying at that level.
For educational purposes only. Not financial advice. Consult a professional before making financial decisions. #Disclaimer
#NiVYAMi

Short term sunpharma view... #SUNPHARMA Short term sunpharma view... #SUNPHARMA
If sustain above 1000 then bullish momentum expectation ...
Charts for Educational purposes only.
Strictly follow Risk Reward and Stop Loss if you consider the level
Thanks,
V Trade Point

sunpharma sell formation 3 to 5 month see monthly and weekly shooting star candle
it has been breakout and go for long already now it need retresment
SunpharmaSunpharma Chart Analysis......03/08/23
Sunpharma Long above 1160
Sl - 1120,
Target - 1275
Enjoy !
Note : In Sun Pharma, we have entered from 1025 lvl., if you want to make a new entry, then go above 1160.
SUNPHARMANSE:SUNPHARMA
One Can Enter Now ! Or Wait for Retest of the Trendline (BO) Or wait For better R:R ratio
Note :
1.One Can Go long with a Strict SL below the Trendline or Swing Low of Daily Candle.
2. Close, should be good and Clean.
3. R:R ratio should be 1 :2 minimum
4. Plan as per your RISK appetite
Disclaimer : You are responsible for your Profits and loss, Shared for Educational purpose

sunpharma sunpharma is giving a long breakout from its weekly range trading below its previous high since 2015 after that it giving a breakout from that long range

SUNPHARMANSE:SUNPHARMA
One Can Enter Now ! Or Wait for Retest of the Trendline (BO) Or wait For better R:R ratio
Note :
1.One Can Go long with a Strict SL below the Trendline or Swing Low of Daily Candle.
2. Close, should be good and Clean.
3. R:R ratio should be 1 :2 minimum
4. Plan as per your RISK appetite
Disclaimer : You are responsible for your Profits and loss, Shared for Educational purpose

SUNPHARMA DAILY CHART (UPDATED)Sunpharama on its daily chart exhibits a fresh breakout & could head to the levels of 1164 in near term.This is new updated chart.
Its only an observation & not any suggestion.

Sun Pharma has broken out of a Descending Rectangle pattern
RECTANGLE PATTERN -
Sun Pharma has just broken out a descending rectangle pattern on the daily chart which had been forming since the beginning of the year
SUPPORT-RESISTANCE LINE -
After breaking out it has also tested the previous strong resistance trend line twice making it a strong support line now
SIMPLE MOVING AVERAGE -
It has also shown reversal confirmation from 50D, 100D & 200D SMA on daily chart which further strengthens the conviction of upside move
VOLUME -
It has also shown higher than average volume surge on the previous day
EXIT LEVELS -
TP - 1095.15
SL - 964.85
ALL THESE ABOVE POINTS INDICATE THAT SUN PHARMA IS POISED FOR NICE UPWARD MOVE

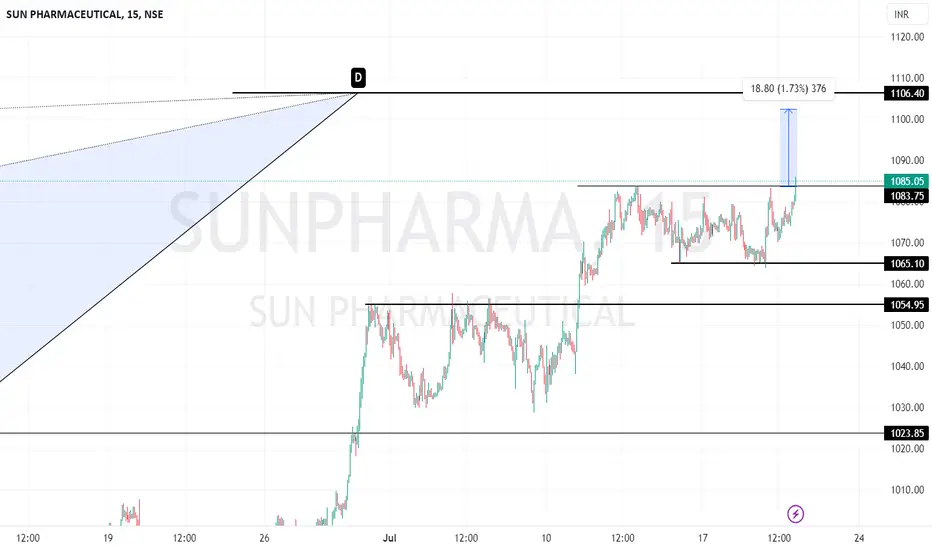
SUNPHARMASunpharma Chart Analysis...... 20/07/23
Sunpharma Long - above 1085,
Sl - 1078,
Target - 1100 / 1105
Enjoy !
Note : Sunpharma main hum 1027 lvl. se long hai...
Sunpharma Chart Analysis.........29/06/23
Sunpharma Long above - 1027,
Sl - 1000,
Target - 1035 / 1045 / 1072 / 1106

Correction about to completeHello,
Sun Pharmaceutical Industries Ltd. engages in manufacturing, developing, and marketing of pharmaceuticals products. It offers tablets, capsules, injectable, inhalers, ointments, creams, and liquids. The company was founded by Dilip Shantilal Shanghvi in 1983 and is headquartered in Mumbai, India
Below are a few metrics we looked at
Market cap: 2.37trillion Indian rupees
EPS: 17.55INR
Revenues: 2021(386.54B INR)
Net revenues: 2021 (32.73B INR)
Total assets: 2021 (713.81B)
Total labilities: 2021 (203.15B)
Free cashflow : 76.26B
Wait for the correction to complete before buying
Good luck!!
