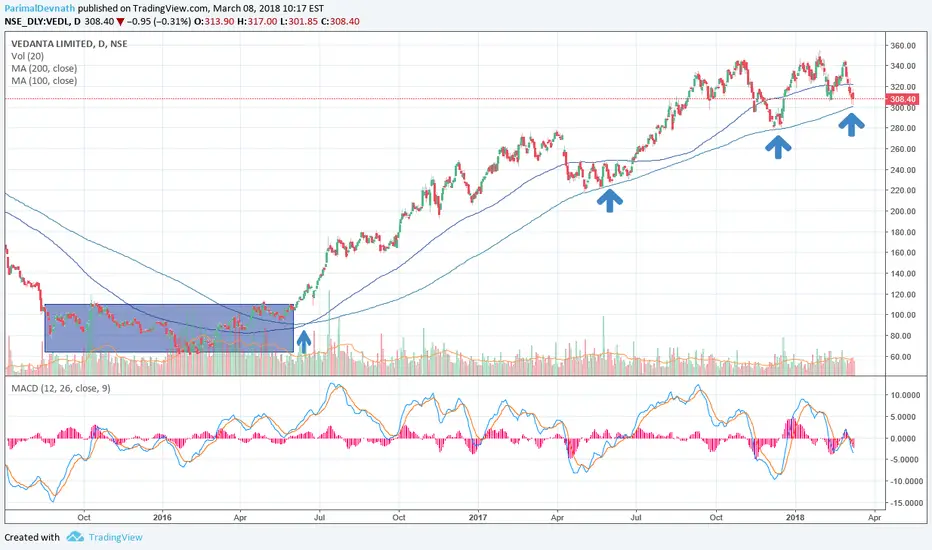
VEDL, 200DMAA bottom was created in January 2016 and since then a strong bull run has continued unabated. In June 2016 50 and 100 DMA gave a upward cross to 200 DMA which boosted the spirit of bulls. Now 350 is the strong resistance zone. So price again seeking support at 200 DMA. History repeats itself. Just as all earlier times, this time too one can expect price to head towards 350-- the resistance zone.
VEDL trade ideas

vedl head and shoulder patternwait to see if it breaks the resistance line successfully.....dont buy immediately....wait for price to retrace to breakout zone...put ua buy order there....with stop loss and trgt mentioned on chart...not a sebi registered analyst.....kindly take expert suggestion...


Vedanta-Double Bottom Near Demand ZoneMarket Analysis: The pair is now trading near the demand zone. Now it has formed a double bottom near the zone level. If the market is able to break the resistance and closes above 295. We can go for a long with a target of 315. So let's wait and see what the market does in the coming days. Cheers!


VEDL AB=CD The stock has rallied and retraced back. It formed a bearish AB=CD pattern in Daily chart and it is consolidating. Breaking that box will be next move. I speculate it will break downside to 290. One can initiate short with SL at 303 or 306 for a target of 290.

Filling the Gap on an Impulse?VEDL has been in correction phase after the impulse move and is experiencing resistance on the upside. if it breaks through that pattern downside, it may fill the Gap and moreover it can test the 230 Whole number . If it breaks to the upside, Then the trade will become invalid.
Enter According to the price action.

Short Sell VEDLToday Place SHORT SELL order @230 (Support) and take profit @228. Since VEDL is in downtrend, it will break support level.

Vedanta Limited - Ending diagonal and potential topVEDL spot on Daily chart. On weekly, u will see upmove was corrective to prior downmove. U see multiple MACD/Fisher divergences on weekly/daily/hourly. Plus a potential ED marked in green and targeting 204 in next 11 days targeting the purple line. What further confirmed top was selling excess at 276.

Short on RalliesVEDL is very close to completing a 5 wave structure that started in Feb 2016. We are currently in wave 5 of 5, which should complete very soon. The stock has given almost 5x returns in 1 year, expect the correction to be relatively sharp.

SELLDAILY FINANCIAL WISDOM: "It's better to trade alone, than trade with a crowd going in the wrong direction.


Vedanta - Bullish for very short termVedanta seems to making bearish gartley in 15 min tf and may target 176 if able to hold recent lows of 161

Vedanta ShortBoth Cairn and Vedanta are going to pull each other. Vednta has just broken 500DMA and will be a free fall from here until it finds support at 50DMA.
Extremely rewarding trade with upside of 13% and stoploss of 2%
CAIRN chart is corroborated with drop in USOIL prices. It is a high conviction trade.

