BTC1. Market Context Before the Move
On-chain metrics showed exchange outflows, reduced available BTC, and rising whale wallet accumulation, setting the stage for reduced downside panic and shallow liquidity sweeps.
Open interest and funding rates were balanced and slightly declining, meaning the market was not heavily biased in either direction—prime territory for a liquidity-driven move rather than a trend breakout.
2. The Downside Liquidity Sweep / Stop-Hunt
As seen on both clusters and TradingView, price broke down and aggressively swept the lower support/liquidation cluster ($109,500–110,000).
This cascade triggered long position liquidations and wiped out late, over-leveraged bulls, creating a "liquidity vacuum."
At the same time, aggressive shorts tried to chase the breakdown, but on-chain delta and liquidations confirmed most were too late and then quickly liquidated on the reversal.
3. Reversal and Pump: The Smart Money Play
After the downside flush, aggressive buying (positive delta, increasing OI around support) stepped in. This absorption matched large clusters
Price bounced sharply out of the support box, confirming this was a classic institutional stop-hunt and fade.
Longs who entered at the lowest liquidity cluster had the best risk/reward entries and quickly saw price rocket back above intraday support.
4. Short-Term Distribution/Profit-Taking
As the move unfolded, net long profit-taking began. Price faced resistance in the prior mid-range (your TradingView upper white box, $111,800–$113,000).
Shorts who entered early were liquidated, while new shorts began building higher—creating another potential squeeze if price surges again.
Order flow delta signals showed longs in profit reducing exposure, while new shorts may be "fuel" for further upside.
5. Price Action Structure (TradingView 4h TA)
The chart now shows price sitting inside a high-confluence support box, repeatedly defended as the main liquidity magnet.
If this box holds, intraday bounces or even a reversion to the upper resistance range ($113,000+) remain the highest probability play.
Failure to hold (strong breakdown with negative delta and OI spike) targets another flush and stop-hunt below.
players:
Open long if price
108500-109800
risk Takers : 109k-111k range
tp: 111,400
111,600
111,900
112,400
stop: 107600
Trade ideas

TRADING LEVERAGE | How to Manage RISK vs REWARDFor today's post, we're diving into the concept " Risk-Reward Ratio "
We'll take a look at practical examples and including other relevant scenarios of managing your risk. What is considered a good risk to reward ratio and where can you see it ? This applies to all markets, and during these volatile times it is an excellent idea to take a good look at your strategy and refine your risk management.
You've all noticed the really helpful tool " long setup " or " short setup " on the left-hand column. This clearly identifies the area of profit (in green), the area for a stop-loss (in red) and your entry (the borderline). It also shows the percentage of your increases or decreases at the top and bottom. It looks like this :
💭Something to remember; It is entirely up to you where you decided to take profit and where you decide to put your stop loss. The IDEAL anticipated targets are given, but the price may not necessarily reach these points. You have that entire zone to choose from and you can even have two or three take profits points in a position.
Now, what is the Risk Reward Ratio expressed in the center as a number.number ?
The risk to reward ration is exactly as the word says : The amount you risk for the amount you could potentially gain. NOTE that your risk is indefinite, but your gains are not guaranteed. The risk/reward ratio measures the difference between the entry point to a stop-loss and a sell or take-profit point. Comparing these two provides the ratio of profit to loss, or reward to risk.
For example, if you're a gambler and you've played roulette, you know that the only way to win 10 chips is to risk 5 chips. Your risk here is expressed as 5:10 or 5.10 .You can spread these 5 chips out any way you like, but the goal of the risk is for a reward that is bigger than your initial investment. However, you could also lose your 5 and this will mean that you need to risk double as much in your next play to make up for your loss. Trading is no different, (except there is method to the madness other than sheer luck...)
Most market strategists and speculators agree that the ideal risk/reward ratio for their investments should not be less than 1:3, or three units of expected return for every one unit of additional risk. Take a look at this example: Here, you're risking the same amount that you could potentially gain. The Risk Reward ratio is 1, assuming you follow the exact prices for entry, TP and SL.
Can you see why this is not an ideal setup? If your risk/reward ratio is 1, it means you might as well not participate in the trade since your reward is the same as your risk. This is not an ideal trade setup. An ideal trade setup is a scenario where you can AT LEAST win 3x as much as what you are risking. For example:
Note that here, my ratio is now the ideal 2.59 (rounded off to 2.6 and then simplified it becomes 1:3). If you're wondering how I got to 1:3, I just divided 2.6 by 2, giving me 1 and 3.
Another way to express this visually:
In the first chart example I have a really large increase for the long position and you can't easily simplify 7.21 so; here's a visual to break down what that looks like:
If you are setting up your own trade, you can decide at what point you feel comfortable to set your stop loss. For example, you may feel that if the price drops by more than 10%, that's where you'll exit and try another trade. Or, you could decide that you'll take the odds and set your stop loss so that it only triggers if the price drops by 15%. The latter will naturally mean you are trading at higher risk because your risk of losing is much more. Seasoned analysts agree that you shouldn't have a value smaller than 5% for your stop loss, because this type of price action occurs often during a day. For crypto, I would say 10% because we all know that crypto markets are much more volatile than stock markets and even more so than commodity markets like Gold and Silver, which are the most stable.
Remember that your Risk/Reward ratio forms an important part of your trading strategy, which is only one of the steps in your risk management program. Dollar cost averaging is another helpfull way to further manage your risk. There are many more things to consider when thinking about risk management, but we'll dive into those in another post.

tick tick Btc is potentially heading for a massive support area short term. Wouldnt be surprised if we fill that whick and go range

BTC Hello, as we can see in the monthly Bitcoin timeline, Bitcoin was stuck in the resistance area of $106,593 from late 2024 to mid-2025. In the first half of 2025, this area was broken by a strong candle and has not been able to return to this area to this day, and the $106,593 area has become a strong support area.If Bitcoin can break the support zone below, Bitcoin’s next support will be $95,733. Otherwise, if it breaks the triangle, it could reach $150,000 by the end of the year.

Can BTC break the 111681$ resistance? | BTC 1H Analysis D2👋 Hey everyone! Hope you’re doing great! - ❤️ Welcome to Satoshi Frame .
📅 Today we’re diving into the 1-hour Bitcoin analysis. Stay tuned and follow along!
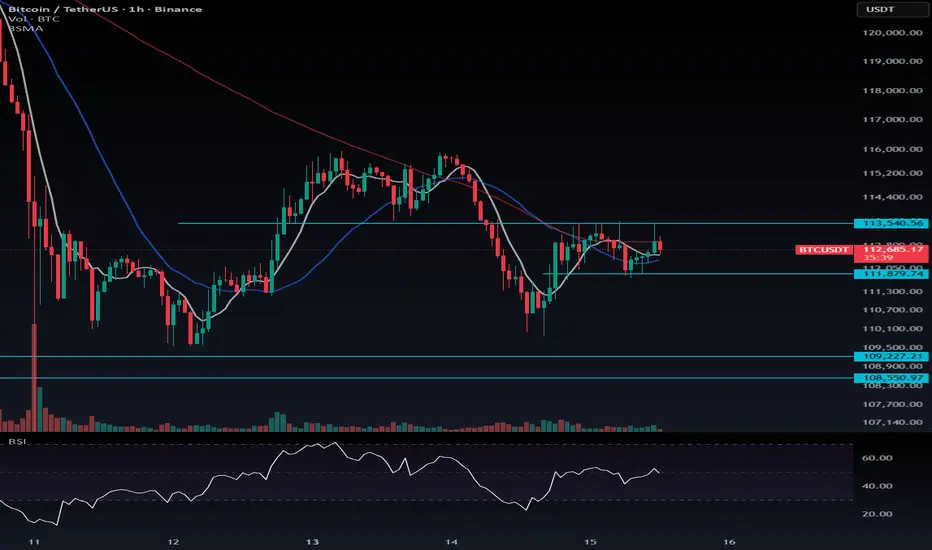
👀 On the 1-hour timeframe of Bitcoin (BTC), we can see that — similar to USDT.D — it is moving within a range box, but inversely positioned near a Maker Buyer support and a multi-timeframe Low at $111,681. A confirmed breakout above this zone could push Bitcoin upward toward the box midline.
🧮 Looking at the RSI oscillator, we can see that it’s currently oscillating between the Oversell (30) Low and the static ceiling around 53. A breakout beyond either of these boundaries would likely signal the start of Bitcoin’s next move.
🕯 Recent volume on Bitcoin has increased as it reached the Maker Buyer zone — strong buying pressure from market makers has helped defend this support level effectively. Right now, Bitcoin sits just below a resistance area that will require a significant uptick in buying volume to break and confirm stability above it.
🧠 For Bitcoin positioning, we can consider that this current Low is very strong and unlikely to break easily, so the main focus should remain on long positions:
🟢 Long Scenario: Once Bitcoin breaks the multi-timeframe resistance at $111,681, combined with RSI surpassing the 53 threshold and a visible increase in buying volume, a long position setup becomes valid.
🔴 Short Scenario: Since the Maker Buyer support is very strong and USDT.D has been repeatedly rejected at its top, it’s better to wait until the Maker Buyer zone breaks with a large whale candle before considering short setups.
❤️ Disclaimer : This analysis is purely based on my personal opinion and I only trade if the stated triggers are activated .

BTC Symmetry <Danger Zone>Considering the low shadow in Bitcoin, this upper zone is my entry area, and if I get confirmation, I’ll enter a sell position.
Symmetry will definitely occur — it’s just a matter of time, sooner or later.
864

BTC Short Term OverviewBased on structure and Daily TF view BTC has more probability to retest 109K before than 118K, in fact I dont even expect 117.3K but a sweep and rejection around there is a high supply zone for now, not only a resistance zone (previous July daily box range low) but we have an 4H Bear gap + Prev Month High, golden supply zone for shorts
Based on this type of 4H PA I expect at minimum the 50% of the wick on the 4H liquidity candle to be fill, around there we have the Daily/Weekly MSB and support zone within 109 and 107 so could see a consolidation before going lower if so, in fact we can consider the whole 4H candle to be a range for now, the open of that candle has liquidity and supply so Im expecting to respect it
*Key zones here is to fill the CME Gap (111K-110K GAP on BTC1!), totally expecting it to be filled
Bullish panoramas starts at a reclaim and Hold of 118K

BTCInstitutional Market Analysis – BTCUSDT
Over the recent sessions, the BTC market structure exhibited a classic set of liquidity-driven moves best identified and executed using advanced institutional order flow, liquidation, and open interest monitoring systems.
1. Pre-Move Context
Institutional positioning data showed pronounced capital outflows from exchanges and strong signs of large account accumulation, creating a diminishing liquidity environment on the downside. Real-time derivatives metrics indicated a balanced yet cautious market: funding rates and open interest were soft, signaling risk-off positioning and a high likelihood of a liquidity sweep event.
2. The Stop-Hunt & Liquidity Cascade
This thesis played out as price sharply swept the major support and liquidity cluster in the $109,500–110,000 zone. The move triggered a wave of forced liquidations among leveraged long accounts, clearing out weak positioning and drawing in aggressive late sellers. High-resolution flow monitoring confirmed that short positions entered during the flush were quickly neutralized as the market reversed.
3. Reversal and Aggressive Positioning
Immediately after the sweep, signature absorption flows appeared—evident from rising participation and open interest at key zones. Smart-lot execution and block order prints indicated institutional interests accumulating, setting the stage for a rapid reversal. The result was a pronounced recovery off the lows, with profit quickly being realized by those with optimal entries at the liquidity inflection point.
4. Short-Term Distribution & Mean Reversion
As price recovered toward the mid-range, order flow signals showed long participants reducing exposure while new short accounts entered near resistance. With most short interest exhausted at the higher bands and new entries clustering, a potential setup emerged for further upside acceleration if short covering persisted, especially on a break above $111,800–113,000. Profit-taking in the mid-range has so far induced mild retracement.
5. Technical Structure (4h View)
The current 4-hour chart reflects this entire process: after a disciplined liquidity sweep and reversal from structural demand, price is cycling between the lower support and historical supply around $113,000. Should current support continue to hold with firm absorption, the probability for continued mean reversion or an upward squeeze remains elevated. Breakdown confirmation would only arise with a new wave of forced liquidations and capitulation beneath current lows.
Summary Table
Phase Zone Institutional Flow Market Outcome
Stop-hunt $109,500–110,000 Liquidation spike, block absorption High-conviction long entries, reversal
Recovery/Squeeze $111,000–112,000 Short neutralization, OI rise Rapid bounce, shorts liquidated
Distribution/Profit $111,800–113,000 Reduced longs, new short clusters Consolidation or squeeze setup
Conclusion:
Recent price action has followed an institutional playbook—targeting liquidity, executing sweeping reversals, and exploiting passive and aggressive flows across the book. Continuously monitoring OI, flow delta, and structural liquidity remains critical for anticipating the next high-conviction trade as the market oscillates from one liquidity pocket to the next. This approach ensures entries and exits are based on where the largest players actually transact—not retail-driven indicators or price-only signals

109–114k range: sell the rips while 114k caps__________________________________________________________________________________
Market Overview
__________________________________________________________________________________
The market is digesting the deleveraging flush and stabilizing in a tight range below HTF supply, with an active demand shelf just underneath. The battleground sits at 113.5–114k, the hinge for the next directional leg.
Momentum: Range with a bearish tilt 📉 — price capped under 114–118k, buyers defending 109–110k.
Key levels:
• Resistances (HTF) : 113.5–114.0k (4H/12H/1D), 116–118k (1D/HTF), 124–126k (1D/1W).
• Supports (HTF) : 109.5–110.0k (2H–12H), 105–107k (12H/1D), 100k (1D/1W).
Volumes: Extreme on the 12H flush, now back to moderate/normal — no standalone reversal catalyst from volume.
Multi-timeframe signals: 1D/12H/6H/4H trending Down; intradays (2H–15m) mostly FLAT to mildly bearish. A clean 12H/1D reclaim ≥114k is needed to flip momentum.
Risk On / Risk Off Indicator: NEUTRE VENTE — confirms a defensive stance until a daily trend flip is confirmed.
__________________________________________________________________________________
Trading Playbook
__________________________________________________________________________________
Strategy: defensive trend below 114–116k — favor tactical sells on strength; only buy on confirmed signals.
Global bias: Cautiously bearish below 114k; key invalidation if 12H/1D close ≥114k with hold.
Opportunities:
• Breakout buy: Enter only after a 12H/1D close ≥114k + successful retest at 113.6–114.0k → target 116–118k.
• Tactical sell: Fade a 112.8–114.5k rejection with rising sell volume → target 111.0k then 109.5k/107.8k.
Risk zones / invalidations:
• A daily close ≥116k invalidates the near-term bearish bias.
• A decisive break ≤109k opens 107–105k via a liquidity sweep.
Macro catalysts (Twitter, Perplexity, news):
• Fed Beige Book: risk‑off tone (broad slowdown) — weighs on bounces.
• Geopolitics (US–China tensions, US shutdown risk): headline volatility.
• US spot‑ETF 7‑day inflows: supportive backdrop if 114k is reclaimed.
Action plan:
• Long (confirmed breakout): Entry 114.1–114.4k post‑retest; Stop 111.5k; TP1 116k, TP2 118k, TP3 121k; R/R ≈ 1.5–2.
• Short (fade strength): Entry 113.2–114.2k on confirmed rejection; Stop 116.0k; TP1 111.0k, TP2 109.5k, TP3 107.8k; R/R ≈ 1.8–2.2.
__________________________________________________________________________________
Multi-Timeframe Insights
__________________________________________________________________________________
Higher timeframes lean down while intraday coils inside the larger range.
1D/12H/6H/4H: Lower highs below 114–116k; 109.5–110k remains the active demand shelf. A sustained 12H/1D reclaim ≥114k would mark a true state change.
2H/1H/30m/15m: Intraday coil 110.0–112.8k; repeated failures near 113.0–114.0k. Highest quality trades remain fades into upper range unless volume expands on a breakout.
Major divergences/confluences: HTF bearish filters vs. positive 7‑day ETF flows — latent support, but not a trigger without the ≥114k signal.
__________________________________________________________________________________
Macro & On-Chain Drivers
__________________________________________________________________________________
Macro is mixed between risk‑off tone and still‑constructive institutional flows, keeping BTC in a transition phase.
Macro events:
• Fed Beige Book: broad slowdown — dampens near‑term risk appetite.
• US–China tensions and US shutdown risk: elevated headline volatility.
• Gold at record highs; oil headline‑driven — potential rotations, unconfirmed.
Bitcoin analysis:
• US spot‑ETF 7‑day inflows positive — medium‑term support, especially if 114k is reclaimed.
• Large OI purge: leverage cleaned up, enabling recovery if demand persists.
• Critical zones aligned: 114–118k supply; 109–110k/105–107k demand.
On-chain data:
• Funding reset, vol spike, ongoing LTH distribution — a “reset” not a cycle top.
Expected impact:
• While macro stays mixed and HTFs point down, expect 109–114k range behavior; a ≥114k reclaim + supportive flows would favor 116–118k.
__________________________________________________________________________________
Key Takeaways
__________________________________________________________________________________
BTC is compressing in a range under 114–118k with 109–110k still defended.
- Trend: neutral/bearish until a 12H/1D reclaim ≥114k.
- Key setup: clean breakout ≥114k toward 116–118k; alternatively, fade 112.8–114.5k or trade a <110k breakdown toward 107–105k.
- Macro: Fed Beige Book “risk‑off” vs. supportive 7‑day spot‑ETF flows.
Stay disciplined: wait for confirmation ≥114k for longs; sell rips while HTFs remain Down. 👀

2025 BTC TOP > ETH PUSHIf BTC tops and sets its first lower high around $119K and tags the 0.702 level, it could confirm the top. If ETH experiences extreme price appreciation into that move, it would validate the capital rotation, and once this move starts it could be over in 30 to 90 days. See my last post for this dynamic playing out during the last cycle.

2021 BTC TOP > ETH PUSHWhen BTC topped and set its first lower high it touched the 0.702 level at 59K and rolled over. ETH ran from about $2,100 to about $4,100, roughly a 2x move in about 30 days during that. I am looking for the same setup this cycle. See my next post.

Phemex Analysis #109: Where does Bitcoin (BTC) Go Next?!Last Friday—October 10, 2025— PHEMEX:BTCUSDT.P endured a historic flush. In a matter of hours, price slipped from the low-$120Ks into the low-$100Ks as leverage unwound across venues. It looked dramatic, but the post-mortem reads more like a broad‐based deleveraging than a structural failure. Since then, BTC has steadied around the low–$110Ks, with intraday swings as traders slowly rebuild risk.
Context in one breath.
A late-week macro wobble hit an over-levered market. Forced sellers did the rest. By mid-week, the tone shifted from “spiraling” to “stabilizing” as the market defended the $110K region and funding normalized.
Possible Paths From Here
1) Reclaim & Run — rebuild above $115K → $120–$123K retest
After flushing weak longs, BTC grinds higher, then reclaims $115K on improving spot demand. A strong daily close above $118K invites a retest of the $120–$123K band (pre-flush supply). A clean break there opens room toward $128–$130K.
Pro Tips:
Entry: Stagger in on a daily close > $115K; add on a confirmed reclaim of $118–$120K.
Risk: Initial stop below the reclaim zone (~$110.5K), then trail beneath higher lows.
Targets: $120–$123K first; if momentum broadens, stalk $128–$130K.
2) Chop & Rebuild — base between $108–$116K
The market digests the shock. BTC ranges $108–$116K, volatility compresses, open interest stays sober, and spot quietly absorbs supply. This is where patience—not prediction—wins.
Pro Tips:
Plan the box: Accumulate near $108–$110K, trim near $115–$116K; avoid mid-range chop.
Volume tells: Expansion at range edges often telegraphs the break direction.
Tools: Consider light grid/range tactics with clear invalidation below $108K.
3) Second-Leg Flush — lose $110K → $105K, even $100–$102K
If headlines sour or liquidity thins and BTC closes below $110K on heavy sell volume, $105K (prior liquidity pocket) is exposed. A disorderly tape can sweep toward $102–$100K before bargain hunters step in.
Pro Tips:
Defense first: Reduce exposure on a decisive daily close < $110K.
Wait for stabilization: Look for capitulation wicks + waning sell volume before redeploying near $105K / $102–$100K.
Flip criteria: A strong reclaim of $110–$112K with breadth is your cue to re-engage.
Conclusion
If BTC reclaims $115K and $118–$120K holds → ride the trend toward $123K, then $128–$130K.
If we range $108–$116K → harvest the box with tight risk.
If $110K snaps on heavy sell volume → stand aside and let $105K → $102–$100K stabilize.
Trade the levels. Respect the tape.
Let structure—not the memory of the flush—drive your decisions.
🔥 Tips:
Armed Your Trading Arsenal with advanced tools like multiple watchlists, basket orders, and real-time strategy adjustments at Phemex. Our USDT-based scaled orders give you precise control over your risk, while iceberg orders provide stealthy execution.
Disclaimer: This is NOT financial or investment advice. Please conduct your own research (DYOR). Phemex is not responsible, directly or indirectly, for any damage or loss incurred or claimed to be caused by or in association with the use of or reliance on any content, goods, or services mentioned in this article.

My analysis so far for BTCEven though I think that wick of destruction, isn’t valid. But it might help me to create a 5 wave pattern.

Never bet Bitcoin !The recent decision by Morgan Stanley, managing $8 trillion in assets, to allow its 16,000 financial advisors to recommend Bitcoin to all clients starting today marks a significant milestone in institutional adoption. Previously limited to high-net-worth clients with an aggressive risk profile, this opening now includes retirement accounts and conservative profiles, with a cap of 4% per portfolio. Although the immediate impact is tempered by mandatory 4-8 week training, projecting real inflows for December/Q1 2026, the market has already responded with a surge from $125k to ~$160k, fueled by FOMO and expectations of billions in investments.
In this context, future targets based on Fibonacci levels point to $170k (1.618), $200k (2.618) in the medium term, and $260k (4.236) in the long term (Q1 2026), depending on the momentum's sustainability. With the RSI ranging between 40.58 and 56.79, a drop below 50 after the peak suggests a healthy correction, offering entry opportunities, especially with accumulation signals.

BTC – The Wolf’s WhisperPrice is wandering near $110,800… calm before the hunt.
Soon, it’ll dip below $109,500 — not because it’s weak,
but because predators go low before they strike.
Liquidity hides there… and the market always feeds the hungry ones first.
After the sweep, expect the recoil —
BTC could surge toward $119,000–$120,000 before most even realize what happened.
🐺 If it closes below $109,000, that’s a different hunt entirely.
Until then, I wait in silence —
because the wolf never chases the herd.
He watches.
He calculates.
Then he takes what’s his.
#Bitcoin #BTC #Crypto #Cryptocurrency #BTCUSD #BitcoinAnalysis #CryptoAnalysis #BitcoinTrader #CryptoTrader #PriceAction #LiquidityGrab #SmartMoney #TradingPsychology #MarketStructure #TechnicalAnalysis #BTCForecast #AlphaMindset #SigmaWolf #LoneWolf #TheSigmaWolf #MindOfAWolf #WolfMindset #StayPatient #StayDangerous #FinancialFreedom

BTCUSDT – Technical Analysis (1H–4H)
Date: October 15, 2025
Time Horizon: 24–48 hours
🔹 1. Structural Overview
Bitcoin is showing a classic distribution phase after the sharp rebound.
A Head & Shoulders pattern has formed between $113,500–$115,900, alongside a double top near the same level — two separate but aligned bearish structures.
The market is now testing the neckline, and a break below this area could trigger a new downward impulse toward previous support zones.
🔹 2. Patterns and Signals
🧩 Head & Shoulders (1H)
Left shoulder: around $113,000
Head: top near $115,950
Right shoulder: about $113,500
Neckline: around $111,000 (yellow sloping trendline on the chart)
📉 Target on breakdown: $105,500–$106,000 (Fib 76.4% + previous intraday target).
This aligns with the low-volume node and VWAP bottom, marking strong technical support.
🧩 Double Top
Double top between $115,950 and $115,600 confirms a top structure and loss of buying momentum.
The “neckline” coincides with the H&S base — around $111,000, meaning a break here would confirm both patterns simultaneously, a strong bearish signal.
🔹 3. Key Levels
Support Zones (Buy Areas)
1️⃣ $111,000–$110,500 → neckline support (critical; a break = confirmed breakdown)
2️⃣ $108,500 → flush low and VWAP cluster
3️⃣ $106,000–$105,500 → main target if H&S completes
4️⃣ $101,000 → extreme low (Fib 100% + psychological level)
Resistance Zones (Sell Areas)
1️⃣ $113,500 → right shoulder / local top
2️⃣ $115,600–$115,950 → double top / previous liquidity zone
3️⃣ $118,000–$119,500 → macro resistance and pre-drop supply area
🔹 4. Momentum and Indicators
RSI (1H): around 40 → showing weakness, no overbought signals → room for further downside.
MACD (1H): still bearish, no bullish crossover yet → momentum remains down.
Stoch RSI (4H): in the lower zone but without a clear reversal → possible short pause before another leg down.
ADX (4H): 42–45 → trend remains strong, no sign of losing momentum.
➡️ Overall, the indicators confirm a bearish pattern with strong trend continuation, though small bounces may occur.
🔹 5. Volume and Market Structure
Volume Profile: highest around $113K–$114K (right shoulder area) where sellers dominate.
Volume below neckline is still light → suggests the market is waiting for confirmation before the next major move.
Open Interest: stable after the recent flush → market may be ready for another move without excessive positioning noise.
🔹 6. Scenarios
📉 Scenario 1 – H&S Breakdown (Most Likely)
Break below $111,000 → activates the pattern.
Target: $105,500–$106,000 (Fib 76.4% + prior trendline support).
RSI likely to drop below 35 once confirmed.
Volume confirmation: at least +15–20% increase during breakdown.
📈 Scenario 2 – False Breakdown and Rebound
If buyers defend $111,000 and push back above $113,500, a short-term short squeeze toward $115K is possible.
Could occur if macro news or sentiment improves.
🔹 7. Conclusion
BTC currently shows two bearish formations (H&S + Double Top), with $111,000 acting as the critical pivot level.
A confirmed breakdown below this line will likely trigger a strong move toward $106K–$105K.
Short-term bias: 🔻 Bearish
Mid-term (24–48h): 🔻 Downside toward $108K–$106K most probable
Bullish only if price breaks and holds above $113,500.

Bitcoin (BTCUSD) Technical Analysis – October 2025:Bitcoin just hit an ATH above $125K, and now it’s consolidating in a tight pennant pattern! This TradingView chart breaks down key levels and signals for traders. Here’s what’s cooking:
🔑Key Levels
- Support: $106K-$102K (strong demand zone, backed by 1W MA50)
- Resistance: $126K (near-term target), $138K (Q4 projection)
- Pattern: Bullish pennant forming post-ATH breakout
🔍 Indicators:
- RSI (H4): Oversold bounce, signaling buy opportunity
- MACD: Bullish crossover on daily, hinting at momentum
- Volume: Rising institutional inflows ($10B+ ETF AUM)
📅 Date: October 15, 2025
💬 What’s your take on BTC’s next move? Drop your thoughts below and let’s discuss! Follow for more crypto TA updates.
#Bitcoin #BTCUSD #TechnicalAnalysis #TradingView #CryptoTrading #PricePrediction #October2025

Bitcoin Faces Key Liquidity Levels — High Volatility ExpectedWith a break below the $113,726–$113,893 range, over $400 million in long positions could be liquidated.
Additionally, a break of $111,548 could trigger another $252 million in liquidations.
You can consider taking positions around these levels, but keep in mind — volatility is likely to spike sharply once these liquidity zones are tested.
While Bitcoin did manage to bounce from $111,879 with increasing volume, I personally don’t like the structure of the recent candles. For now, I’m staying on the sidelines, avoiding both long and short entries until the market shows clearer direction.
Sometimes, patience is also a position.
Forecast for BTCUSDT 15th October 2026 (Updated)Next swing move for bottoming of BTCUSDT before the final parabolic move.

Forecast for BTCUSDT 15th October 2026 (Updated)Next two swing moves for bottoming of BTCUSDT before the final parabolic move.

Bitcoin plummeted as US-China tensions escalated again.
The world's two largest economies continued their battle over key industries related to defense and national security.
Washington and Beijing renewed their battle on Tuesday after China decided to sanction five US subsidiaries of Hanwha Ocean, a South Korean shipbuilder, for alleged ties to the US government. Hanwha's stock price plummeted 8% on the news, while Bitcoin fell 4% before recovering in the afternoon.
(China accuses Hanwha Marine, a South Korean shipbuilding company, of assisting the US in a Section 301 investigation / Hanwha Marine)
A formal announcement from China's Ministry of Commerce stated: "In response to the US's Section 301 investigation measures against China's marine, logistics, and shipbuilding sectors... we hereby announce the imposition of countermeasures against five subsidiaries of the US-related Hanwha Marine Co., Ltd., effective October 14, 2025."
Section 301 of US trade law allows the government to respond to unfair trade practices. The US alleges that China is secretly engaging in unfair activities aimed at dominating the marine, shipbuilding, and logistics industries. Beijing has been accused of subsidizing these industries and even employing "forced technology transfer" to "reinvent technology."
The United States subsequently imposed service fees and tariffs of up to 150% on Chinese marine products. Beijing retaliated with higher service fees and, today, sanctioned Hanwha's US subsidiary, accusing it of assisting Washington's investigation.
"A Google Translated version of the official Chinese announcement states: 'The US Section 301 investigations and measures against China's marine, logistics, and shipbuilding industries seriously violate international law,' and 'Hanwha Marine's US subsidiary assisted and supported the US government's investigation, endangering our country's sovereignty, security, and development interests.'"
Bitcoin and Hanwha stock weren't the only assets affected by the news. The broader cryptocurrency market fell 2%, and stocks experienced some volatility following the announcement, but subsequently recovered. However, the Nasdaq remained down 0.18% at press time.
At the time of writing, it was trading at $112,334.40, having earlier plummeted to $110,029.49 following the Chinese announcement. The cryptocurrency is down 7.55% this week, despite having risen as high as $116,020.49 since Monday.
FAQ ⚡
Why is Bitcoin down today?
Bitcoin fell over 4% after China announced sanctions against a subsidiary of South Korea's Hanwha Ocean, which has ties to the US.
What sparked the US-China dispute?
Washington imposed steep Section 301 tariffs on China's marine industry, prompting Beijing to retaliate.
How severe was the market reaction?
The overall cryptocurrency market fell around 2%, with Bitcoin briefly dipping to $110,000 before recovering somewhat.
What is Section 301?
It's a US trade law that allows tariffs to be imposed on countries accused of unfair or coercive trade practices.

BTCUSDT.P — C-Wave Short Setup/EntryTL;DR:
Bear HVN rejection, momentum rollover, C-leg targets 111 k–110 k.
Short bias intact while under 113.5 k.
⸻
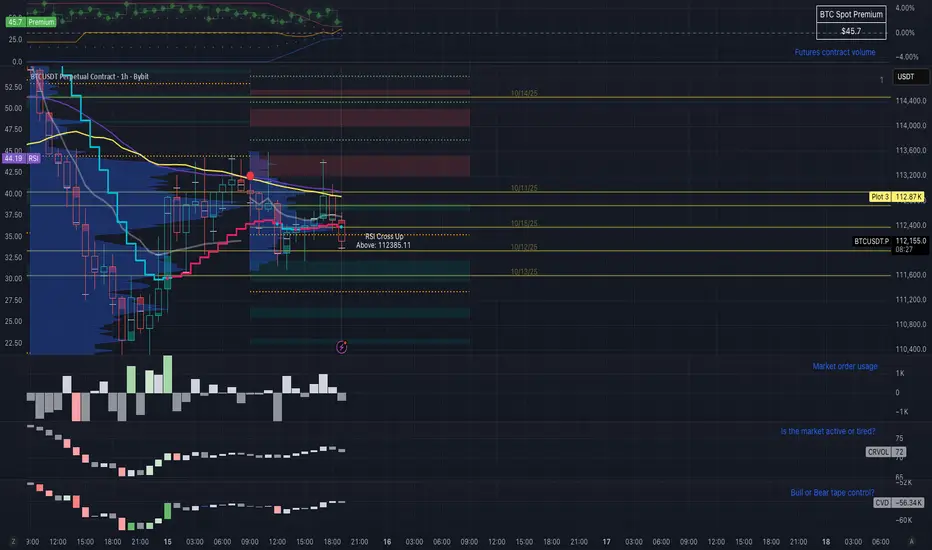
🩻 Market Logic
This is a C-leg continuation play within a corrective structure, trading momentum + order-flow confluence:
• CVD down + CRVOL flat = liquidity fade.
• RSI breakdown = momentum confirmation.
• HVN rejection = structural trigger.
If 113.6 k gets reclaimed on strong volume → thesis invalidated; above that, next play is the L-BOR toward 116 k – 122 k.
After the liquidation flush and retrace, BTC printed a textbook A–B–C corrective structure inside the larger wave-5 on hourly charts.
The B-wave retraced ~0.93 of the prior drop — deep enough to trap late longs but shallow enough to preserve bearish symmetry.
🧠 Technical Context
• 1H HVN: 113.1k zone acting as supply shelf.
• RSI (10m): rolled under 50 → momentum shift confirmed.
• CVD: still negative (~–55k) — buyers not reclaiming control.
• CRVOL: >1.1× → active but fading = exhaustion, not expansion.
• Fib projections (C-wave):
• 1.0 × target → 111.55k
• 1.618 × extension → 110.38k
⚙️ Execution Plan
• Short Entry: 112.9 k – 113.2 k (bear HVN underside)
• Stop: 113.6 k (above 1 h wick)
• Targets:
• TP1 = 111.55 k
• TP2 = 110.38 k
• TP3 = 109.8 k (full C-leg completion)
• Bias: Bearish until hourly close > 113.48 k
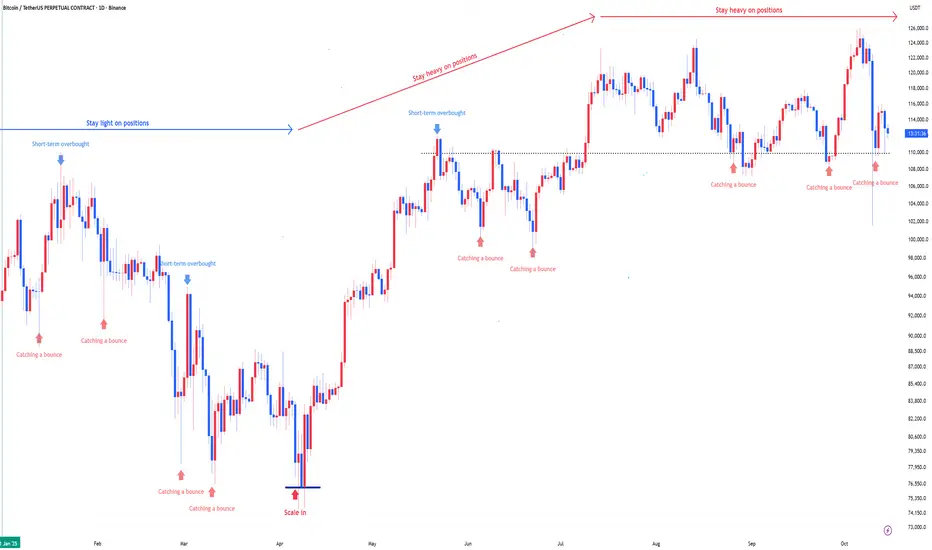
Bitcoin : Stay heavy on positionsBitcoin : Stay heavy on positions (3x)
Maintaining the same outlook as before.
** This analysis is based solely on the quantification of crowd psychology.
It does not incorporate price action, trading volume, or macroeconomic indicators.