BTC market snapshotIn a few hours, there will be a pre-recorded speech by Jerome Powell, which means some people already know what he’s going to say.
There could be volatility since expectations are high. His speech won’t directly announce the interest rate decision, but even a hint will be enough to trigger panic in the current situation.
I’m holding a short.
BTCDOWNUSDT trade ideas

BTC Technicals Point to Strong Bullish Setup at $112K SupportLooking at this weekly CRYPTOCAP:BTC chart, you can see Bitcoin has been consistently holding above the 50 EMA, acting as solid support each time it retraces back to it. The key point to note here is how the price has tested this zone multiple times, forming a strong area of confluence. Each time, Bitcoin has successfully bounced, showing a solid structure to keep the uptrend intact.
At this moment, Bitcoin is facing resistance around $126,000, but the market looks strong, especially with the EMA holding as support. If the price breaks this resistance, we could be in for another leg up towards higher targets. The price action here indicates that bulls are in control, and the current setup suggests there's a good chance we might see more upside soon, especially if the zone around $112,000 holds as support.
Keep an eye on the key levels: if BTC holds above the 50 EMA and the confluence zone, the next push could be significant.
DYOR, NFA
#PEACE

Long BTC at 121,300Pullback to 117,500 could be cut short with a bounce off the 50EMA on the 30mins
Long Entry - 121,300
SL - 120,000
TP - 145,000

Is the #BTC rally over? Can 120k hold?📊 Is the #BTC rally over? Can 120k hold?
🧠From a structural perspective, we've established a bearish structure after hitting a new all-time high. This structure targets 118,500-120,377. The neckline support zone is also nearby, so consider monitoring the support strength here to identify potential long trades.
➡️After the uptrend support line was broken, we're currently testing the yellow support zone. Therefore, shorting here is not recommended. Instead, consider looking for long positions in anticipation of a rebound.
🤜If you like my analysis, please like 💖 and share 💬
BITGET:BTCUSDT.P

$BTC BULL CHARGE AHEAD!!CRYPTOCAP:BTC Saw its biggest liquidation event in its entire history.
Has already bounced off 10% from the bottom.
Defended multiple supports on the closing basis.
This looks good for 125k$ again and then 132k$ as long as 105k$ gets defended.
Bigger and better moves are yet to come

BTC 1H Analysis - Key Triggers Ahead | Day 53☃️ Welcome to the cryptos winter , I hope you’ve started your day well.
❤️ I sincerely apologize to everyone in the channel — I’ve been down with a cold for several days. Now, let’s dive into the 1-hour Bitcoin analysis.
⏰ We’re analyzing BTC on the 1-Hour timeframe .
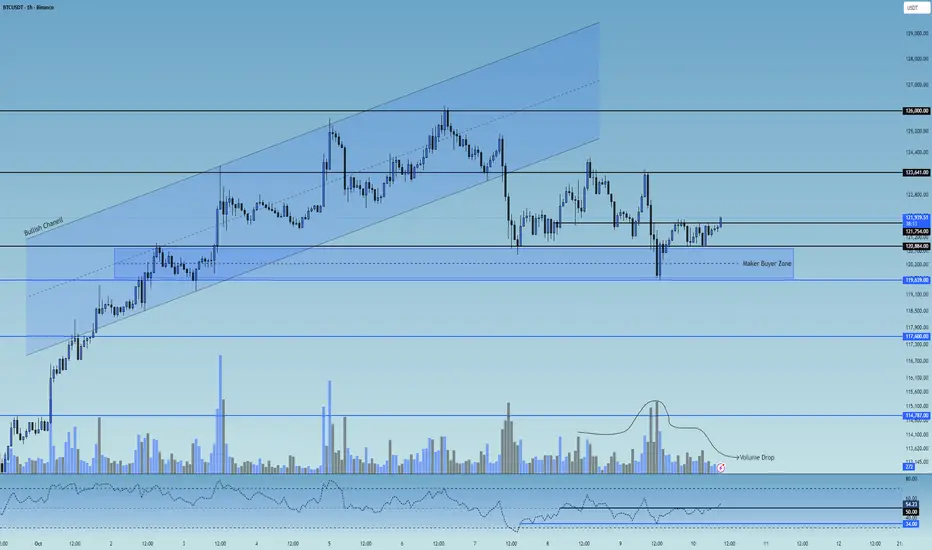
👀 In the 1-hour timeframe, after a strong bullish rally, Bitcoin broke below its ascending channel and moved toward the $121,000 support zone. From there, increased buying volume pushed the price upward, but it got rejected from the $123,600 resistance** and pulled back, creating a long trigger at that zone.
As it moved toward lower support levels, it formed a micro buyer zone between $119,640 and $120,884, where each time price enters this zone, Bitcoin experiences noticeable buying pressure.
🧮 Looking at the RSI oscillator, after ranging below the 50 level, it’s now trying to break above it. The 50 level has become a **strong static resistance, while there’s swing support near 34.
If the RSI breaks out of these marked zones, it could trigger stronger volatility and expand both **short and long trading opportunities.
🕯 The size and volume of recent candles on the 1-hour chart show range-bound movement, weak momentum, and market indecision, forming a **multi-timeframe trading range** where the top and bottom boundaries act as trigger zones.
The **micro buyer zone is where buyers aggressively defend price through market orders, preventing further downside — a reversal candle forming inside this zone is a strong example of that.
▶️ **Today’s economic news related to U.S. monetary policy can impact the market significantly. Since Bitcoin is currently in a small trading range, upcoming volatility spikes from the news could provide short-term setups.
↗️ Risky Long Scenario:
Look for a breakout above the marked $121,754 zone, accompanied by an engulfing candle, **indecision signal, SMA-7 confirmation, and increasing volume in the direction of the breakout — especially if the news comes out risk-on (positive for markets).
📉 Very Risky Short Scenario:
If price breaks below the micro buyer zone and loses the swing RSI support near 33, Bitcoin could enter a deeper correction.
However, note that a drop in Bitcoin’s price often increases its attractiveness compared to other assets, so avoid rushing into shorts.
❤️ Disclaimer : This analysis is purely based on my personal opinion and I only trade if the stated triggers are activated .
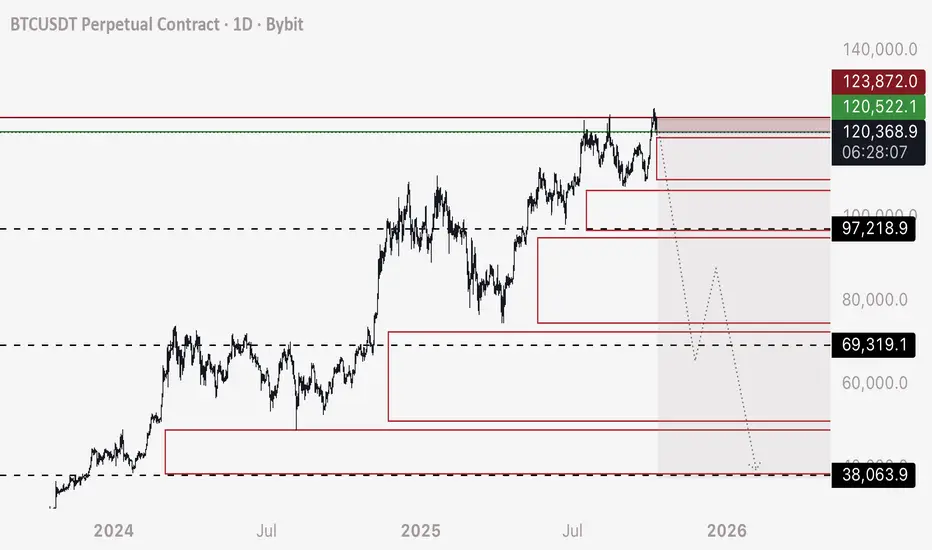
BTC - Short a Stop Hunt and Stay on the Right SideI’m breaking my larger idea down into multiple trades, now that others are opening up to the reality that it’s possible.
These order blocks shown are filled with long position stop losses, leveraged sell orders that only fill when price crosses over - and will set off like a chain reaction.
This will create a very fast drop IE Stop Hunt - and we can take advantage of it.
TRADE 1 - SHORT
Entry - 120,200 to 120,500
Stop Loss - 123,800 (although I don’t see Bitcoin rising back above 121,000 before this trade completes)
Target 1 - 97,250 (Close 25% of trade)
Target 2 - 69,400 (Close 50% of trade)
Target 3 - 38,100 (Close 40-90% of trade as it’s possible we continue to drop and don’t retrace from here to 90,000 appx)
I’ll be logging this trade.
All the best and buckle in.
- DD
Don't worry.I can reminde previous wave that happened in the pervous cycle . Thats seems me the last movment dosent happen yet
BTC WILL NOT BE THERE🪙 CRYPTOCAP:BTC October 10th 😅 Straddle breakevens:
118000 & 127000
🪙 CRYPTOCAP:BTC October 17th 😅 Straddle breakevens:
116000 & 130000
σ Sigma probabilities:
October 10th
| σ | Multiplier × 😅 | Probability
| 1σ | 117000 & 128000 | ≈68%
| 2σ | 112000 & 133000 | ≈95%
October 17th
| σ | Multiplier × 😅 | Probability
| 1σ | 114000 & 131000 | ≈68%
| 2σ | 106000 & 139000 | ≈95%

BTC/USD ANALYSISBitcoin is currently sitting in a strong demand zone, a beautiful area that could trigger a new ATH (All-Time High).
According to my analysis, we’re now in the final wave of wave 5 in the Elliott Wave structure.
This phase could mark the end of the bullish cycle, with one last strong push to a new high before a major correction takes place.
🎯 Likely scenario:
Short to mid-term bullish continuation
New ATH possible from this zone
Then a significant drop once wave 5 completes
🕰️ Patience and risk management — the last wave often traps the market.

BTCUSDT – When the U.S.–China Trade War Fills Bitcoin’s SailsTrade tensions have resurfaced after U.S. President Donald Trump announced a 100% tariff on Chinese exports. The renewed fear of a trade war has pushed investors toward decentralized assets like gold and Bitcoin as a hedge against uncertainty. While the USD saw a slight uptick, the risk-off sentiment has driven capital into BTC — now viewed as a modern safe-haven asset.
On the daily chart, BTC continues to maintain its bullish structure within a broad ascending channel that has been in place since June. After a sharp drop to the $108,000 support zone, strong buying pressure quickly stepped in, forming a long-tailed candle — a clear sign that the bulls are still in control. If the price holds above $110,000, BTC is likely to extend its recovery toward the next major resistance around $128,000 in the coming weeks.

Symmetry <Danger Zones>BTC follow Symmetry
just wait for entry signal
Price symmetry refers to comparing the size of past and current price movements to identify balance or repeating patterns.
It assumes that the market tends to make similar upward and downward moves in terms of price distance (such as wave length or correction size).
Analysts measure previous price swings and compare them with the current move to identify potential reversal or continuation points.

BTC is in Showing a Weakness COINBASE:BTCUSD CRYPTO:BTCUSD BINANCE:BTCUSD OKX:BTCUSD KRAKEN:BTCUSD CRYPTO:BTCUSD BINANCEUS:BTCUSD BINANCE:BTCUSDT BINANCE:BTCUSDT.P BYBIT:BTCUSDT.P BYBIT:BTCUSD.P OKX:BTCUSDT.P MEXC:BTCUSDT.P BITGET:BTCUSDT.P BINANCE:BTCUSD.P DELTAIN:BTCUSD.P BINGX:BTCUSDT.P BITMEX:BTCUSD.P BITMEX:BTCUSD.P DERIBIT:BTCUSD.P KRAKEN:BTCUSD.P BYBIT:BTCUSDC.P WEEX:BTCUSDT.P KRAKEN:BTCUSD.PM BINGX:BTCUSDC.P BINANCE:BCHUSDT.P
🧭 Overall Context
Time Frame-Daily
Price recently failed to sustain above the $120K zone and dropped sharply, indicating exhaustion at higher levels. The current structure suggests BTC is at a critical inflection point — either to find support and resume the uptrend, or to confirm a deeper correction.
🟩 Key Levels Identified
Zone Type Level Comment
Last Attempt (Supply Zone) $119,789 – $118,362 Strong rejection area — where the last bullish attempt failed. This is now a confirmed supply/resistance zone.
Major Resistance $116,710 Secondary ceiling — breakdown confirmation level if retested and rejected.
Current Support Zone $114,624 – $110,129 Immediate support area. Price is hovering here — holding this zone = potential short-term bounce.
Critical Break Level $107,328 If broken, bearish continuation likely. Marks the boundary between range and potential deeper correction.
New Low Target Zone $87,513 – $82,743 Key demand area if correction deepens. Historically high liquidity and prior structure base.
Major Low $74,485 Extreme bearish target — long-term accumulation area if BTC enters deep retracement mode.
📉 Bearish Case (Downside Scenario)
If BTC breaks and closes below $107,328, it signals:
Breakdown of the medium-term structure.
Momentum likely shifts toward $87,500 → $82,700 region.
Below that, the final macro support lies at $74,500, aligning with the previous cycle’s higher low.
Indicators confirming bearish bias:
Strong rejection wicks near $120K zone.
Sequential lower highs forming since the top.
Trading Implication:
➡️ Short-term bias: Sell rallies below $116K.
➡️ Medium-term bias: Bearish continuation under $107K.
➡️ Target zones: $87K – $82K – $74K.
📈 Bullish Case (Recovery Scenario)
For bulls to regain control:
BTC must defend $110K zone and push above $116K – $118K.
A daily close above $119,800 reopens path to $126K and beyond.
Signs of bullish continuation:
Bullish engulfing candles forming around $110K zone.
Volume confirmation and reclaim of $116K resistance.
Possible retest of $126K “high liquidity” zone.
Trading Implication:
➡️ Short-term bias: Buy dips near $110K with tight stop below $107K.
➡️ Target zones: $118K → $126K.
➡️ Invalidation: Breakdown below $107K.
🧩 Structural Interpretation
Current structure = Range between $110K and $119K.
The breakdown candle shows institutional rejection — likely distribution near the highs.
Price may consolidate before the next impulsive leg.
If support holds → sideways-to-up; if breaks → sharp continuation down.
🕯️ Market Psychology
Above $120K: Euphoria / final push of the upcycle.
Current ($110K): Hope and uncertainty — participants deciding if this is a dip or start of decline.
Below $107K: Fear and capitulation → could trigger larger retracement.
📊 Summary Table
Bias Key Confirmation Target Notes
Bullish Reclaim $118K $126K Needs strength & volume
Neutral/Range Between $110K–$118K — Wait for breakout
Bearish Break below $107K $87K → $82K → $74K Momentum continuation
🎯 Final Take
BTC is at a pivot zone ($110K area) — the next few daily candles will confirm whether this becomes:
a re-accumulation (for another push to $126K+), or
a distribution top (leading to deeper retracement).
📌 Plan of Action:
Watch $107K closely → if broken, prepare for a move to $87K.
Reclaim $118K → signals bulls back in control.
Use $114K – $110K as immediate reaction zone for short-term scalps or entries.

BTC - Short - 3 Wave Correction Bitcoin Short signal with a lower entry for those that didn’t catch the last top.
3 simple targets.
Entry - 111,900-112,000
Stop Loss - 116,400
Target 1 - 85,000
Target 2 - 36,000
Target 3 - 10,000
Buckle in.
- DD

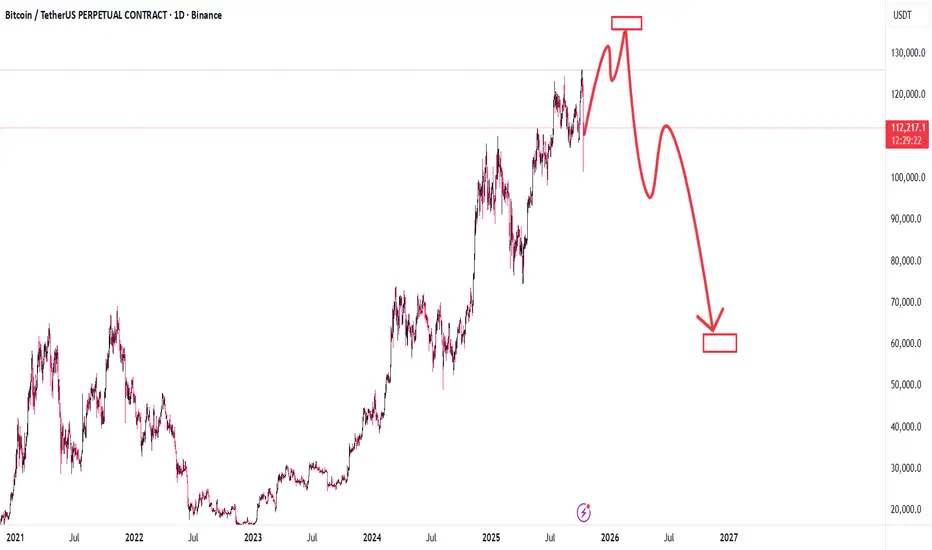
11/10/2025 BITCOIN On Going Ending Of Cycle 🔹 Market Outlook & Personal Warning
I’m seeing the end of a diagonal wave for this current cycle.
Don’t FOMO just because another big piece of news is coming out.
To avoid long-term risks that may be hard to handle,
I strongly suggest those who have already made a decent profit
to start scaling out gradually and reduce exposure.
In my view, the $131,000 – $144,000 range could mark the final ATH of this cycle.
After that, we might enter a major correction phase toward $40,000 —
it may sound impossible to some, but time will tell,
regardless of how positive the current fundamentals may appear.
Some may think I’m crazy or overly cautious — and that’s fine.
I’ve been through two full BTC cycles since 2017,
and I sincerely hope you won’t experience what many did back then.
This post may trigger mixed reactions,
but I have no personal gain from sharing this outlook.
I’m simply offering a friendly warning
to help others avoid potential massive losses before it’s too late.
Stay safe, stay rational —
Good luck to everyone out there.

BTCUSD NEXT POSSIBLE MOVE Bitcoin is consolidating near a strong support zone, showing signs of accumulation. If the price continues to respect this area, a bullish move can be expected ahead.
Structure remains positive as long as price holds above support — buyers may soon take control.

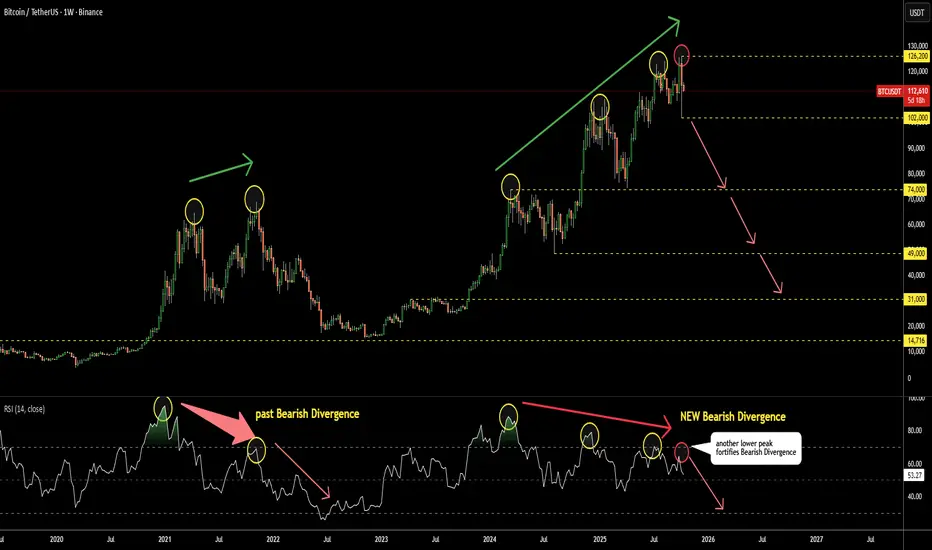
Bitcoin Update: Bearish Divergence on RSI Only Deepens This is a brief update to the analysis shared in August. The RSI has now formed a fourth consecutive lower peak on the weekly chart, further confirming the bearish divergence.
Monitor the RSI closely — a break below 50 (currently at 53) could signal the onset of a bear market.
The first key support level is near 102K, and a decisive move below this level would strengthen the bearish outlook.
BTC USD reversal BTC showing sign of reversal entry TS on a higher time frame , but and wil be a risky trade so entering on a lower quantity

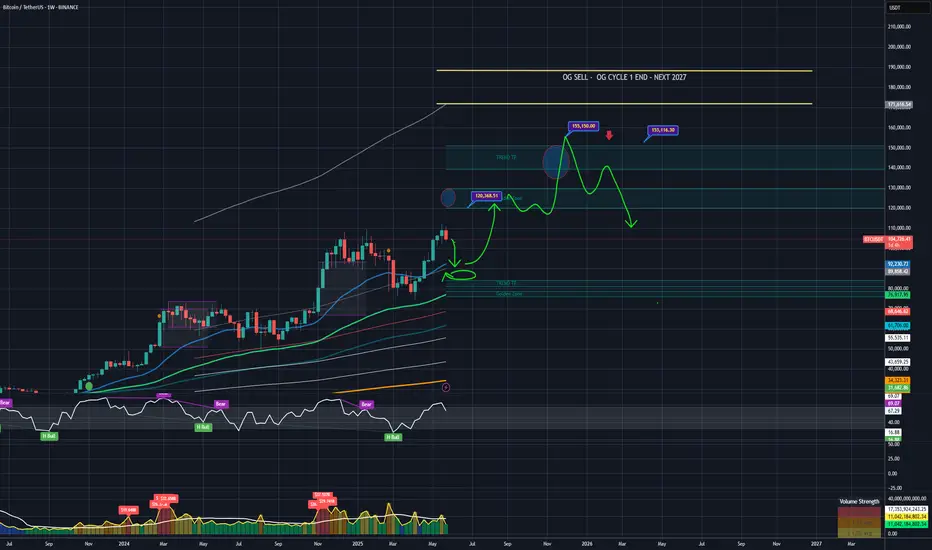
OG CYCLES - NOV 2025 - 2026 FEBOG CYCLE 1 - 132 300 - 155 200 / 2025 NOV - 2026 FEB
OG CYCLE 2 - 250 000 - 302 300 / 2027 Last cycle / Focus BTC only
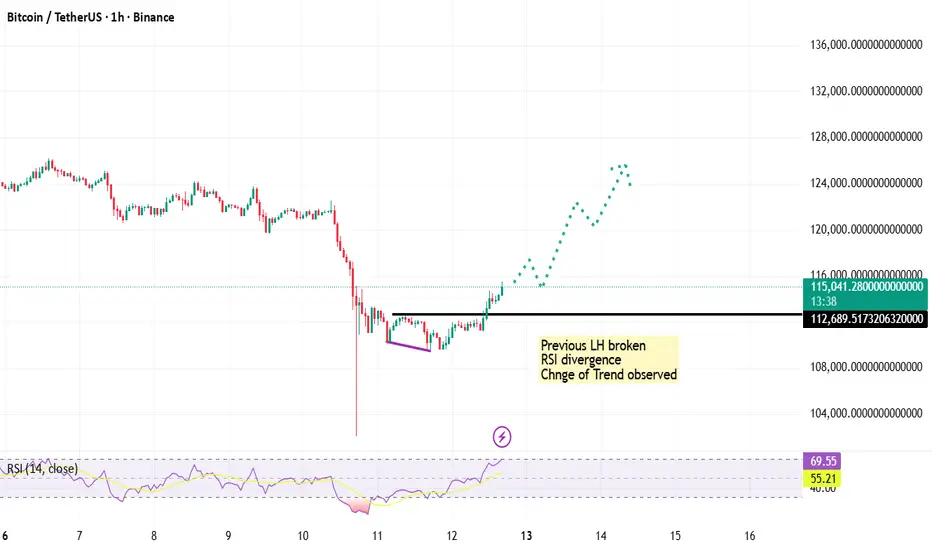
BTCUSDT – Shift in Structure Signals Bullish MomentumBTCUSDT is displaying a clear shift in market structure after a prolonged corrective phase. The recent formation of a Higher Low (HL) followed by a break to the upside indicates that sellers are losing control and buyers are gradually stepping back in. According to Dow Theory, the emergence of consecutive Higher Highs (HH) and Higher Lows confirms a trend reversal—and BTC is currently aligning with that structure.
The RSI has recovered strongly from oversold levels without showing any bearish divergence, which further validates bullish strength rather than signaling exhaustion. With price reclaiming previous resistance levels and converting them into support, momentum appears to be building for a potential continuation move. As long as price sustains above the recent Higher Low, BTCUSDT is poised to print new HHs, supporting a bullish outlook for the sessions ahead.
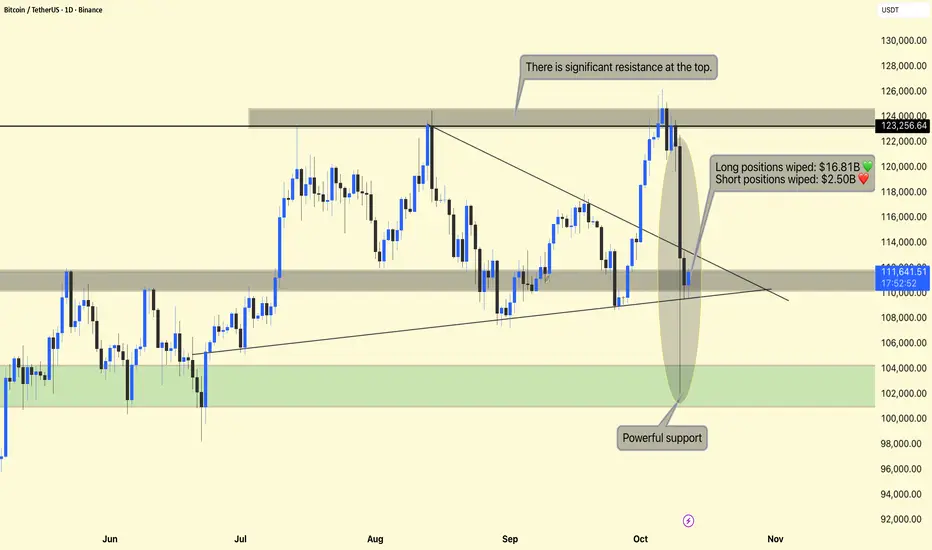
Bitcoin (BTC/USDT) – Daily Chart Analysis !!Bitcoin (BTC/USDT)
The chart shows a sharp correction from the $124,000 resistance zone, followed by a major liquidation event that wiped out:
Long positions: $16.81B
Short positions: $2.50B
This represents one of the most volatile 24-hour periods in recent months — aligning with the Fear & Greed Index drop to Extreme Fear (24).
$123,000 – $124,000 Major Resistance Strong supply area — multiple rejections in past rallies.
$111,000 – $110,000 Current Support Zone Price is currently consolidating here after the crash.
$102,000 – $104,000 Powerful Support Historical accumulation zone — where buyers previously stepped in aggressively.
Resistance Rejection
At the top of the range ($123,000–$124,000), BTC encountered heavy resistance, triggering large-scale profit-taking and the liquidation of overleveraged long positions.
This area has acted as a strong rejection zone several times since August, indicating sellers are defending it aggressively.
Breakdown and Liquidations
After the breakdown of the descending triangle, cascading liquidations forced a steep drop.
This led to a high-volume candle (highlighted area) where:
Liquidity was cleared both above and below key support levels.
Market sentiment flipped rapidly from Greed → Extreme Fear.
This kind of liquidation sweep often signals a short-term capitulation — a flush before possible recovery.
Support & Market Structure
Price bounced from near $110,000, a previous structure support level.
If BTC maintains above $110,000, it may attempt to stabilize and retest mid-range resistance around $115,000–$116,000.
However, if price breaks below $110,000, we could see a retest of the $102,000–$104,000 demand zone, which is marked as “Powerful Support” — a key area where long-term buyers might re-enter.
DYOR | NFA
BITCOIN !!!Hello friends
Given the good decline we had, a good opportunity was provided to buy at good prices with capital and risk management and in steps and move to the specified goals.
There was good liquidity at the bottom that was collected, now we can expect a good growth.
*Trade safely with us*

BITCOIN BTCUSDTThe bitcoin daily loss is pat of trading strategy,gain and losses is what comes with trading any instrument.
Macroeconomic Jitters Intensify Crypto Volatility as Global risk sentiment turned sharply negative after the U.S. announced new 100% tariffs on Chinese tech imports, reigniting fears of a prolonged trade conflict.
the current crypto downturn reflects a complex mix of macroeconomic headwinds, leveraged liquidations, and cooling sentiment after record-breaking highs.
key demand floor is 100,067 break and close sell into next demand structure.
#bitcoin #btc
