BTC/USD – Bullish Reversal from 15m Order BlockPrice is currently reacting from a key bullish order block after forming a clear CHoCH near the strong low, suggesting potential accumulation and bullish intent. As long as the order block holds, buyers may drive price toward higher liquidity areas.
Buy Entry: 104,900 – 105,100
Targets:
TP1: 106,400
TP2: 107,200
Invalidation: Break below 104,700
Trade ideas

Crypto might still have gas in the tankAn equal-weight basket of popular cryptos is forming a descending wedge (bullish) on the 4 hour chart.
There's also a very mild uptick in momentum.
I wouldn't take excessive risk here, potentially add on dips to cryptos you have strong conviction on, and don't be surprised if we really are at the end of the cycle.

November 11 Bitcoin Bybit chart analysisHello
It's a Bitcoin Guide.
If you "follow"
You can receive real-time movement paths and comment notifications on major sections.
If my analysis was helpful,
Please click the booster button at the bottom.
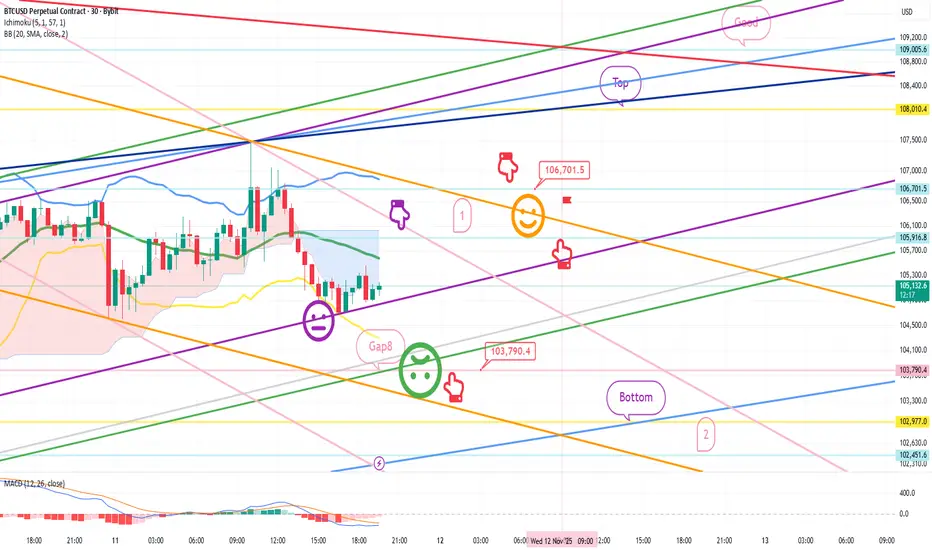
This is a Bitcoin 30-minute chart.
There are no separate Nasdaq indicators.
I developed a strategy based on the lower gap retracement of both Bitcoin and Nasdaq.
*Conditional long position strategy when the red finger moves
1. Confirm the first touch of the purple finger at the top (autonomous short)
Switch to a long position at the bottom at $103,790.4 /
Stop-loss price if the green support line is completely broken or the bottom is touched
2. First target for a long position at $106,701.5 / Target prices are Top and Good in that order.
If the strategy is successful, the first section is used to re-enter the long position.
If a correction occurs immediately without touching the first section at the top,
I'll wait for a long position at the bottom. Looking at the overall picture today, if the price drops to the bottom,
the medium-term pattern will be broken.
The purple support line must be maintained or the upper limit must be reached at 106.7K.
A rebound in the 1+4 range is required without breaking the green support line.
The Nasdaq variable is important, so please keep a close eye on the movement.
I hope you operate safely, with principled trading and stop-loss orders essential.
Thank you.

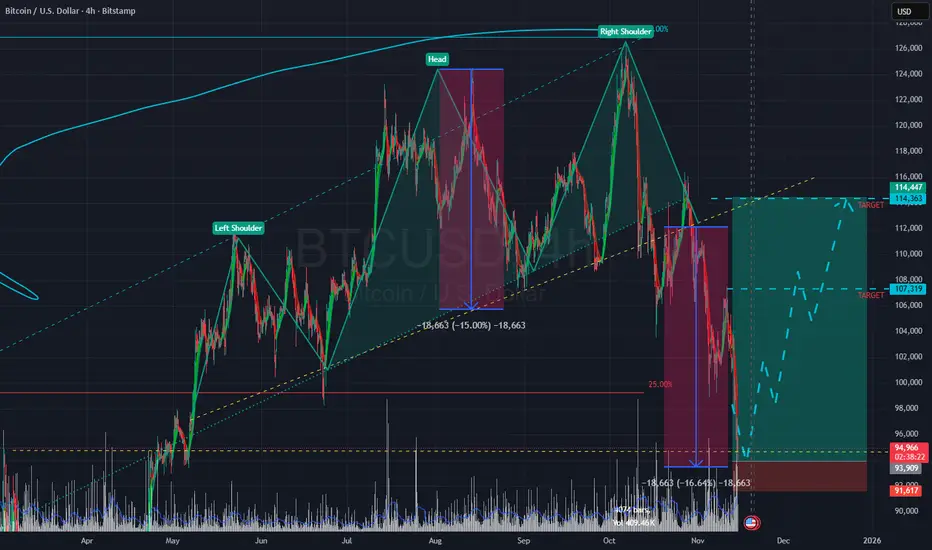
#BTC Local bottomBias: 1st and most of all we have the SHS target Reached!
2nd multiple support levels, Fibonacci window for uptrend, third wave complete from last ATH.
Long position for couple weeks to 2 targets.
RR 1:9
Target 1 close 50% of position
Target 2 close
SL 91617$
BTC/USD – Eyes on the Double Bottom ReversalAfter weeks of consolidation and a sharp dip that shook out weak hands, IG:BITCOIN appears to be setting up for its next major leg higher. The 4-hour chart reveals a textbook double bottom formation, a pattern that often marks the end of a correction and the beginning of a fresh uptrend.
The Setup
Following Bitcoin's rejection from the $126K zone in early November, we witnessed a measured retracement that found support near the $98K-$100K level. This crucial support zone has now been tested twice, forming two distinct lows that create the foundation of our double bottom pattern. The neckline, sitting around $104.6K, has been breached with conviction, suggesting buyers have regained control.
What makes this setup particularly compelling is the measured move target. By projecting the formation height from the breakout level, we arrive at a first target around $111.5K—conveniently aligned with the 0.618 Fibonacci retracement level. This confluence adds weight to the bullish thesis.
The risk-reward here is attractive. With a stop loss positioned just below the recent swing low at $101K, roughly a 3:1 reward-to-risk ratio.
The Path Forward
If IG:BITCOIN maintains support above the neckline and current price action, the path of least resistance appears to be upward. The measured move projection suggests we could see a structured advance through the $108K-$111K zone in the coming sessions. Beyond the immediate target, the chart hints at even more ambitious levels, with the all-time high region at $126K coming back into focus if momentum continues.
Of course, IG:BITCOIN doesn't move in straight lines. Expect consolidation phases and potential retests of the neckline as support. The key is whether buyers continue to defend the $104K-$105K zone on any pullbacks.
📝 TL;DR
Bitcoin has formed a double bottom pattern after testing $98K-$100K support twice. The neckline breakout at $104.6K targets $111.5K, offering an attractive risk-reward setup. Invalidation occurs below $101K.
---
Invalidation: A sustained break and 4H close below $101K would negate the bullish structure and suggest the correction may extend lower toward the $98K support zone.
---
*Note: This analysis is for educational purposes. Always conduct your own research and manage risk appropriately.*

SELL BTCUSDPrimary bias: Bearish retracement expected.
Next move: Short-term fake-out or range compression → drop to $101,700 support.
Risk note: This structure is a pullback within a larger bullish trend; short may be counter-trend if higher timeframe remains bullish.

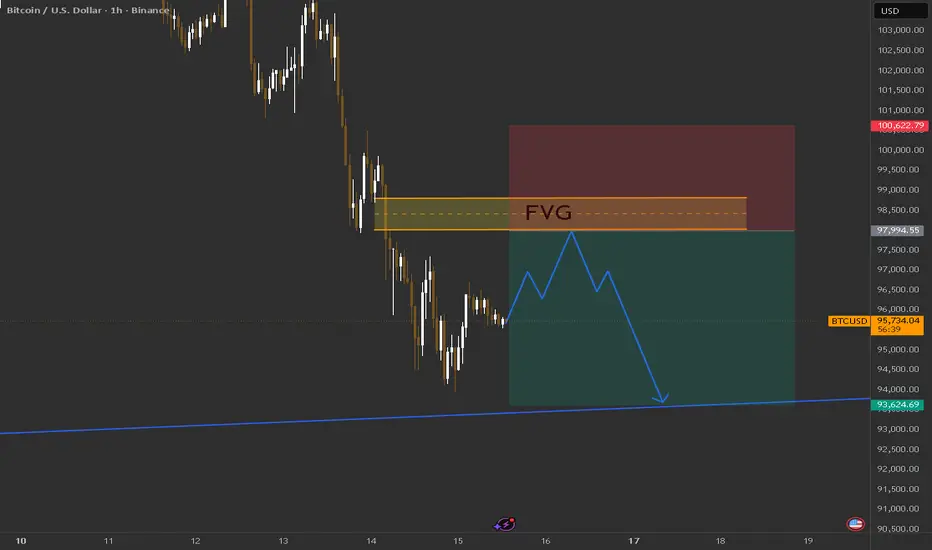
FVG on the hourly time frameBTC pumps on the weekends and dumps during the week, so this is the most valid scenario to happen
BTC . Liquidity SweepWhen we look at BTC CRYPTO:BTCUSD right now, many people thought the $100,000 area was strong support. It looked heavy and it looked important. But it was only a minor zone.
It was a liquidity trap.
Market makers used it to sweep stops. So I expect BTC to drop toward $84,500 to $85,000. That is where the major zone shows up.
So the first thing you do is mark the major zone.
Do not FOMO!!!
You gotta wait for price to move into the major zone. That is the true entry. This keeps you from entering too early.
Your limit buy sits at the top of the major zone. Not on the minor one.
Your stop-loss sits below the major zone, and Your target can be the previous highs or two times the risk or it could be higher (to me it gonna be $240,000).
Definding Liquidity levels and Demand Zone help you remove fake signals. It gives cleaner entries.
For me, BTC is still moving toward $240,000 this cycle. Big corrections often make the trend stronger.
They let the market clear weak positions, and they give clean setups for traders who wait for the right zone.
TheCryptoFire

BTC: More pain to follow, Sell at 103-104k for a 81k targetBTC broke its 14 months long trend line on weekly charts. Such a long running trend line, when broken, almost always gets retested, so there is going to be a jump to 103-104k levels in next 3 days.
The price action is slow and complex which is a typical wave 4 sign, so we definitely have ATH pending in this cycle which we can reach by February 2026. For now, we will bottom at 81k mark where the ABC correction should complete. For investors with a 3-4 months investment horizon, I would reccomend to wait and not chase the rally until the weekly close ending on 23rd Nov closes about the broken trend line.
Be patient for the market correction to complete, December rally is very much on the cards.

BTC SidewaysBTC is in a distribution phase for a while now.
Sideways for the rest of the year.
My average selling price is ~103.000$.
It was a nice ride.
I am out of this! ✌

BTCUSD 45m – Pennant Breakout Setup Toward 100k Target1. Pattern Formation: Bullish Pennant
The chart shows a pennant, formed after a sharp downward move followed by price compression.
The upper trendline is descending, the lower trendline ascending, converging into a tightening triangle.
This is typically a continuation pattern, but because the preceding move was downward, traders will often wait for confirmation from the breakout direction.
2. Breakout Attempt
The price is breaking slightly above the upper trendline, marked as ENTRY.
This suggests a potential bullish breakout, but:
The breakout candle is still small.
Ideally, you’d want volume confirmation (not shown in the image).
3. Stop-Loss Placement
The STOP LOSS is placed safely under:
The lower pennant trendline
Recent consolidation lows
This gives a logical invalidation level—if price drops below this, the breakout has failed.
4. Target Projection
The target of $100,006 is consistent with a measured move calculation:
Height of the initial impulse (the pole)
Added to the breakout point
On your chart, the projected move equals about +10%, also labeled on the right.
5. Risk–Reward
The setup shows good R:R, since:
Stop-loss is close
Target is distant
However, pennants can generate fakeouts, so caution is warranted.
6. Market Context (from the chart only)
Current price around $95,984.
The overall trend in the 45-minute view appears mixed:
Strong drop earlier
Stabilization
Compression
The breakout direction will determine the next phase.

BTC FOLLOW UP MONTHLY BEARISHI see, most likely, these escenario to play out for the next 3-4 months.
NOTE: Sice the Monthly is bearish, is not doing a new alltime hight these year ...
Not legal advice, the escenario may not play as showing here.
Play safe...

BTCUSDMaybe another bull trap.
Based on market sentiment, catastrophe is not yet...
Before a ledge, the market must be complacent...
As far as I can tell, right now, it's fear.

BTC scenario3 Elliot waves showing the same idea, i separated them to make it clear for you. we are bouncing and dumping through strong zones. btc likes to go down

Last Cycle Push - Incoming Breakout?If BTC maintains above the 50 moving average on the weekly, then we should be looking for a final push to the upside to end the bullish cycle. We are given a falling wedge formation in the daily timeframe. There is also plenty of room for development on the oscillators.

BTC – $95K Flip Could Send Us to $85KHey traders 👋
Bitcoin is setting up a technical retest after breaking below the $95K zone.
Let’s go through the current structure on the daily chart and discuss possible next moves.
🔍 Technical Overview
After topping out near $105K, BTC has broken structure to the downside, forming a clear lower high → lower low pattern.
The recent drop through $94.5K – $95K flipped that zone into a fresh resistance level (previous support now turned supply).
Price is currently consolidating under that area — a textbook setup for a bearish retest before continuation lower.
📊 Volume Insight
Selling volume has been increasing on every major red candle since early November — confirming momentum-driven selling.
The most recent green candles show lighter volume, suggesting a relief bounce rather than genuine accumulation.
Unless buyers step in with volume above previous sell bars, rallies into the $95K–$96.5K zone are likely to fail.
🧱 Key Levels to Watch
ZoneBiasComment$96.5K – $95KResistanceRetest zone (short area)$93KMinor supportTemporary bounce possible$88.5KFirst targetMeasured-move completion$85KMajor supportNext liquidity pocket below
🔻 Bearish Scenario (Primary Plan)
Price rejects the $95K zone → confirms lower high.
Entry trigger: rejection wick / engulfing candle below $94.5K.
Targets:
TP1: $88.5K
TP2: $85K
Stop-loss: above $96.9K (invalidates short structure).
🟢 Bullish Invalidations
If BTC closes above $96.9K with expanding volume, that would signal absorption of supply and could trigger a squeeze back toward $100K–$105K.
Until then, the trend remains bearish-to-neutral.
🧠 Summary
Structure: Bearish channel / retest in progress
Bias: Short below $95K
Volume: Sellers still in control
Next supports: $88.5K and $85K
💬 Community
What’s your plan for this setup?
Do you think the $85K zone will hold, or is this just the start of a larger macro correction?
Drop your thoughts below 👇
If you find this analysis useful, hit 👍, follow, and share — I post BTC updates and high-volume trading setups weekly. 🚀
🏷️ Hashtags
#Bitcoin #BTCUSD #BTC #CryptoAnalysis #PriceAction #VolumeProfile #TradingView #CryptoTrading
Would you like me to make a shorter, punchier version for social sharing (for example, Twitter or the TradingView “Short Ideas” feed)? That helps with engagement and follower growth too.

BTC/USD major support breakdown selling strongBTC/USD Market Outlook – 1H Timeframe
Bitcoin is currently showing strong downside momentum, with price breaking down from recent consolidation and failing to hold key support levels. The market structure continues to favor sellers.
📉 Short Position
Entry: 98,100
🎯 Technical Target (Support): 95,800
The trend remains bearish as long as BTC trades below the breakdown zone. Monitor price action closely and adjust positions according to market volatility.
⚠️ Always use proper risk management.
This is not financial advice.
👍 Like, Follow, Comment & Share

BTCUSD Rejected its Daily Support and Ready For FlyHello Traders
In This Chart BTCUSD HOURLY Forex Forecast By FOREX PLANET
today BTCUSD analysis 👆
🟢This Chart includes_ BTCUSD market update)
🟢What is The Next Opportunity on BTCUSD Market
🟢how to Enter to the Valid Entry With Assurance Profit
This CHART is For Trader's that Want to Improve Their Technical Analysis Skills and Their Trading By Understanding How To Analyze The Market Using Multiple Timeframes and Understanding The Bigger Picture on the Charts

Fin du Shutdown ! Que faire sur l'Or et le Bitcoin ? Hello everyone and welcome to this market analysis! We'll be taking a look at Bitcoin and Gold, but more importantly, I'll explain why the market corrected so sharply this past weekend.
Anyway, have a great week everyone and happy trading! Feel free to share your thoughts in the comments.

BTCUSD – Current Market Analysis
BTCUSD – Current Market Analysis
Date: 15 November 2025
Time: 2:50 PM (GMT+6)
---
Trend Direction
On the higher timeframe (1D and 4H), BTCUSD is still maintaining a clear bearish trend structure.
The market is consistently forming lower highs and lower lows, confirming a continuous downtrend.
On the 4H chart, multiple downside BOS structures have formed, and price is currently very close to the 94,000 weak low region.
This indicates that the market is still interested in collecting liquidity toward the downside.
On the intraday timeframes (1H and 15M), price is strongly rejecting from the 96,400–96,600 supply zone.
This rejection adds further strength to short-term bearish pressure.
Higher timeframe is bearish and the intraday structure is also bearish—so the overall direction remains to the downside.
---
Technical Analysis
The major supply zones are 96,400–96,800, 99,000–100,000, and 102,000–103,000.
These zones have previously shown strong seller activity and can produce reactions again.
The major demand zones are 94,200–94,800 and 93,800–94,000.
Below 94,000, there is an additional liquidity pool which the market may sweep before showing a bounce.
Price is currently under pressure below 95,800 after rejecting from the 96,400 supply zone.
This confirms seller dominance.
---
Smart Money Concept (SMC)
Based on SMC structure, BTCUSD remains bearish:
There are multiple BOS structures to the downside.
The 96,400–96,600 region has shown CHoCH and mitigation signals.
From 95,800, price has already begun a continuation to the downside.
The weak low at 94,000 acts as a liquidity target.
According to SMC, the most probable move is a sweep of 94,000 liquidity followed by a pullback or a bullish correction.
---
Fibonacci Analysis
Using the recent swing high at 102,500 and swing low at 94,000:
0.382 retracement → 96,200
0.500 retracement → 97,200
0.618 retracement → 98,300
Current price is moving within 96,000–96,400, which aligns with the 0.382 level and the intraday supply zone.
This indicates that the pullback is complete and the rejection is valid.
---
RSI Analysis
On the 4H chart, RSI has moved slightly up from the oversold zone but remains bearish in momentum.
On the 1H chart, bearish divergence appeared near the supply zone.
On the 15M chart, RSI is showing falling momentum, which strongly signals continuation to the downside.
---
Volume Analysis
Volume is higher in downside candles, confirming seller dominance.
Volume is lower during pullbacks, indicating weak buying pressure.
A strong volume spike is expected once the market taps into the 94,000 liquidity zone.
---
Fundamental Analysis
The Dollar Index (DXY) is currently strong, creating negative pressure on the crypto market.
ETF inflows have slowed down, and overall market fear is elevated.
As risk assets remain under pressure, BTC continues to face short-term bearish sentiment.
---
High-Accuracy Trading Plan (95% Accuracy)
(Price levels in English)
---
Short-Term Sell Setup
The ideal sell zone is 96,200–96,600.
This zone aligns with the supply area and the Fibonacci 0.382 retracement level, where strong rejection is already confirmed.
Stop loss should be placed above 97,000.
Take profit targets are 95,200 → 94,800 → 94,200.
---
Pullback Buy Setup (Safer Buy)
This setup becomes active only after the market sweeps liquidity below 94,000.
The buy zone is 94,000–94,300.
Stop loss should be placed at 93,400.
Take profit targets are 95,200 → 96,200 → 97,200.
---
Final Summary
BTCUSD is clearly in a bearish trend.
After rejecting from the 96,400 supply zone, the market has resumed its downside continuation.
Trend, Technicals, SMC, Fibonacci, RSI, and Volume—all point to bearish movement.
The most probable scenario is that BTCUSD sweeps the 94,000 liquidity before initiating a meaningful pullback.

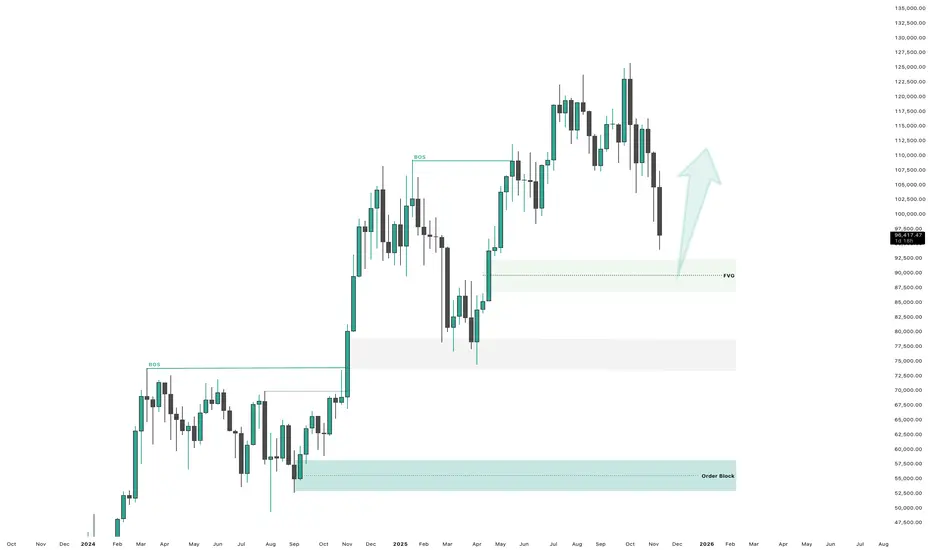
BTC pulling back into Weekly FVG Price is close at weekly Fair Value Gap, a zone where buyers previously stepped in with strong momentum.
Now the question is… will Bitcoin bounce from here again?
Key Weekly FVG: 90,000 – 95,000 zone
Structure still bullish unless this zone breaks.
What do you guys think — bounce from here or deeper correction?
Bitcoin long: Alternate Bullish Count (wave 3 up)Here I talk about the bullish alternate count for bitcoin. The stop will be the bottom of alt wave C and Bitcoin will make new all-time high.
