UptrendUptrend with ascending peaks and troughs.
In this trend, stock price trends in upward directions by making series of higher high and higher lows
BTCETH.P trade ideas

Relative Strength Index on Crypto ETHBTCThe green circles in the RSI are indicating overbought, that means the price should go down. On the other hand, the red circles indicates the coin is oversold, meaning that the price should start to go up again. This indicator works when the price is oscillating.

ETH BTCETH BTC pair is breaking out the downtrend line major resistance. The falling wedge also broken in upward direction. If ETH BTC able to hold above this resistance line then we see good upside move in coming days. Altcoins will follow ETH and we may see some positive move soon.
#ETH BTC

ETHBTC bounceI found this well respected ETHBTC pitchfork with ETH currently bouncing from the bottom of the fork. While BTC is ranging, I'd look for a move up to the midpoint (with .618 confluence) and potentially the high line of the pitchfork.

#ETH/BTC SELL TRADE SCENARIO.Hello, Traders here is a full analysis of #ETH/BTC Soon Price Dropping and Hit Our Target. Thank you Traders for your support like and follow.

ETHBTC SCALP BUYwww.tradingview.com [/url
as you can see form our chart, BTC has been gain all the attention with respect to eth. I think its a good time to scalp buy

ETH/BTCBitcoin tracks $39K ahead of Europe vote on Proof-of-Work legality.
News like this have the tendency to trigger the market on buy but yet everything is just on spot

ETHBTC Wait for the right place to buy!!!ETHBTC
When I traveled to the future I saw the ETHEREUM movement and that was the movement.
TRUST

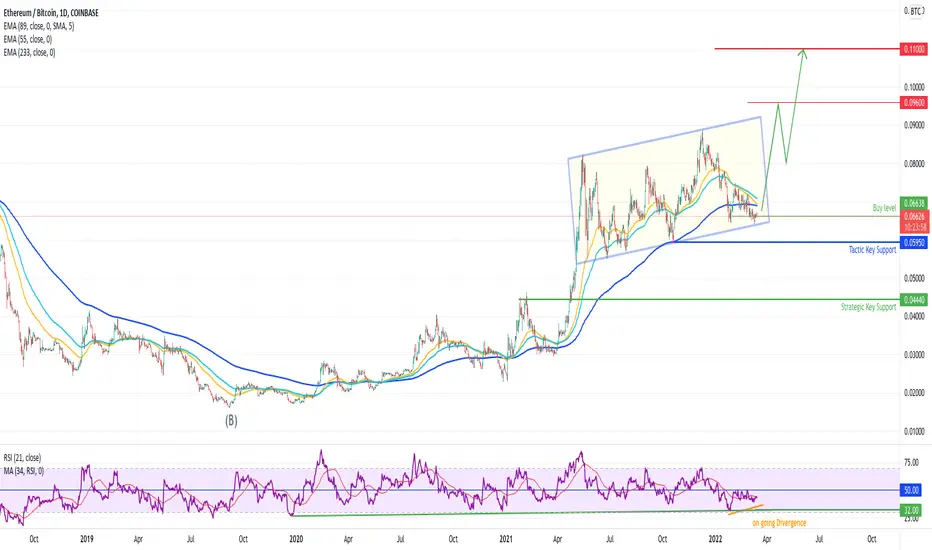
ETH/BTC at lower part of the range (Buy setup)ETH/BTC at lower part of the range (Buy setup)
Context :
Etherum is evolving wit h a clear outperfomance versus Bitcoin since the end of 2019. This ETH outperformance trend is since the last past 9 month in a pause within an ascending range (Yellow). Regarding the wave structure composing the ascending range we can conclude that the pattern is now or about to be finished and show an opportunity to catch a new significant bullish dynamic by anticipating a bullish breakout from this structure and at least a test of the previous top area in a common part scenario (Last upside leg before consolidation)
+> NEws flow : More and more article are speaking about ETHV2 , it is more than probable that ETHV2 will be full operational one day but many people into blockchain tend to say it will not be for this year maybe.... So take care... buy the news yes but the technologie can take time to be released. Also Many regulation and supervisor are banning the POW mecanism in oreder to eraze the consequence of the mining so we can't ignore that ETHV2 will be not operational before a ban of the POW from many juridiction..... (Time to check HBAR : Hedera Hashgraph which offer a significant alternative in this context)
Key Elements:
- lower part of the ascending range is support
- 233EMA is support whil the shorter period are mixed (Range config)
- an ongoing divergence on RSI can be highlighted (bearish momentum exhaution)
- Fibonacci multi level at 0,0595
Tactical View 3 to 9 Weeks
Last upside leg - As long as 0,0595 adjust the weight of the ETH and BTC in the portfolio in order to reduce the BTC exposure.
ETH/BTC M15ETH/BTC M15 while waiting for it to respect the trend you can either set buy limit or wait to buy at the market price 15 minutes shows a clear paten as price drops.

Ethbtc crossing resistance is huge!... note the price channel Ethbtc crossing resistance is huge!... note the price channel

ETHBTC bull flagPotential breakout on ETHBTC pair in progress. I favor the blue scenario but in case it fails red scenario can be followed for the dips. Target should be previous highs.
We also have another structure on higher time frame which is depicted below. Hidden bullish divergence on both daily and the weekly chart looks positive for the moment.
Enjoy!

ETHBTC WELL SUITED FOR A BULL as you can see from my identified descending trendline channel for ETNBTC , we are in an important key level any any break in price above the black line will indicate a strong bullish continuation will follow. see you at the top
TP1 0.071467 btc per eth
tp2 0.076 btc per eth
tp3 0.088 btc per eth

Victor Cobra's Crypto market Update 3.10.22 In this video, I first talk a little bit about my recent experience day trading during the chop. I talk about LUNA, BTC, and ETH as well. I also touch a bit on traditional markets. That's it for this week. I am putting together an email list per request from viewers, so please reach out if you would like to be added.
This is not meant as financial advice. This is just me sharing my experience, and it is meant for speculation and entertainment only.
-Victor Cobra

Something I Noticed on ETHBTC Angles can be drawn between two earlier top points and two latter top points that have arisen in the recent bull move
They are very similar in structure just on different scales

One More Leg Down📥 Expect a One More Down To The 62000 Sat Level As a Wave C PRZ
👉 Etherem / Bitcoin Chart Will Show us Next Move Of The Alts Market ,So At The Moment It’s Better To Stay Away From The Alts
