BITCOIN Year EndMax pain ahead as expectations have not been reached by retail investors. Once the year ends and expectations die, Bitcoin will make it's final push higher.
130K by February.
Trade ideas

BTC/USD: Testing Key Support (M/FVG) After Strong DowntrendKey Observations
Downtrend: The price has been moving lower, defined by the downward-sloping black trendline, indicating a period of bearish momentum.
Break of Structure (BOS): A "BOS" (Break of Structure) label is placed below a recent low, confirming the continuation of the bearish structure as the price moved lower.
Current Support Zone: The price is currently testing a significant support zone (the grey rectangular box) around the $96,000 - $98,500 area. This level appears to be a historical reaction zone.
Market Structure/Fair Value Gap (M/FVG): The support zone is also labeled as "M / FVG" (Likely Mitigation or Market Structure combined with a Fair Value Gap), suggesting this area holds significance for potential institutional/smart-money activity.
Future Scenarios (Projected Paths):
Scenario 1 (Black Arrow): The main projected path shows a potential bounce/reversal from the current support zone, aiming to push the price higher. This suggests a buy/long opportunity might be imminent if the support holds.
Scenario 2 (Curved Arrow): The alternative (and often less-likely, as it's secondary) projection suggests a continuation of the downtrend after a potential minor bounce or consolidation, indicating a break below the support zone and further declines.

BTC likely to close below $100,000k this week.We are nearing the buy zone on the weekly BTC chart. I expect strong support in the low to mid 90K range. I will be stacking buys once we see a close below the Nadaraya–Watson envelope shown by the dotted lines. It appears as if BTC may be getting exhausted on a longer timeframe as you see the envelope begin to level which often indicates a downturn on shorter time frames. I expect BTC to return to at least $115,000 within the next 3 months or so. We will evaluate price action to see how to position at that time.

BTC Bullish ScenarioFollowing up on my BTC bearish scenario , price has come down as expected and is looking to establish a base.
So far price has managed to stay within the channel respecting the macro bullish trend.
Still bullish until price fails to hold this channel.
A bullish scenario would be price retracing and planting a HL respecting the bullish trend.
Fib time gives me the end of 1st week of December for a low to be planted and should price maintain the channel (give or take a wick on 4 hr below), then I would expect price to push up to test the top of the descending channel potentially looking for a breakout.

BTC/USD 1D Chart🧭 Overall Market Picture
Bitcoin is in a medium-term downtrend, as confirmed by:
a descending channel (marked with white lines),
lower highs and lower lows,
price below the key EMA and SMA.
The price is currently testing the upper boundary of this channel, so it will be crucial whether it manages to break out of it to the upside or rebounds further down.
🔹 Key Price Levels
Support:
$100,650 — short-term support, previously seen price reactions.
$98,550 — next demand level from late October.
$96,950 — lower boundary of the descending channel, potential target for continued declines.
Resistance:
$106,300–$106,500 — current resistance (upper boundary of the channel + SMA100).
$109,700–$110,000 — strong resistance converging with the EMA200 and SMA200.
$112,000+ — channel breakout and trend change.
🔸 Technical Indicators
1. MACD
The histogram is starting to turn positive (descending red).
The MACD line is attempting to cross the signal from below — a potential bullish signal, but not yet confirmed.
➡️ Indicates a possible short-term upward correction within a downtrend.
2. RSI (14)
Value: ~40.5 — low, but has rebounded from oversold levels.
No bullish divergence, but the RSI is rising from below, suggesting a potential technical bounce.
➡️ Still more upside than downside before entering the overbought zone.
🔹 Moving Averages
EMA50 (~109,970 USD) and EMA200 (~110,380 USD) are above the price, confirming the downtrend.
The EMA50 < EMA200 cross holds – a classic death cross.
SMA100 (~106,300 USD) has just been tested – a key level that could determine the direction of the coming days.
🔸 Short-Term Scenarios
🟩 Bullish (30–40% chance)
Breakthrough of the upper channel line (~106.5k USD) + daily close above 107k USD.
Confirmation of the MACD and RSI signal > 50.
Targets: 109,700 → 111,500 → 113,800 USD.
➡️ A medium-term trend reversal is then possible.
🟥 Bearish (60–70% chance)
Bounce from the upper channel line and fall below 102k–101k.
Continuation of the downtrend.
Targets: 100,600 → 98,500 → 96,900 USD.
➡️ In this scenario, the market will maintain a lower high/lower low structure.
⚙️ Summary
Trend: Down, but with a short-term rebound attempt.
Key moment: reaction to the 106k–107k USD level.
If the channel with volume breaks, a bullish reversal.
If a rebound, a new low around 97k–99k USD is very possible.

$BTCUSD: targets for pullbackBITSTAMP:BTCUSD : looks like the up wave completed and reached the target of $107K mentioned in an earlier post, although it didn't touch the trendline.
It appears to me that this pullback is Wave 5 -- the very last leg of this correction. Wave 3 usually exceed Wave 3 (i.e., making a new local low), however, Wave 5 can truncate (i.e., not making a new local low).
If the correction completed at the prior low of $98.9K, then the pullback is Wave 2 of a new uptrend. Then it is likely to end between 50% retracement and 61.8% retracement. If this is Wave 5 to complete the entire correction, then it should go to at least 78.6% retracement (if truncated) and possibly touch the green trendline (if not truncated).
My trading plan: I sold some IBIT shares during the overnight market. However, most of my IBIT are held in accounts that don't have overnight access so I'm still holding the majority of my shares. My plan is to hold through this pullback because if this is Wave 2, it should resume the uptrend pretty soon.

Ready to LONG BTCUSD?In the 4H chart, you can see clearly that the bullish pattern has formed and broke out of the resistance line at 104,073 price level. Of course, the best entry price was below 100k mark, the psychological level.
The next best thing is not to beat yourself up for not getting in at the lowest price but participate in the trend is more important, imo.
As usual, please DYODD

BTC watch $104.2k then 105.5: Major fibs that may END the BounceThis is a follow-up to my Big Picture Idea below.
We have a decent bounce after piercing 100k round
Now approaching a couple of major fibs for resistance.
Rejection from either fib could send us to new lows.
$104,235.02 is a Golden from Covid bottom
$105,451.85 is a SemiMajor Genesis fib
$ 97,769.44 is a minor Genesis and target.
.
Big Picture calling for 97.8k:

BTCUSD Buying entry on breakout of resistance area 96,300BTC/USD Analysis – Breakout Outlook
Bitcoin is showing strong bullish momentum, and I’m watching for a breakout above 96,300 to confirm a potential long setup.
Technical Targets (4H Timeframe):
Resistance 1: 98,500
Resistance 2: 100,200
Always remember to use proper risk management and confirm your entries with your own analysis.
If you find this helpful, don’t forget to Like, Follow, Comment, and Share!

BitcoinPrice dipping below the daily 200MA is routine. In August 2024 we fell 19 percent under it and that move led to a parabolic rally. This time we are only down 13.8 percent. History shows deeper deviations and this setup signals another strong run for #Bitcoin

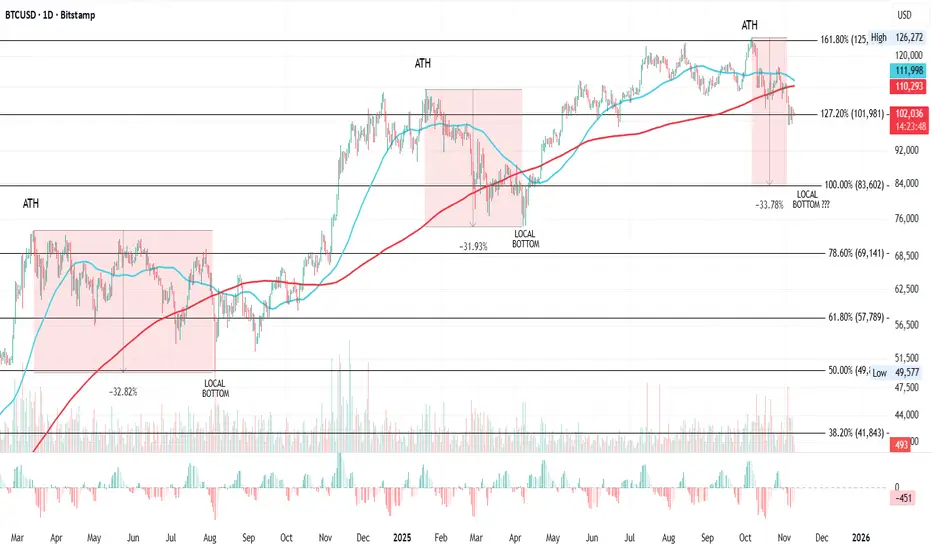
BTCUSD Daily: Watching for Post-ATH Correction Pattern to UnfoldPotential Local Bottom Ahead?
Overall Outlook: I'm tracking a recurring pattern in Bitcoin's price action following each all-time high (ATH), involving sharp drops, interactions with the 50-day and 200-day moving averages (MAs), and key Fibonacci levels. This has played out twice before in this cycle, and we're now in the midst of what could be the third iteration. The setup suggests a potential further drop of around 33.78% from the latest ATH, targeting the 100% Fib level for a local bottom, possibly timed near a death cross. If this holds true, it could signal a strong buying opportunity at the bottom, as price has historically reversed and rallied hard afterward. For now, the theory looks promising, but I'll update this idea as events unfold.
Key Pattern and Historical Observations: This analysis focuses on a consistent post-ATH correction structure that's emerged in Bitcoin's daily chart over the past couple of years. It typically involves: A new ATH breaking above a key Fib extension level.
A subsequent drop of 31-33%, crossing under the 50MA and 200MA.
Bottoming near a lower Fib level (often 2 levels below the ATH breakout point), with timing influenced by the death cross (50MA crossing under 200MA).
Post-bottom recovery: Choppy ups and downs, reclaiming MAs and Fib levels, leading to the next leg up.
Let's break it down by each ATH in the series: First ATH (March 2024): Peaked at $73,794, right above the 78.60% Fib level. This was followed by a 32.82% drop to a local bottom at $49,577. Price action dropped 2 Fib levels to land at the 50% Fib, after crossing under both the 50MA and 200MA. Notably, the local bottom formed just days before the death cross occurred, suggesting the cross could help time reversals. From there, recovery wasn't immediate, price pushed up, hit resistance at the 200MA, dropped, rallied again, and repeated this process. Eventually, it found support at the 50MA and pushed over the 200MA. This consolidation phase lasted from March to August 2024 before the uptrend resumed.
Second ATH (January 2025): Hit $109,356, breaking above the 127.20% Fib level. Similar to the first, it dropped 31.93% to a local bottom at $74,434 and again, 2 Fib levels lower, landing close to the 78.60% Fib (which was key in the prior ATH). This time, the bottom came shortly after the death cross, flipping the timing slightly from the previous instance (after vs. before). Post-bottom, price reclaimed the next Fib level and the 50MA, then crossed the 200MA and held strong without looking back, all the way until October 2025.
Third ATH (Early October 2025): Reached $126,272, just above the 161.80% Fib level. Following the pattern, but accelerating faster this time, price has already dropped under the 200MA and found at least temporary support at the 127.20% Fib level.
Current Setup and Open Questions: Based on the prior two ATHs, this third one raises two key questions that could define the next move: Will price drop to the next lower Fib level? That would mean targeting the 100% Fib, implying a total drop of around 33.78% from the $126,272 ATH (putting the local bottom somewhere near $83,600, give or take based on exact Fib anchoring).
Will a death cross mark the bottom? In the first case, the bottom was days before the cross; in the second, shortly after. Watching for an impending death cross could help time the reversal in real time.
If the pattern repeats, we're likely in the early stages of the correction, with more downside before the bottom forms. This setup has a good chance to play out given the historical parallels, offering a prime spot to buy the dip once the local bottom confirms. I'll keep this idea updated as price action develops, especially monitoring Fib interactions, MA crosses, and any signs of reversal. Potential Trade Considerations: Watch Zones: Resistance: 161.80% Fib ($126,272, prior ATH) and 200MA for any failed retests.
Support Targets: 127.20% Fib (current temp support), then 100% Fib for the potential local bottom (~33.78% drop zone).
Entry Idea: No aggressive positions yet, wait for signs of bottoming near the 100% Fib or around a death cross. If confirmed, long entry on reversal signals (e.g., bullish candle above 50MA).
Risk Management: Set stops below key Fib supports. Target post-recovery upside to prior ATH or higher Fib extensions.
Invalidation: A quick reclaim of the 200MA without further drop could break the pattern, shifting to bullish continuation.
External Factors:
While the technicals are strong, BTC in late 2025 is heavily influenced by US macros, which could amplify or disrupt this post-ATH drop pattern.
For instance: Ongoing Government Shutdown: The US federal government has been shut down since October 1, 2025, making this the longest shutdown in history (now at 39+ days as of Nov 9). It's causing widespread disruptions, including halted SNAP benefits for millions, delays in airport operations due to air traffic controller shortages, increased reliance on food pantries by military families, and broader economic strain like reduced tourism and spending ahead of Thanksgiving. Negotiations are stalled, with Senate Republicans pushing for votes to reopen but Democrats holding out for extensions on ACA tax credits. This uncertainty could weigh on risk assets like BTC, potentially accelerating the expected 33.78% drop if it drags on and hurts consumer confidence or triggers a recessionary vibe. On the flip side, a quick resolution might spark a relief rally, shortening the correction phase.
Fed's Stance on Rate Cuts: There's no FOMC meeting in November, so no rate cut then. For December, Fed Chair Powell emphasized after the October 29 quarter-point cut (bringing the fed funds rate to 3.75%-4%) that another reduction is "not a foregone conclusion" and depends on incoming data. Internal divisions are evident: some officials like Beth Hammack and Lorie Logan question further easing, citing a resilient economy and risks of reigniting inflation.
The shutdown is complicating this by blocking key data releases (e.g., jobs reports), which Powell likened to "driving in the fog." If no cut happens in December, it could pressure BTC lower in the short term by signalling tighter policy, aligning with a deeper Fib target. But if data softens dramatically (e.g., due to shutdown effects), a surprise cut might catalyze the bottom and reversal.
Ending QT and Potential QE Shift: The Fed announced it will end quantitative tightening (QT) on December 1, halting the balance sheet runoff and instead rolling over maturing Treasuries to hold holdings steady at around $6.6 trillion. This addresses tightening money markets and funding strains, but it's not yet quantitative easing (QE), it's more of a pause to maintain ample reserves rather than active expansion. Some analysts speculate this could pave the way for QE resumption if economic conditions worsen (e.g., prolonged shutdown or labour market cooling), potentially starting in December or early 2026. For BTC, ending QT removes a liquidity drain, which is bullish long-term and could support post-bottom rally. If QE kicks in sooner, it might act as rocket fuel, shortening the correction and pushing toward new ATHs faster, but watch for inflation risks that could prompt hawkish pushback.
If you like this idea, feel free to leave a comment, boost, or share your thoughts.
Remember, this is not financial advice; trade responsibly!
Always take profits and manage risk!
Interaction is welcome in the comments!
Something is happening with Bitcoin?- Bitcoin fell more than 25% from its Oct tops (ATHs)
- It is trading below 96500, which has become a crucial pivotal point (PP) since its rally a year back, during which it first tested 100K milestone.
- Falling of bitcoin below 96500 (PP) & 95000 (crucial psychological level) will force the prices to further fall
- The ADX indicator also indicates that sellers are strong and more downward movements can be expected from the market
- The prices could test the region between 83000 - 77500 if the weakness extends in Bitcoin
Overall crypto market erased around $1.1 trillion in market cap, In the past 40 days
* Ethereum slipped 12% in one week to $3,183, while major altcoins such as XRP, BNB, Tron, Solana, Dogecoin, Cardano, and Hyperliquid edged down over 16%.
* The global crypto market capitalisation fell 0.71% to $3.23 trillion, according to CoinMarketCap.
There haven't been many material bearish developments on the fundamental side of crypto.
- A few days ago, President Trump said that his top priority is to make USA "number one in crypto"
- Strategy founder Michael Saylor also recently denied rumors of dumping Bitcoin amid the BTC price plunge, claiming to have purchased it every day.
Yet, Bitcoin is down -25% in one month.
Also, leverage usage is high in crypto
- For speculators, it's common to use leverage in crypto up to 20x, 50x, or even 100x.
- As shown in the image below, a 2% move at 50x leverage would liquidate your position.
- A lower leverage of 25x would also blow your account with not more than a 4% move
When millions of traders are using leverage, this leads to a domino effect.
Due to sudden downswings that happen in crypto, liquidations surge - basically, various buy positions close with a large sell position during liquidation.

BTC in One SentenceThe recent downside momentum in BTC's weekly rising wedge implies a continuation much lower to $70k-$75k & possibly $45k-$55k
A rising wedge on the weekly is inherently bearish
There is a double-top inside the wedge
Price has broken decisively below the wedge & is accelerating lower
Rising wedges often resolve lower to the wedge's beginning; especially, on a weekly timeframe
The lower target looks aggressive, but realistic since it mirrors a similar breakdown in 2021-2022
In addition, there is a lack of bullish divergence
Historically, this suggests a multi-week continuation without a reversal
Momentum shows no sign of any bottoming
BTC is likely to continue lower to $70k-$75k over the next several weeks
If BTC loses mid-$70k with momentum, then the lower support of $45k-$55k is possible
Relief bounces are common before continuing lower
$98k-$102k & $108k–$112k
This move is the start of a larger correction cycle, not the end
NASDAQ:QQQ AMEX:SPY

Long BTC looking for Long BTC 93639 with small SL 2.55% = 91249
Go back to the previous post and you'll see that I warned about selling Bitcoin from 114,300 with a target of 93,639. Now we will reverse from selling to buying.

BITCOIN TO $75k?Bitcoin halving takes place roughly every 4 years; "cutting mining supply" in half to control inflation and ensure scarcity...
After every halving event we see huge appreciation in Bitcoins price (supply cut, demand increases)...
Once these new highs are reached, time goes on and your barber, taxi driver, and pizza delivery guy all start talking about Bitcoin; thats when you know valuation is soon to correct itself to a discount...
Bitcoin's history shows every time this correction takes place, it's gravitates towards the area in which Bitcoin earlier accumulated after the halving...
Reaccumulation and a new bull market starts to unfold after uninformed money like your barber, taxi driver, and pizza delivery guy all sold their holdings due to misunderstanding market cycles.
WHEN EVERYONE IS GREEDY BE FEARFUL
WHEN EVERYONE IS FEARFUL BE GREEDY
@utilizedtrading on IG


Shaking Bulls – The Trap Before the Collapse?Bitcoin just showed one of the cleanest liquidity sweeps we’ve seen in months.
After grabbing liquidity above 116k and rejecting hard, the market looks ready to punish late bulls who chased the breakout.
🔍 What I’m Watching:
Rejection zone: 115,900–120,100 (previous supply area)
First target: 104,800 (mid-range support)
Second target: 86,000
Final target: 75,000 zone – potential full structure retest
💡 The Logic:
This setup represents a textbook bull trap after a strong rally.
The sudden spike to new highs lured in breakout buyers while institutions unloaded.
Now, we could see a multi-leg distribution as the market corrects toward deeper demand zones.
⚠️ What Could Invalidate It:
If BTC reclaims 120,000 with strong volume and closes 4H above it — the short idea is off the table.
🧭 My Plan:
Short bias below 116k, scaling into pullbacks, targeting mid-range and lower demand zones step by step.
This is not financial advice — just how I see the current structure developing.
💬 What Do You Think?
Are we witnessing a bull trap before a deeper correction, or will Bitcoin surprise everyone with another breakout?
Drop your thoughts in the comments 👇
If you find this type of technical breakdown useful — like, follow, and share to stay updated when I post next charts!

BTCUSD H4 | Bearish Reaction off Key ResistanceMomentum: Bearish
Price is currently below the Ichimoku cloud.
Sell entry: 107,398
- Strong Pullback support
- 50% Fib retracement
- 161.8% Fib extension
Stop Loss: 111,400
- Swing high resistance
Take Profit: 99,896
- Multi-swing low support
Stratos Markets Limited (tradu.com/uk ):
CFDs are complex instruments and come with a high risk of losing money rapidly due to leverage. 68% of retail investor accounts lose money when trading CFDs with this provider. You should consider whether you understand how CFDs work and whether you can afford to take the high risk of losing your money.
Stratos Europe Ltd (tradu.com/eu ):
CFDs are complex instruments and come with a high risk of losing money rapidly due to leverage. 70% of retail investor accounts lose money when trading CFDs with this provider. You should consider whether you understand how CFDs work and whether you can afford to take the high risk of losing your money.

BTC/USD going to 73kMy technical analysis is that BTC/USD is going to at least 73k, based on recent events (Burry shorts) and market correction.
Bears are on their way.
Not an investment advice.
Thanks, A.I.

### BTCUSD Daily Analysis: Bearish Bias Confirmed – SELL ON RALL
**Current Price (as of Nov 17, 2025):** ~$95,405 (consolidating near $95,000 after rejection from $96,564 high).
**Overall Bias: Bearish** – Bitcoin shows clear downside structure with the purple supply block acting as resistance. The recent rejection from $96,564 (high of the session) and bearish engulfing candle on D1 signal continuation lower, targeting the next support. While bulls defended $94,300, volume on red candles (1.68M+) indicates seller control.
#### Key Technical Levels (D1 Timeframe)
- **Resistance:** $96,000–$96,564 (purple supply block; strong rejection zone).
- **Support:** $94,300 (demand block; hold here for potential bounce, break targets $92,971 low).
- **Pivot:** $95,247 (current; close below flips to aggressive sell).
#### Chart Analysis (D1 Candles)
- **Recent Action:** Price gapped up to $96,564 but formed a bearish engulfing candle with close at $95,405 (-0.28%). The purple supply block held as expected, with red arrow showing rejection. Green uptrend line broken, confirming lower highs/lows.
- **Trend:** Bearish wave structure intact (red zigzag); price trapped in descending channel from $102,500 high.
- **Indicators:**
- **RSI (14):** 46 – Neutral-bearish, dipping below 50.
- **MACD:** Bearish histogram expansion; signal line crossover confirms downside momentum.
- **Volume:** Elevated on down days (1.68M vs. MA 1.17M) – sellers dominating.
#### Bearish Scenario (Primary Bias)
- **Trigger:** Rally to $95,700–$96,000 rejection → Short entry.
- **Targets:** TP1 $94,300 (-1200 points), TP2 $92,971 (-2500 points, low of session).
- **Rationale:** Post-ATH correction (from $126,198 Oct high, -24.46% YTD); DXY strength and ETF outflows ($41.61M long liquidations) pressure BTC.
- **Risk/Reward:** 1:3+ (Enter $95,700, SL $96,564, TP $94,300).
#### Bullish Scenario (Secondary – If Support Holds)
- **Trigger:** Close above $96,000 → Targets $98,000–$100,000 (triangle breakout).
- **Rationale:** Bulls defending $94,300 demand; potential retest of $102,500 if ETF inflows rebound.
- **Risk/Reward:** 1:2 (Long $95,247, SL $94,300, TP $97,000).
#### Trade Setup Recommendation (D1 Bias: Bearish)
- **Direction:** Sell on rally to $95,700–$96,000 (supply block).
- **Entry:** $95,700.
- **SL:** $96,564 (above block high).
- **TP1:** $94,300 (1:1.5 RR).
- **TP2:** $92,971 (1:3 RR).
- **Position Size:** 0.01 lot ($1K account, 2% risk = ~$20).
- **Invalidation:** Daily close above $96,564 → Flip bullish.
#### Fundamental Drivers (Nov 17 Context)
- **USD Strength:** DXY at 103.50 (post-CPI hawkish surprise); Fed cuts delayed to Q2 2026.
- **BTC Demand:** ETF outflows $41.61M longs liquidated; $92,971 low tested.
- **Risks:** Singapore BTC futures launch (Nov 24) could spike volatility; watch Trump policy announcements.
**Overall Outlook:** Bearish bias dominates with supply block rejection; target $92,971 by month-end. Trade with 1-2% risk; use stop-losses.
*Disclaimer: Educational analysis only. Trading risks capital; 74-89% retail accounts lose money. DYOR.*
**Follow for daily BTC & Gold updates!** #BTCUSD #BitcoinBearish #SupplyBlock #TamilDigitalTraders #2PercentRule

BTC - Bitcoin Monthly Chart - Update 🧠 Keep it on watch. Momentum shifting. Lower Lows are coming till the next election? Opinions?
⚠️ Disclosures :
This analysis is for informational purposes only and is not financial advice. It does not constitute a recommendation to buy, sell, or trade any securities, cryptocurrencies, or stocks. Trading involves significant risk, and you should consult with a qualified financial advisor before making any investment decisions. Past performance is not indicative of future results.

200000$ is the target. BTC is bullish.The chart is bullish. BTC is in a clear uptrend with a bottom at 93-94K. The moment that we are right now. Therefore, second half of November will start the next leg up.
Confirmation of this theory: BTC needs to break out 98K on the daily.

BTCUSD | London Session | Bullish Structure BalanceThe monthly bullish structure balance has now been filled, and the higher-timeframe map remains intact.
BTC continues to rotate inside a bullish range and is still positioned in the discount zone.
Range boundaries:
• Range low (invalidation): 78.167
• Range high (continuation): 123.231
As long as price holds above the range low, the bullish bias stands.
- Market Structure Mapping (MSM) — Current View
The structural picture is straightforward:
BTC is holding a clean range.
There is no breakdown. No structural shift.
The architecture is stable.
Cross-market structure adds context:
• The U.S. dollar sits directly on a major volume node.
If the dollar pushes higher from here, risk assets usually feel it.
If the dollar softens, crypto keeps its bullish rotation.
• FX majors recently cleared liquidity lows, resetting the structural map.
• Crypto majors remain balanced with no directional damage.
This is a classic data-waiting phase.
The structure is already drawn. The market is waiting for a catalyst to decide the next expansion path.
- Precision Execution Modeling (PEM) — Guidance for Volatile News Days
When heavy data is on the calendar, PEM shifts the playbook:
• Do not react to the first spike.
The wick is emotion. The candle close is intent.
• Step back to higher timeframes.
4H and 1D candles filter out noise and reveal real direction.
• Expect wicks to violate levels without changing structure.
Large funds do not trigger algorithms on a random spike; they react to confirmed structure.
• Protect capital until the market shows its hand.
In fast conditions, patience is a position.
CORE5 :
If you need excitement, watch Netflix. If you need results, wait for the candle close.
— CORE5DAN
Institutional Logic. Modern Technology. Real Freedom.
