Ignore the FUD...$BTC is ripping higher soonJust like Every multi week
BTC correction, sentiment on crypto twitter has gone south quickly
With many of the biggest accounts calling this the cycle top
But I beg to differ...All signs (both technical and fundamental) are pointing to another leg higher in 2025-2026
WIth the most obvious being the corrective channel
BTC
has been in since Last month
With almost the same playbook at the June correction playing out
-BTC moves down after minimal consolidation
-BTC then retests ATH
-Gives us one more fresh low, before moving higher
I believe BTC has either bottomed out or is very close
and will rip to 150k+ on this next leg
Not to mention regulatory clarity, and institutional adoption makes this most bullish fundamental environment ever for
BTC
Send this baby to 150k
BTCETH.P trade ideas

Bitcoin Go 50kAfter hitting the top of its channel several times, Bitcoin is now moving towards the bottom of the channel, the 85,000 range and then moving towards 50,000.

Bitcoin Wave 3 of 3 Down after Double Combination Wave 2This is an update on the Bitcoin Elliott Wave counts. Basically, the idea is still short but this time, you can slightly adjust the stop down to $113,750. The price target is still the same at $98,400.
Over here, I updated the most recent wave down as sub-wave 1 of 3, and also the recent move up as sub-wave 2 of 3. At the moment, sub-wave 3 of 3 is on-going.
Good luck!

Bitcoin Monthly Candle Colour closes since 2013 - August Close
August closed RED and so now we have 10 red closes to 5 Green.
This has closed the possibility of continuing the pattern we had been following.
The Dashed line Boxes show us The only 2 occasions where we have had a Green December, Red January, Red February, Green March, Green April.
Then we had a Green May 2012 and a Red May 2020
Then both repeated a Green June, Green July.
They both also had had Green August but we just closed Red.
This breaks this sequence for me but I will keep the boxes in place for now just incase we revert back to Sequence.
The horizontal arrows are pointing to the previous 9 Red August Closes.
Where you see 2 Arrows is where this was followed by a Green September. This happened 4 times.
Note those double arrows on the left are in the 2016 build up to 2017 ATH and the ones on the right are in the Current cycle.
September Candle close count is currently is 5 Green to 9 Red, the same as August was.
Of those 5 Green September closes, 4 were after a Red August.
The other Green September was in the 2020 run up to the March 2021 ATH ( Middle dashed box)
Odds are on for a Red September as we see Bitcoin falling below some serious support levels but we should also note how PA is remaining above the 100k line for now.
August and September are traditionally months of Holidays and so trading slows, hence the majority of Red candles
Q4 is the ones to wait for and as you can see from the colour counts, Q4 is usually Bullish
We wait - we Hold and if PA Drops to the possible 104K line where the 200 day SMA sits, I will Buy More.
Scale in

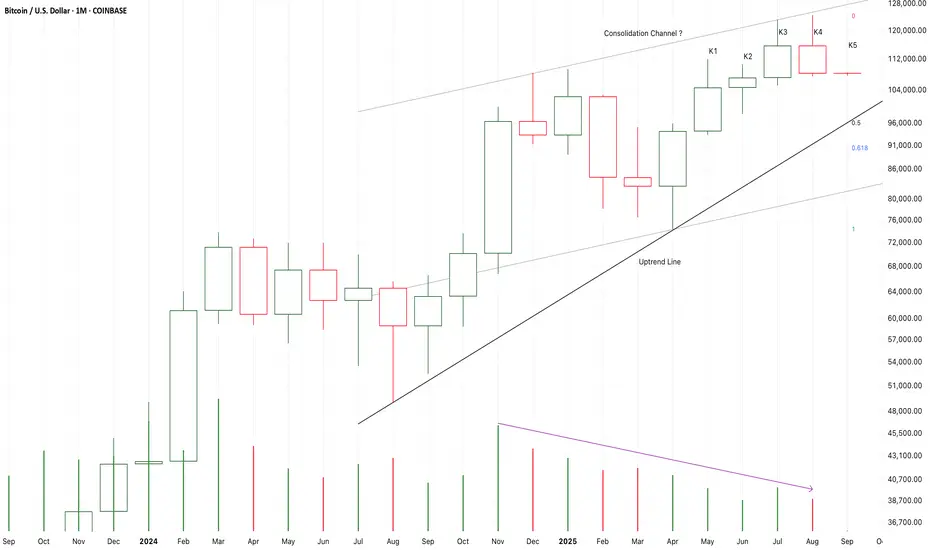
Chart Pattern Analysis Of Bitcoin.
After K3 break up the previous higher high,
K4 return back immediately.
It seems that K3 was a potential fake up candle,
But it must be verified by K5.
I am expecting a doji candle of K5 close at low price area to terminate the three years bull market here.
If I bought it earlier,
I will try to cut off most of my long-term positions and even try to buy MSTZ to short it.
On the other hand,
If K5 close at high price,
The following candles will test 128K area or even break up it.
Long-88K/Target-98K/Stop-87K
Short-115K/Target-89K/Stop-116K
Will BTC goes to 63K Level?Hey traders! 👋
Here's a quick and simple look at BTC/USD 👇
Disclaimer on, This is a personal opinion, I am not responsible on your trading results. Trade with your own risk.
🔹 Key Resistance at $63K
This level has acted as a strong resistance zone before and now aligns perfectly with the major trendline intersection. This makes $63K a crucial level to watch closely.
🔹 Price vs Volume Divergence ⚡
Currently, we're seeing something interesting:
Price → moving UP 📈
Volume → moving DOWN 📉
This kind of divergence often hints at a potential trend reversal. So, while the price looks bullish on the surface, decreasing volume could signal weakening momentum.
⚠️ Takeaway:
Stay alert around this area — a breakout could be strong, but a reversal is also on the table. Manage your risk wisely! 🛡️
What do you think? Will BTC break above $63K or pull back from here? Share your thoughts below! 💬👇

BTCUSD – Bearish Trend ? Hello traders! Let’s take a closer look at BITSTAMP:BTCUSD !
Recently, we’re seeing clear signs of a potential reversal after BTCUSD formed a double top pattern, and the EMA 34 and EMA 89 have crossed each other.
Breaking the support level around the previous key zone has strengthened the bearish momentum, potentially triggering a further decline towards the next support level near 103,500 USD.
However, I’m also watching for possible reversal signals at these support levels. If BTCUSD holds above 103,500 USD and forms a higher low, we may see the bulls make a comeback.
🔴 Key Levels to Watch:
Resistance: 114,000 USD
Support: 103,500 USD
EMA Crossover: Strong Bearish Signal
Stay alert and be ready for potential market shifts! Will the bulls step in at 103,500 USD? Or will the bears continue to dominate?
Let me know your thoughts and happy trading!

$BTCUSD: Candle Transitions🏛️ Research Notes
Average Bullish & Bearish Percentage Change colors bullish candles violet when avg % change falls, respectfully bearish candles are colored yellow when they shrink. It's important to be aware of these transitions ahead of reversals.
They can be filtered into signals by FREMA . I'd pay attention to bullish decay while there is liquidity at upper half, and bearish decay at lower half.

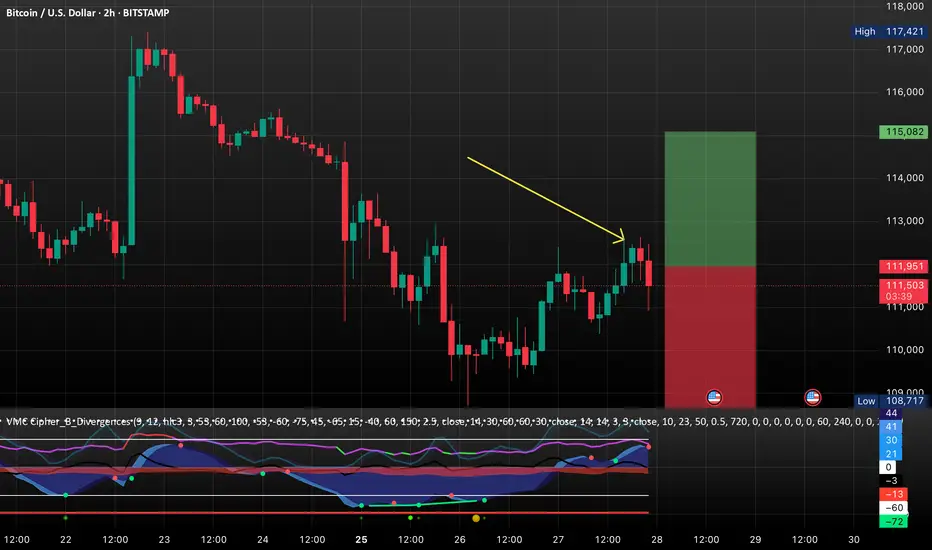
Sell Plan – BTCUSDSell Plan – BTCUSD
Entry planned around 109,500 zone after price tapped supply and showed rejection.
Stop Loss will be kept above the rejection area (109,600 – 109,700) to stay safe.
First target at 108,500 liquidity level, where price may react.
Second target at 106,400 – 106,300 swing low, aiming for deeper liquidity.
Narrative: Market swept upside liquidity, tapped into premium supply, and rejected strongly, giving confirmation for a sell.

SELL BTCUSD for bullish divergence trend reversal STOP LOSS: 116SELL BTCUSD for bullish divergence trend reversal STOP LOSS: 116,945
Regular Bearish Divergence
In case of Regular Bearish Divergence:
* The Indicator shows Lower Highs
* Actual Market Price shows Higher Highs
We can see a strong divergence on the MACD already and There is a strong trend reversal on the daily time frame chart.....
The daily time frame is showing strength of trend reversal from this level resistance so we are looking for the trend reversal and correction push from here .....
TAKE PROFIT: take profit will be when the trend comes to an end, feel from to send me a direct DM if you have any question about take profit or anything
Remember to risk only what you are comfortable with........

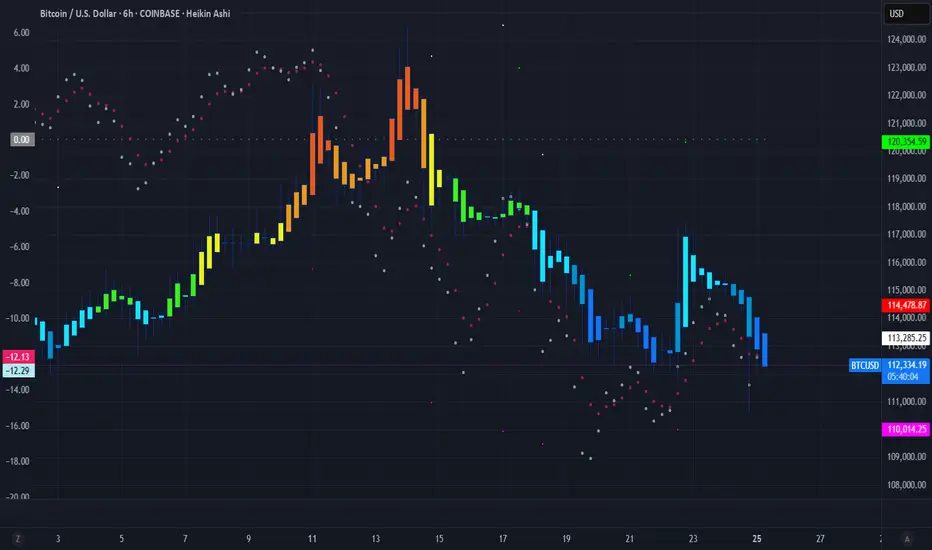
▒₿▒ Distribution Top - Anatomy of a Bitcoin Cycle Top ▒₿▒COINBASE:BTCUSD
I've identified key price action indications that we have "topped" with an ATH for this Bull Market Cycle. There is a much deeper analysis that needs to be done here.
While this price action is the first major clue, to confirm a true distribution top, we'll also need to analyze volume profiles for institutional selling, spot bearish divergences in key momentum oscillators, and watch on-chain metrics for any signs of whale or miner selling pressure.
Every Bitcoin cycle has a story, and the final chapter is always the most dramatic. I've been analyzing the price action at every major cycle peak, and there's a recurring pattern that acts like a final warning before the curtain falls. It’s not the explosive top itself, but the messy, indecisive period that follows: the Distribution Top .
This isn't just a pattern; it's the visual footprint of a massive transfer of wealth. It’s the moment when the cycle's early investors (smart money) begin to distribute their holdings to the late, euphoric buyers.
Look at the price action from the November 2021 ATH top. After the euphoric peak, the clean, powerful uptrend dies. It's replaced by a volatile, sideways "wiggle." The Heikin Ashi candles lose their bodies, showing long wicks on both sides. This is the signature of market conflict and exhaustion.
Cycle Tops vs. Local Highs: A Crucial Distinction
It's important to understand that this "wiggle" is unique to major, euphoric ATH cycle tops. Other tops, like the one from August 2021 shown below, have a much different character. Notice how the rejection is sharper, faster, and lacks the prolonged, grinding "wiggle." This is often a rejection from a known resistance level, not the slow, painful end of cycle-wide euphoria.
The "Distribution Top" is a process. It’s designed to churn, create confusion, and trap breakout traders before the real move down begins. It’s the market grinding at the highs, absorbing the last wave of FOMO. We saw this exact anatomy play out in the April 2021 top as well.
The Key Takeaway for Bitcoin Investors:
Recognizing this specific pattern is crucial for capital preservation. When you see this shift from clean momentum to choppy, indecisive grinding near an all-time high , it's a signal that the market character has changed. The risk is no longer to the upside; it's to the downside.
While this price action is the first major clue, to confirm a true distribution top, we'll also need to analyze key trend lines, candlestick patterns, seasonality, volume profiles for institutional selling, and watch on-chain metrics for any signs of whale or miner selling pressure.
Now, take a look at the most recent price action. We are seeing the early stages of this very same pattern developing after a new high.
The question every Bitcoin holder should be asking is: Is this history rhyming once again?
As I mentioned at the start of this post, there are much more metrics to analyze here, so I'll be updating this post with further findings.
DISCLAIMER
I AM NOT A FINACIAL ADVISOR, NOR AM I YOURS. THIS IS NOT FINANCIAL ADVICE. MEARLY DOODLINGS ON A MATHMATICALLY DRIVEN GRAPHICAL INTERFACE, TRACKING AN INVISIBLE 256BIT MILITARY-GRADE ENCRYPTED ASSET. . . FOR ENTERTAINMENT/AMUSEMENT PUROSES ONLY. ENJOY!
Looking to hear your thoughts on this @TradingView @Profit_Through_Patience @David_Perk @ProjectSyndicate @Xanrox_ @HAMED_AZ @melikatrader94
BTC/USD: Bitcoin Set to Explode?As of August 27, 2025, Bitcoin (BTC) is trading at approximately $111,612, reflecting a slight daily increase. The cryptocurrency market has experienced notable developments recently, influencing both short-term price movements and long-term trends.
The U.S. government's establishment of the Strategic Bitcoin Reserve in March 2025, under President Trump's executive order, has significantly impacted market sentiment. This move positions Bitcoin as a national reserve asset, with the U.S. Treasury holding an estimated 198,000 BTC. Such institutional adoption has bolstered investor confidence, contributing to Bitcoin's recent price surge to over $124,000 earlier this month...
Additionally, the rise of Bitcoin Treasury Companies (BTCs), such as MicroStrategy, which now holds around 630,000 BTC, has further reduced available supply on exchanges. Reports indicate that Bitcoin availability on exchanges fell below 15% in July 2025, a low not seen since 2018. This scarcity has intensified demand, driving prices higher.
Bitcoin is currently consolidating between the $112,000 and $115,000 levels. The 50-day exponential moving average (EMA) near $114,000 has acted as a resistance point, while support is observed around $110,000. A breakout above $115,000 could pave the way for a retest of the $120,000 to $125,000 range.
Conversely, a decline below $110,000 may lead to further downside, with potential support levels at $108,000 and $105,000. The Relative Strength Index (RSI) is hovering around 42, indicating that the market is not overbought, allowing room for upward movement.
*Bitcoin's market is currently characterized by strong institutional support, reduced supply on exchanges, and positive regulatory developments. While short-term fluctuations are possible, the overall trend points towards continued growth. Investors should monitor key support and resistance levels, as well as macroeconomic indicators, to navigate the evolving landscape effectively.
28.08.25 BTC/USD Bearish Pressure Mounts — Next Target $107,000Bitcoin: Bearish Pressure Mounts — Next Target $107,000
Market Overview:
Bitcoin continues its decline after multiple failed attempts to hold above $116,000. The price has formed a five-wave Elliott structure, reinforcing the bearish momentum. The focus now shifts to the $107,000–106,500 support zone, where buyers may show renewed interest.
Technical Signals & Formations:
Elliott Waves suggest completion of corrective wave (5).
EMA (144) remains above current price, acting as resistance.
Overall structure signals sustained bearish pressure.
Key Levels:
Support: $107,000 – 106,500
Resistance: $114,800 – 116,000
Scenario:
Main (bearish): decline towards $107,000 with potential test of $106,500.
Alternative (bullish): breakout above $116,000 could attract buyers and push BTC towards $120,000.

BTC bullish OUTLOOK FOR PREVIOUS SETUPSA complete wave1 has just concluded. We expect a correction before the wave2 sets in. At the moment let's milk the correction

Btc levels Btc levels are still holding tight ive gave all the prices within 1% but I was wrong with the 113722 call but the levels will not will not let you down if we don't hold 108218 or 107924 we will go to 104868 says the GMC

BTCUSD Faces Mid-Band Rejection: Deeper Retracement incoming Price is showing rejection around the mid-range of its volatility bands after failing to sustain above the $112,800 zone, suggesting a potential continuation lower. The setup aligns with multiple bearish signals favoring downside momentum.
✅ Bearish Confluences:
Fibonacci Resistance: Price rejected just below the 38.2% retracement level at $114,619, failing to reclaim higher ground.
Lower High Structure: Market continues to print lower highs, reinforcing the short-term bearish trend.
Volatility Band Pressure: Rejection from the mid-band area highlights weakening buy-side momentum and strengthens the case for further downside.
🎯 Fibonacci-Based Targets:
TP1 – $111,016 (38.2%): First support test within the lower range.
TP2 – $109,903 (61.8%): Deeper retracement target in line with bearish continuation.
TP3 – $108,102 (100%): Full measured move completion toward the lower volatility band.
SL: Placed above $114,620 to invalidate the short thesis in case of bullish breakout.

BTC Aug. 29, 2025The information and publications are not meant to be, and do not constitute, financial, investment, trading, or other types of advice or recommendations.

BTC potential Roadmap for the Next 2 WeeksThere will potentially be 1 more leg down to complete the 5 wave move and sweep the low. The current bounce doesn't seem strong enough.

Potential bearish drop?The Bitcoin (BTC/USD) has rejected off the pivot which acts a a pullback resistance and could drop to the 1st support.
Pivot: 112,875.12
1st Support: 109,694.37
1st Resistance: 117,327.94
Risk Warning:
Trading Forex and CFDs carries a high level of risk to your capital and you should only trade with money you can afford to lose. Trading Forex and CFDs may not be suitable for all investors, so please ensure that you fully understand the risks involved and seek independent advice if necessary.
Disclaimer:
The above opinions given constitute general market commentary, and do not constitute the opinion or advice of IC Markets or any form of personal or investment advice.
Any opinions, news, research, analyses, prices, other information, or links to third-party sites contained on this website are provided on an "as-is" basis, are intended only to be informative, is not an advice nor a recommendation, nor research, or a record of our trading prices, or an offer of, or solicitation for a transaction in any financial instrument and thus should not be treated as such. The information provided does not involve any specific investment objectives, financial situation and needs of any specific person who may receive it. Please be aware, that past performance is not a reliable indicator of future performance and/or results. Past Performance or Forward-looking scenarios based upon the reasonable beliefs of the third-party provider are not a guarantee of future performance. Actual results may differ materially from those anticipated in forward-looking or past performance statements. IC Markets makes no representation or warranty and assumes no liability as to the accuracy or completeness of the information provided, nor any loss arising from any investment based on a recommendation, forecast or any information supplied by any third-party.

Bearish continuation?Bitcoin (BTC/USD) is reacting off the pivot which is a pullback resistance and could drop to the 1st support.
Pivot: 112,442.83
1st Support: 107,898.67
1st Resistance: 114,633.18
Risk Warning:
Trading Forex and CFDs carries a high level of risk to your capital and you should only trade with money you can afford to lose. Trading Forex and CFDs may not be suitable for all investors, so please ensure that you fully understand the risks involved and seek independent advice if necessary.
Disclaimer:
The above opinions given constitute general market commentary, and do not constitute the opinion or advice of IC Markets or any form of personal or investment advice.
Any opinions, news, research, analyses, prices, other information, or links to third-party sites contained on this website are provided on an "as-is" basis, are intended only to be informative, is not an advice nor a recommendation, nor research, or a record of our trading prices, or an offer of, or solicitation for a transaction in any financial instrument and thus should not be treated as such. The information provided does not involve any specific investment objectives, financial situation and needs of any specific person who may receive it. Please be aware, that past performance is not a reliable indicator of future performance and/or results. Past Performance or Forward-looking scenarios based upon the reasonable beliefs of the third-party provider are not a guarantee of future performance. Actual results may differ materially from those anticipated in forward-looking or past performance statements. IC Markets makes no representation or warranty and assumes no liability as to the accuracy or completeness of the information provided, nor any loss arising from any investment based on a recommendation, forecast or any information supplied by any third-party.

bitcoin epic pump...Bitcoin is accumulating strength before an epic pump,
in the truest sense of the word.
The statement that a local peak was seen before entering the Bitcoin euphoria zone is meaningless.
CRYPTOCAP:BTC

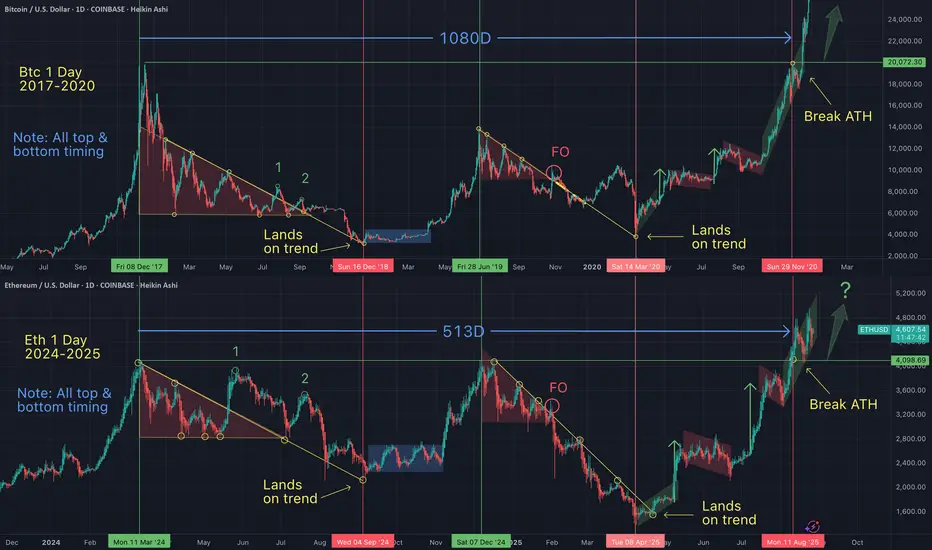
Eth - These chart patterns are repeating over & over If we learn to identify common patterns we will note that they are occuring over and over...on every asset (that has a chart)...on every timeframe. When in doubt, zoom out.
I can help you see the matrix.
BTCUSD--SHORT--it seems BTCUSD will drop for short term at least.
--to see big picture check my weekly chart on my. account
--waiting for your comments
