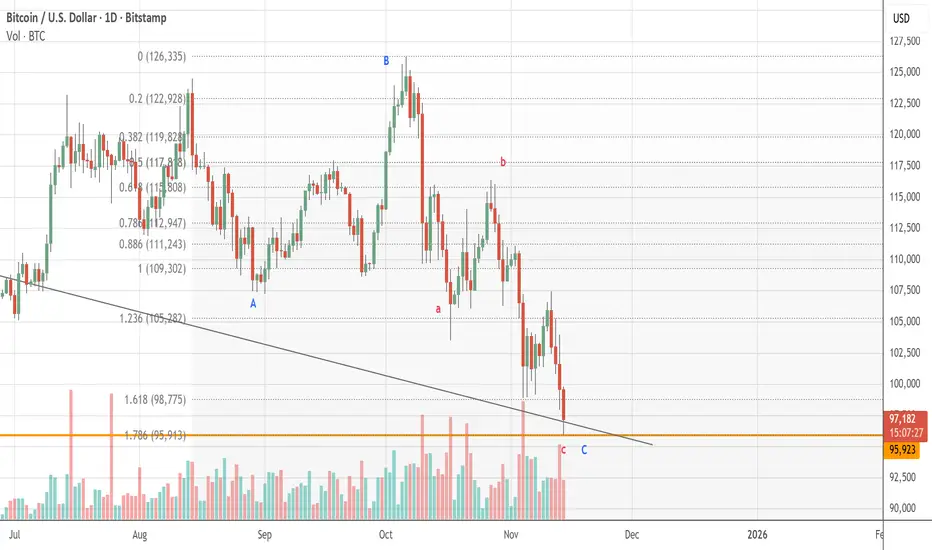
BITCOINS - time to recoverTeam, time to ADD BITCOINS at the current price 99715
WORST retest around at 98000 can add more at this level
STOP LOSS safe at 96000
Target 1 at 101500-102500 - take partial and bring stop loss to BE
Target 2 at 103500-105000
TARGET 3 at 109000-115000 - HOLD until december!
lets go for SANTA RALLY.
Trade ideas

$BTC - FTX Style reaccumulation. Just going to leave this here to follow along. If this was the same style reaccumulation, and reversal we saw back then, the next step would be a move higher into the range, and last point of supply, before the sign of strength move which would bring us back to the top of the range.
Granted, this is at elevated prices, rather than after a major bear market, but the capitulation on Oct 11th actually far exceeded the liquidation event when FTX collapsed.
Not trying to be a predictor, or hero here, but this is worth bringing up.
This is inline with a few of our schematics from our channel, and we have alternative plans for downside if this failed. Give the bull case some credit until proven otherwise in a Macro uptrend.

BTC watch $104.2k then 105.5: Major fibs that may END the BounceThis is a follow-up to my Big Picture Idea below.
We have a decent bounce after piercing 100k round
Now approaching a couple of major fibs for resistance.
Rejection from either fib could send us to new lows.
$104,235.02 is a Golden from Covid bottom
$105,451.85 is a SemiMajor Genesis fib
$ 97,769.44 is a minor Genesis and target.
.
Big Picture calling for 97.8k:

BTCUSD: Falling Wedge Reversal in Play Toward 106KHello everyone, here is my breakdown of the current Bitcoin setup.
Market Analysis
Bitcoin (BTCUSD) has recently shown signs of recovering bullish momentum after rebounding from the 100,600–101,000 Support Zone, which has acted as a key demand region during previous tests. The market experienced a fake breakout below the wedge support line, but buyers quickly stepped back in, pushing the price back inside the structure — a classic indication of seller exhaustion and accumulation interest.
Currently, BTC is trading inside a falling wedge pattern, which is typically considered a bullish reversal formation. The recent bounce from the lower boundary suggests that buyers are attempting to regain control, especially after the sharp decline from the 113,700 Resistance Zone. The price is now gradually approaching the mid-range of the wedge, signaling a potential continuation toward the upper resistance line.
My Scenario & Strategy
If Bitcoin holds above the 100,600–101,000 support, the bullish scenario remains valid. I expect the price to gradually move toward the 104,000–106,000 area as the next short-term target, aligned with the wedge resistance line. A breakout and confirmed hold above the wedge resistance would likely signal a trend reversal, opening the door for a larger continuation toward the 113,700 resistance zone, and possibly beyond.
However, if BTC loses the 100,600 support again and closes below the wedge, this would invalidate the bullish setup and could trigger a deeper move toward 98,000 before a new structure forms.
That's the setup I'm tracking. Thank you for your attention, and always manage your risk.

BTC Ending Diagonal to Finish Off the Cycle?Most people seem to think that either the cycle has already topped or that BTC is going towards 170K+ in a blowoff top. But what if we are just starting wave 5 of an eding diagonal that tops out around $135K? That would wreck the bears first, then trap the bulls expecting a blowoff top. And it could also allow for an alt season, although it may not be as strong as past cycles. What do you think?

Btcusd As we can see we have btcusd on a down trend and we are expecting btc to get to 90k cause we have the 1 week 1 day and 4hrs on a downtrend

Is it buy the dip time for #Bitcoin ? Is it buy the dip time for #Bitcoin ? 👀
Despite the recent action, we remain solidly above this crucial support. The structure looks good.
What's your move? 👇

BITCOIN 2025 - MAKE OR BREAKBTC is coiling. Liquidity is tightening. Momentum is fading. The market is soon to decide whether we break higher toward the next resistance leg… or lose key support and trigger a broader correction.
Two key dates stand out: November 6 and November 17.

WHALES vs HAMSTERS. DON'T LET YOUR MONEY BE THROWNThis chart (not live) showing the number of unique addresses holding at least 10,000BTC.
Hooray.. Hooray...They called
🌕 “Uptober” Strikes Again
October has a reputation in crypto lore and it’s living up to it.
In the midst of all of that, Big Crypto Guys have been selling for a long time.
- And know what else?
- Last time they did it in 2021, then a year later BTC dropped 70%, or so.
--
Best wishes,
@PandorraResearch Team

Moving average That's my moving average based trading set-up , providing a winning ratio much more than loss , even on when market trade sideways

$BTC bounce before further selloffAs you can see from the chart, BTC formed a falling wedge and looks set to breakout to the upside from it.
I've marked off areas of resistance, but I think if we do get a breakout, the areas you'll want to take profit are $117k and $121-122k as the most likely areas for price to reject.
I think at those levels, you'll want to derisk or set stop losses, because I think it's likely that we can fall a lot further.
The trigger to go short would be losing the diagonal trend line that goes all the way back to October 2023 when the start of the bullish move happened. A move below that trend line should indicate the bullish move is finished and I think that we could potentially move down to the $60k-72k support levels.
I've marked off a lower resistance at $30k, just incase we see an extreme move in the worst case scenario.
Let's see how it pans out over the coming months.

BULL idea. not fin adviceBitcoin has completed its corrective ABC wave, and the structure now points to the start of a new impulsive 1–2–3–4–5 wave to the upside. The correction looks finished, momentum is shifting, and price action is showing early signs of a fresh bullish impulse — likely the beginning of Wave 1 of a larger upward cycle.
Trust

Those who are afraid cannot have childrenI know we're at the bottom of the uptrend.
And yes... we haven't been able to form a bottom in the daily trend.
But I don't want to get liq. , and I'm still bullish. The 4H RSI is on our side. If in an hour we can close like this also a wonderful doji will come up.
We can do it.

BTCUSD🌎Bitcoin has been holding up very well in cycles for over 10 years.
In previous instances, when it peaked in a sine wave, it lost more than 75% of its value from its peak.
A short-term rebound from its long-term trendline is expected, and it also fits into the overall Santa Claus rally expected in December.
These cycles show that corrections end before the sine wave lows, and almost always within the same timeframe, suggesting that next year will be a very difficult time for bulls.

BTC at $94.5k: Repeating April's Playbook?📊 BTC at $94.5k: Repeating April's Playbook?
Bitcoin trading at $94,491 with two critical Fair Value Gaps in play. The question: are we mirroring April 2025's setup?
The Two Gaps
Upper FVG (~$88k-$91k): Currently testing as support
Lower FVG (~$73k-$76k): April's bottom zone—still unfilled
April's Winning Formula
In April 2025, BTC executed the perfect FVG setup:
Quick tap of the $73k-$76k zone (April 7-9)
Aggressive V-shaped bounce within days
Rally to new ATHs above $120k
Bull vs. Bear
🟢 Bullish: We need to tap and hold the upper FVG zone ($88k-$94k) with conviction. A strong bounce from current levels that reclaims $100k+ confirms buyers are defending this zone. If we fail here, the market will likely seek the unfilled lower FVG at $73k-$76k (April's playbook).
🔴 Bearish: Failure to hold $88k-$94k = high probability move to fill the $73k-$76k gap. Extended weakness or breakdown below this zone validates the deeper retracement scenario.
Key Levels
Critical Test: $88k-$94k (upper FVG—must hold for bulls)
Support: $88k → $76k (April bounce zone) → $73k
Resistance: $100k (reclaim needed) → $108k → $120k
The Play
Bulls need to defend the upper FVG NOW. If this zone holds and we reclaim $100k, the April bottom tap becomes unnecessary. If not, expect a move down to tap the unfilled $73k-$76k zone—just like April—before the real rally begins.
FVGs have a 98% fill rate. One of these gaps will get filled. Which one depends on the next 48-72 hours.

Bitcoin Bulls Target $113K**Bitcoin (BTC/USD) Analysis — November 2025**
Bitcoin has been moving within a controlled downtrend channel, facing continuous lower highs since late October. The market recently went through a **liquidity sweep**, followed by a minor **market structure shift (MSS)** on the 3-hour timeframe. This suggests exhaustion in the current bearish leg.
After a period of **sideways consolidation**, price is testing a strong accumulation zone near the **$100K–$97K** region. This zone aligns with prior demand and high-volume nodes, making it a potential base for a bullish reversal.
A clean rebound from this level could drive Bitcoin toward the **$113K–$115K** area, where the next liquidity cluster sits. If buyers regain momentum, this move could accelerate into a **V-shaped recovery**, confirming the start of a fresh mid-term bullish cycle.
Overall sentiment remains **bullish**, supported by renewed buyer activity and potential macro-driven inflows ahead. Traders should watch for volatility spikes as the market transitions from accumulation to breakout mode.
**Key Takeaway:**
BTC is stabilizing near key demand, eyeing a rebound toward $113K+. Momentum confirmation above the short-term consolidation zone could trigger a strong upward continuation.
**#Bitcoin #BTCUSD #CryptoAnalysis #BitcoinForecast #BTCPricePrediction #CryptoTrading #BullishReversal #CryptoMarket #TradingViewAnalysis**

BTCUSD – Market Structure ProjectionShort-Term Outlook
1. BTC is expected to complete a final liquidity sweep below recent lows.
2. A minor corrective rally into a premium zone offers a short opportunity.
3. Confirmation comes from rejection + RSI divergence.
2. Mid-Term Reversal Setup
4. After the sweep, BTC is projected to form a bullish break of structure (BOS).
5. A retest of demand provides the optimal long entry.
6. This phase begins the next expansion leg into 2026.
3. Long-Term Macro Trend
7. The higher-timeframe trend remains bullish despite local corrections.
8. BTC is expected to follow an impulse → correction → impulse pattern.
9. Macro upside targets remain positioned for new all-time highs.
4. Key Market Levels
Support Zones
10. $86,000 – $90,000 — primary liquidity-sweep region.
11. $92,500 – $94,000 — bullish retest confirmation zone.
Resistance Zones
12. $105,000 – $110,000 — mid-cycle rejection area.
13. $130,000 – $150,000 — macro expansion target range.
5. Trade Framework Summary
14. Short Setup: Enter after corrective rally into premium; target liquidity sweep.
15. Long Setup: Enter after BOS + demand retest; target macro continuation.
16. Structure favors a bullish expansion phase through 2026.

ElDoradoFx – BTCUSD WEEKEND ANALYSIS (15/11/2025)1️⃣ Market Overview
BTC ends the week around 95,700, continuing its strong bearish structure after the previous breakdown below 98,000. Price remains trapped inside a clear descending channel, forming consistent lower highs and lower lows on all timeframes.
The market attempted a recovery but was rejected again at 95,900–96,200, confirming ongoing seller control. Volume remains low heading into the weekend, increasing the risk of liquidity sweeps.
Bias remains bearish while BTC trades below 96,800.
⸻
2️⃣ Technical Breakdown
🔹 Daily (D1)
• Market remains in a sustained downtrend.
• Price rejected from the daily 20EMA and 50EMA zone.
• MACD continues deep in red, no bullish crossover yet.
• RSI ≈ 32–40 → still bearish, pointing toward deeper downside liquidity.
D1 Structure:
Lower high → lower low → continuation towards 94,000 and 93,000 liquidity.
⸻
🔹 H1 (1H)
• Bearish order flow intact.
• Every bullish pullback has been rejected at the 20/50EMA cluster.
• Trendline resistance near 96,200 holds perfectly.
• BOS confirmed to the downside at 95,600.
H1 Bias:
Bearish continuation unless a 1H close above 96,200–96,600.
⸻
🔹 15M–5M (Intraday)
• Micro pullbacks forming lower highs around 95,900.
• Supply zone between 95,900–96,150 producing multiple rejections.
• MACD shows short-lived bullish pushes with no follow-through.
• RSI capped under 50.
Intraday Bias:
Sell pullbacks into supply; avoid buying unless bullish confirmation appears.
⸻
3️⃣ Fibonacci Analysis (Last Swing)
Swing High → 96,800
Swing Low → 94,000
• 38.2% = 95,450
• 50.0% = 95,400
• 61.8% = 95,950
🎯 Golden Zone (Key Rejection Area): 95,400 – 95,950
This zone has already produced strong bearish reactions → high-probability sell zone.
⸻
4️⃣ High-Probability Trade Scenarios
📉 SELL SETUP (Primary Bias – HIGH PROBABILITY)
Sell Zone: 95,400 – 95,950 (Golden Zone)
Entry: Wait for rejection candle or bearish engulfing.
🎯 Targets:
• TP1: 94,800
• TP2: 94,000
• TP3: 93,200 (liquidity zone)
• TP4: 92,500
🛑 Stop Loss: Above 96,250
Why?
Golden Zone retest + downtrend + EMA alignment + channel resistance.
⸻
📉 Breakout Sell Setup (Continuation)
Trigger: Break & close below 94,800
Retest: 94,900–95,050
🎯 Targets:
• 94,000
• 93,200
• 92,500
🛑 Stop Loss: Above 95,400
⸻
📈 BUY SETUP (Countertrend – Lower Probability)
Buy Zone: 94,000 – 93,200
🎯 Targets:
• 95,000
• 95,800
• 96,200
🛑 Stop Loss: Below 92,800
⚠️ Note: Structure remains bearish → buy setups require bullish divergence.
⸻
5️⃣ Fundamental Watch
• Weekend liquidity low → expect stop hunts and fakeouts.
• No major news until early next week (US retail, FOMC speakers).
• DXY remains strong → pressures BTC further.
• Risk markets soft overall → crypto remains vulnerable.
⸻
6️⃣ Key Technical Levels
🔺 Resistance:
• 95,950
• 96,200
• 96,800 (bullish breakout level)
• 97,500
🔻 Support:
• 94,800
• 94,000
• 93,200
• 92,500 (liquidity + structure)
🌟 Golden Zone:
95,400 – 95,950
Breakout Triggers:
• Bullish Breakout: Above 96,800
• Bearish Breakout: Below 94,800
⸻
7️⃣ Analyst Summary
BTC maintains a strong bearish structure across all timeframes. Every bounce is corrective, and sellers remain dominant below 96,800.
The market is gravitating toward 94,000 and possibly 93,200 liquidity.
Best trade:
Sell the Golden Zone 95,400–95,950
or
Sell the breakdown 94,800.
Buying only makes sense at 94,000–93,200 with strong confirmation.
⸻
8️⃣ Final Bias Summary
Overall Bias: Bearish
• Below 96,800 → Sell rallies (preferred).
• Below 94,800 → Continuation to downside.
• Above 96,800 → Bullish shift begins.
⸻
🥇 ElDoradoFx PREMIUM 3.0 – PERFORMANCE 14/11/2025 🥇
📅 High-volatility day with mixed conditions, but strong recoveries and powerful live-session results.
━━━━━━━━━━━━━━━
🪙 XAU/USD (GOLD) Trades
❌ BUY –60 PIPS (SL)
🟢 BUY +110 PIPS
🟢 BUY LIMIT +60 PIPS
🟢 SELL +110 PIPS
❌ BUY –70 PIPS (SL)
🟢 BUY +110 PIPS
---
🎥 LIVE TRADING SESSION
🟡 BUY – BE
🟢 SELL +250 PIPS
❌ BUY –40 PIPS (SL)
🟢 BUY +60 PIPS
🟡 SELL – BE
🟢 SELL +180 PIPS
---
📈 SWING POSITION (From 05/11)
🟩 Floating: +2,850 PIPS
Still running strong.
━━━━━━━━━━━━━━━
💰 TOTAL PIPS GAIN: +710 PIPS
━━━━━━━━━━━━━━━
📊 12 Signals → 7 Wins | 3 SL | 2 BE
🎯 Accuracy: 70%
━━━━━━━━━━━━━━━
🔥 Another profitable day locked in.
👏 Congratulations if you profited!
✅✅✅🚀🚀🚀
— ElDoradoFx PREMIUM 3.0 Team 💼📈

BTC looking cookedHaven't traded BTC in quite some time, and it's finally starting to look interesting.
107 was my major level to hold or lose, and we have officially lost and perfectly back tested it.
We are currently in the GP for the top area and a well established daily support level. If this can't hold, there is no support until around 84k. I will be shorting for there if hourly closes below daily level begins happening. The 4hr level at 97k is a good SL to wait in see if more chop is needed but will re-enter ever loss of the daily level.
Below 84k the next levels to be looking for 67k, then 59k. If you haven't been through a BTC cycle and don't think it's possible, welcome to the meat grinder.

BITCOIN SHORT (EXPERIMENTAL)In a bear market scenario, Bitcoin might see extended periods of stagnation or decline, which could challenge its perception as a store of value or its role in a diversified investment portfolio. However, bear markets can also present buying opportunities for long-term investors, as they may view the price declines as temporary setbacks in Bitcoin's overall growth trajectory.

Bitcoin 100k scenarioA scenario where it gets to 100k by end of year. Just saving this up there))
needs to be led by the important moving averages (50ma, 200ma...). lets go!

Let's start with the up move nowIt had been a complex correction wave and a difficult one to predict in advance. The strcuture of ABC correction looks complete now with CD = 1/618 AB and 5 waves of C wave complete at around 96k levels.
The prices will go up form here again. The up move strcuture will tell us if its impulsive (new highs) or corrective under the larger picture. For now, BTC is going to reclaim 110k level back
btc await breakout#BTCUSD stands between the third pattern rejection which still holds drops till 101800 to reverse back on buy. We buy when breakout on M15-30 closure above 105541.
Breakout on M15-30 closure at 105541 buy, target 107300, SL 104511.
Below the rectangle 104500 holds strong bearish which will drop till 101800 to form new buy range.
