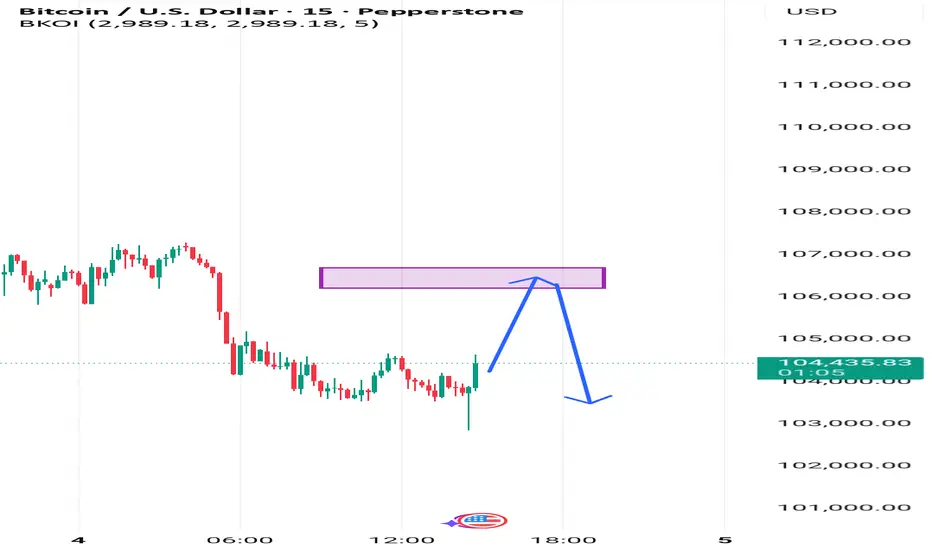
My analysis on BTC USD based on my technique I pass on propfirm📊 Bitcoin Analysis – CMP Zone Setup
I expect Bitcoin (BTCUSD) to test the , based on my CMP (Current Market Price) technique — a method I use to identify potential reaction areas and key levels from a technical perspective.
🔍 Technical Outlook:
Price is approaching a CMP zone that may act as a reaction point.
I’ll monitor closely for a bearish engulfing pattern as confirmation before entering a trade.
🎯 Trade Plan:
Stop Loss: 50 pips
Take Profit: 1:2 or 1:3 R:R
Setup Type: CMP Reaction + Engulfing Confirmation
⚠️ Disclaimer:
This analysis reflects my personal technical view and is not financial advice. Always conduct your own research before trading.
Trade ideas
BTCUSD - Bearish Rising Wedge - Path to 400k USDI expect the channel bitcoin is in to FBO to the upside and hit the blue top rail, then dump to 17k as a first stop on its descent
Not financial advice
Let's see. Will be a hard read.
150k is the sensible target but mania and overshoot looks like we could see 400k.

Long term what ifs. If or when we start moving to these levels we should see different types of rejections.
My real thought is that we start to form an extensive channel slightly pitched lower for a great amount of time. Either A massive flag long term or just a bear move before a dump.
All speculation as we could breakout tomorrow. Currently bearish based on what this top is telling me.

BTC/USD – Take Profit: 103,522.87BTC/USD – MACD Momentum Long Setup
Entry: 101,116.34
Stop Loss: 99,511.99
Take Profit: 103,522.87
Risk–Reward Ratio: 1 : 2.0
Technical Overview
Bitcoin is showing renewed bullish momentum following a MACD bullish crossover on the 4-hour chart.
The fast MACD line has crossed above the signal line, confirming a shift in market bias from consolidation to upside acceleration.
This crossover occurred near the psychological 100,000 USD support region, suggesting buyers are regaining control after a corrective phase.
Price has also reclaimed short-term EMAs, with increasing histogram bars on MACD signaling building momentum strength.
If momentum holds, BTC/USD could extend toward the 103,500 USD resistance zone, where previous highs align with the next liquidity cluster.
Key Confluences
MACD Bullish Crossover: Fresh momentum signal following multi-session consolidation.
Rising Histogram Bars: Momentum expansion supports continued upside.
Support Retest: Bounce from 99,800 – 100,000 USD area confirms structural demand.
Trend Alignment: Price now trading above both the 20 EMA and 50 EMA.
Market Context: Broader trend remains bullish on higher timeframes.
Trade Plan
Entry: 101,116.34 – confirmation after MACD line crossover.
Stop Loss: 99,511.99 – beneath psychological and structural support.
Take Profit: 103,522.87 – targets prior resistance and momentum extension zone.
Breakeven Rule: Move stop to entry once price reaches ~102,200 (+1R).
Scaling Option: Partial profits may be secured near 102,800 if momentum pauses.
Market Outlook
Momentum indicators support continued bullish bias as long as BTC holds above 100,000 USD.
Sustained MACD expansion with positive histogram values could trigger a move into the 103,500 – 104,000 region.
A close back below 99,500 USD would invalidate the setup and signal momentum exhaustion.
Summary
Bias: Bullish Momentum
Strategy: MACD Crossover / Momentum Expansion
Reward Potential: ≈ 2R
Market Context: Momentum shift from correction to trend continuation as bulls reclaim control near 100K support.
#BTCUSD #BitcoinAnalysis #MACDMomentum #CryptoTrading #TechnicalAnalysis #BTCSetup #MomentumStrategy #PriceAction

BITCOIN daily FALLING-WEDGEBitcoin is in a falling wedge and very likely can break above that in the coming days

$BTCUSD: Inside an ending diagonalBITSTAMP:BTCUSD : I believe this is an expanded flat correction for a Wave ii since the July 2025 high. The expanded flat has completed Wave A down to the August 2025 low, Wave B up to the Oct 6 high and we have been in an ending diagonal for Wave C of this ending diagonal since Oct 6.
The ending diagonal has completed 3 waves at the $98K-ish low. We're now in Wave 4 to the trendline (probably above $107K). Afterwards, I expect a Wave 5 down as the very last leg of this correction since the July 2025 high. Wave 5 in an ending diagonal can be truncated. So I'm guessing, after reaching the down-sloping trendline to complete Wave 4, a pullback to between 50% retracement (between $104K to slightly exceeding $98K) would end the entire correction and start Wave III up to new ATHs.

BTC Quick updatethe key zone are difficult to penetrate as you see it's been holding for a while on the prices , but maybe it's time for a quick downward movement BTC BTC IS to heading to100k!

BULLISH REVERSALThe bitcoin price has broken the trendline after a long downtrend. Buyers seem to take control for a short reversal. We are open to buy if the price retests on the demand level and confirms with valid candles. Lets wait for more confirmations before entering.

BTC & S&P500 Bearish Divergence + Recession Setup: Soft or Hard Over the past year, BTC, S&P500, and NASDAQ have all pushed into new local highs — but beneath the surface, momentum has been fading.
We’re now seeing significant bearish divergences across multiple timeframes, paired with macro conditions that historically precede recessions.
Meanwhile, the FRED US Recession Probability (RECPROUSM156N) is still very low (~1%), confirming the economy is expanding.
This creates a classic pre-recession, late-cycle environment:
Price peaks + fading momentum → technical warning
Low recession probability → macro risk building, but not yet realized
Let’s break this down technically and fundamentally 👇
📉 BTC – Technical Breakdown
Chart timeframe: Weekly
Key observation: Since the March 2024 peak (~$73k), BTC has been forming lower highs on RSI and MACD while price action remained near ATHs.
This creates a clear bearish divergence, suggesting buyer exhaustion despite continued inflows into ETFs.
Volume has also been declining — a classic sign of distribution.
📊 What this could mean:
BTC could see a correction back to the $52k–$55k support zone, which aligns with the 0.382 fib retracement from the 2023–2024 rally.
If a macro shock hits (recession / liquidity crunch), deeper retracement to $40k–$45k isn’t off the table.
📉 S&P500 – Technical Breakdown
Chart timeframe: Weekly
Key observation: Price printed new highs near 5,600 earlier this year, but RSI, MACD, and OBV all failed to confirm the move.
This is a textbook multi-month bearish divergence, visible since late 2023.
Additionally, breadth (percentage of stocks above their 200-day MA) has deteriorated — with mega caps masking broader market weakness.
📊 Key levels:
Support: 5,000 → 4,600 → 4,200
A break below 4,600 could confirm a mid-cycle correction or even the start of a bear phase if macro conditions deteriorate.
🏦 Macro – The Recession Factor
Recession probability: 1% → economy expanding, but risk is accumulating
Indicators: Yield curve inversion, slowing PMIs, credit pressures, fading earnings momentum
Interpretation: Market may remain elevated in short term, but these divergences + late-cycle signals suggest higher risk of future correction or capitulation.
Historically, when we see tightening liquidity, yield curve inversions, and disinflation, the setup often precedes a recession by 6–18 months.
Right now:
The 2s/10s yield curve remains inverted (a classic early warning).
Corporate earnings growth is slowing.
Consumer credit delinquencies are ticking higher.
The Fed is still cautious about cutting rates too early.
This creates a scenario where a recession could trigger capitulation — pulling risk assets (BTC, equities) down together before a potential Fed pivot sparks the next bull cycle.
🏦 UK Interest Rate Outlook
Context:
BoE base rate currently ~5% (late 2025)
Inflation easing but still above target (~3–4%)
Housing affordability tight, credit conditions stricter
🌐 Summary – Global Risk Cycle & Market Outlook
BTC and S&P500 are showing multi-timeframe bearish divergences: prices are near highs, but momentum indicators (RSI, MACD) are weakening, and volume participation is thinning. This signals a late-cycle market environment where risk of correction is elevated.
At the same time, the US Recession Probability (RECPROUSM156N) remains very low (~1%), confirming the economy is still expanding. This positions us in a pre-recession, risk-accumulation phase — technical warning signals exist well before macro recession indicators spike.
Looking at potential outcomes:
Soft Landing: Growth slows modestly, inflation eases, BoE and Fed make gradual rate adjustments → mild market correction, BTC/S&P stabilize, housing markets remain firm.
Hard Landing: Recession triggers stronger credit tightening and job losses → aggressive central bank rate cuts, sharper BTC/S&P drawdowns, temporary housing market dips, followed by potential buying opportunities.
UK Interest Rates: Currently ~5%, likely to remain elevated in the near term. Under a soft landing, rates may ease slightly (4.5–5%), while a hard landing could force sharper cuts (~3–3.5%), influencing mortgage affordability and market sentiment.
Key Takeaway:
We are in a late-cycle, high-risk environment: technical divergences + macro trends point to a possible correction or capitulation before the next liquidity-driven recovery. Investors should monitor momentum, macro signals, and interest rate trends closely to identify optimal entry points.

bitcoin can fall to between 25k to 50k USDBased on the selling pressure and fibonacci retracements, it can correct up to 2 levels - 25k or around 50k .

Bitcoin – Technical Outlook
🔹 Key Zone: 101,500 – 104,500
At the moment, price is trading within this key zone where strong buying and selling activity is taking place — a critical area that will likely determine the next major move.
🟢 Bullish Scenario (Uptrend)
If price breaks above and holds above 104,500, this would confirm a continuation of bullish momentum.
In that case, price is expected to move higher toward 120,040, with further potential extension toward 125,567.
📈 This zone is an important confirmation area that could signal the beginning of a new bullish leg.
🔴 Bearish Scenario (Downtrend)
However, if price drops below and stabilizes under 101,500, this would indicate a potential bearish reversal.
In that case, the price may move downward toward the support zone at 97,700 – 93,400.
Breaking below this area would confirm further bearish extension toward 88,080.
📊 Summary:
Currently, Bitcoin is trading inside the key zone (101,500–104,500).
A breakout above or below this range will likely define the next strong market direction — whether a bullish continuation or a deeper bearish correction.

Is BTC currently in a bull or bear market?Personally, I don't believe the four-year cycle for COINBASE:BTCUSD will remain valid indefinitely. There are many reasons, which I'll discuss later. However, this doesn't mean next year won't be a bear market. What influences bull and bear markets is the future macroeconomic environment, not halvings, miners, or OGs.
Whether COINBASE:BTCUSD is currently in a bull or bear market depends on several factors. Technically, a break below the yearly moving average would indicate a bear market, while holding above it would signal a turning point for the next upward trend. We are currently at a crucial starting point between a bull market turning into a bear market or a new bull market.
But this doesn't seem that important. The macroeconomic environment is unpredictable, and the present and future will not be as predictable as in ancient times. Why cling to outdated methods?
Structural markets are the future trend.
Small support levels warrant small positions, large support levels warrant large positions, and a break below warrants a stop-loss. These are simple trading rules, yet they often prove ineffective in the face of human nature.

Bitcoin Daily Analysis #11 – November 05, 2025 Scared? 😅
Good — pay close attention to how you feel these days and journal everything. The most valuable financial lessons come exactly from moments like these. 📖
As you can see, Bitcoin is under heavy selling pressure, and its sharp drop around the $100,000 zone has so far been supported by buyers.
If that support breaks again, you could consider opening a short position, but ⚠️ don’t hold it too long — the overall trend remains bullish, and a strong rebound could follow.
Around $104,000, we might see a risky long trigger, but only with tight risk management and a controlled position size.
If Bitcoin tests $104,000 and gets rejected, a deeper correction or even a sharp drop could follow.
We’re in a phase where the market could swing both ways — once it breaks out of this uncertainty, expect a powerful move. ⚡
Macro data and recent economic news still favor Bitcoin, and interestingly, during this decline, the big players have mostly stayed on the sidelines, with lower-than-average trading volume. 📈
No matter which way Bitcoin moves, your risk management will determine your success. 🎯
So avoid emotional decisions and let the chart structure guide you. 📊
Disclaimer:
This content is for informational purposes only and does not constitute financial or investment advice. © DIBAPRISM
Larry D.Kohn

BTCUSDMonthly candle close for oct is bearish but that bottom wick shows me weakness in sellers.
Nove should flip bullish (80%)
And if everything goes well in 1 to 2 months 130k should be here or higher.
Could be totally wrong and 89k come be here but thats lame.

BTCUSD BUY SETUP🎯 Entry Plan
Step 1 – Wait for Retracement
Be patient and wait for price to come back into the demand zone (around 100,000–99,500).
Do not enter while price is still retracing — you want confirmation inside the zone.
Step 2 – Confirmation Entry
On a lower timeframe (5M or 1M):
Watch for:
Liquidity sweep (price takes out a recent low inside the demand zone).
Change of Character (ChoCH) to the upside.
Bullish engulfing or strong momentum candle confirming buyers are active.
Step 3 – Entry Trigger
Enter long (buy) on the candle after the ChoCH confirmation.
This helps ensure you’re catching the start of the bullish leg.
Step 4 – Stop Loss and Take Profit
Parameter Placement
Stop Loss (SL) Below the demand zone (below 99,000)
Take Profit 1 (TP1) 103,000 (mid supply area)
Take Profit 2 (TP2) 104,500–105,000 (main supply area)
A typical risk-to-reward ratio here would be 1:3 or better.

BTC OUTLOOKDON'T USUALLY TRADE THIS PAIR BUT GIVING IT A SWING (PUN INTENDED)
DISCLAIMER:
The owner of this page is an authorised Representative under supervision of TD MARKETS (PTY) LTD, an authorised Financial Services Provider (FSP No. 49128) licensed by the Financial Sector Conduct Authority (FSCA) under the Financial Advisory and Intermediary Services Act (FAIS).
The FSP is licensed to provide advice and intermediary services in respect of Category I financial products, including but not limited to derivative instruments, long-term deposits, and short-term deposits.
All investment ideas are provided in accordance with the scope of the FSP's license and applicable regulatory requirements. Derivative instruments is a leveraged products that carry high risks and could result in losing all of your capital, and past performance is not indicative of future results.
This idea and any attachments are informational/education and does not constitute a recommendation to buy/sell.
No guarantee is made regarding the accuracy or outcome of this trade idea.
If you choose to accept this idea, please do so at your own risk.

The digital gold - BTC weekly update Nov 03 - 09thBitcoin shows a pretty similar structure to the alts, just in another context. The overall picture is that we are now in a larger corrective movement where we could drop to 40k again. The structure in the lower timeframes, as shown on the chart, show that a short-term rise is possible in the next days and weeks. Over the past week and the drop today we completed the flat pattern of the primary wave B with the completion of the intermediate wave C. For now therefore I expect the Bitcoin to perform a turn and a rise to the fibonacci extension levels shown on the chart. This scenario is supported by the correlation with other coins, the liquidation heatmap showing a bunch of liquidity above the current price and funding rates being lower than normal. RSI shows itself also near the oversold range and MACD turned only slightly negative during this drop. Overall this shows us a good environment to rise to 117k.
Alternatively a further drop below the low of the intermediate wave A would be possible, but as fibonacci levels of the elliott wave principle do not support these deep niveaus anymore, I think a turn is probable.

BTC has a plan!Hello everyone,
In financial markets, history always repeats itself — and if you don’t agree with this principle, my friend, you might as well stop reading here.
Bitcoin has always followed a specific pattern, and it’s once again moving according to that same roadmap. Historically, from one all-time high (ATH) to the next, Bitcoin has always taken a fairly consistent amount of time — between 1,428 and 1,477 days — before entering a bear market.
We’ve now reached that point in time.
On the monthly timeframe, classic price action analysis has always proven to be the most reliable approach. Right now, all the confirmations are showing clear bear market signals: RSI divergence and the closing of a bearish monthly candle both indicate the market is turning red.
If we look at it through Smart Money Concepts (SMC) on lower timeframes, the market has also given us a CHOCH (Change of Character) signal.
A Bitcoin scenario above $120,000 seems very unlikely, because realistically, even the current levels make $120K look like an unbelievable number. Any higher numbers should be left to time to decide.
Wish you all profitable trades!

$BTC SUNDAY UPDATE We’re still holding our short position BTC SUNDAY UPDATE
We’re still holding our short position from the last 85 days, and it’s been playing out exactly as planned.
Bitcoin dumped multiple times from the 116K–124K short range which has been our sell zone every time, and we’ve stayed patient, holding through every bounce.
Right now, BTC is trading around 110K, sitting just below the 1D 50 EMA, currently near 112.7K. If BTC breaks and holds above 112.7K, there’s a chance we could see 116K–117K, and that’s exactly where I’ll be adding more shorts. 🚨 My main target remains below 100K.
BANKS UNDER MASSIVE PRESSURE 🏦
Liquidity stress is building fast. The Fed may pause QT, but that doesn’t mean money is coming back. There’s no QE yet. Banks are struggling to stay liquid as repo borrowing just hit $50B in a single day and reverse repo usage spiked again.
That’s a clear sign the system is tightening. If this continues, we could see forced selling across risk assets. I’m still short on BTC until the Fed is forced to print again. That’s when the real rally begins. 💥
In simple terms:
🏦 Banks are showing signs of liquidity strain.
💸 QT is removing cash from the system.
📊 The Fed saw a surge in overnight borrowing.
#Bitcoin #BTC #Crypto #MarketUpdate #Liquidity #Fed

Today's Bitcoin Trading StrategyShort-term bullish core logic: Rapid accumulation of rebound momentum
(1) On-chain real-time funds: Strong short-term inflow validates the bottom
1.Hourly on-chain data shows that the net outflow of exchanges reached 1200 BTC (approximately 132 million US dollars), with 100-1000 BTC from whale addresses accounting for over 70%, which is a typical "bottom accumulation" signal. At the same time, the value of stablecoins increased by 42 million US dollars within 1 hour, and the USDT premium rate rose to 0.15%. The signs of short-term capital entry are significant. The SOPR indicator (realized profit / loss ratio) rose from 0.98 to 1.03, indicating that short-term traders have shifted from losses to profits, and the selling pressure has significantly weakened. This is highly consistent with the signal characteristics before the previous 108200 US dollar rebound.
(2) Technical aspect: Formation of minute-level trend reversal pattern
The 15-minute chart presents the "V-shaped reversal + volume coordination" feature: When the price recovered from 109300 US dollars to 110000 US dollars, the trading volume increased by 60% compared to the falling stage, forming a "volume-price synchronous recovery" structure. The 20-day moving average (109800 US dollars) has shifted from resistance to support, and forms a double support resonance with the integer level of 110000 US dollars. The RSI indicator on the 15-minute chart broke through the 50 strength-difficulty dividing line, and MACD formed a golden cross and the red bar began to spread, indicating a clear technical signal of short-term trend from short to long.
Today's Bitcoin Trading Strategy
buy:109000-110000
tp:112000-113000
sl:108000
Bitcoin(BTC/USD) Daily Chart Analysis For Week of Oct 31, 2025Technical Analysis and Outlook:
The trading session from last week was notably eventful. The Bitcoin market experienced significant volatility, fluctuating between the Mean Resistance level of 116,000 and the critical Mean Support level of 106,500. Currently, the price is actively navigating this range.
Current market analysis indicates a likelihood of a retest toward the Mean Support level at 106,500, with a primary focus on the potential for further downward movement towards the Mean Support level of 101,000. This trajectory may ultimately lead to our key objective of reaching the Outer Coin Dip at 97,000. It is, however, essential to acknowledge the robust rebound potential at these pivotal levels.

Bitcoin Bitcoin rejected the price at the support level of 107000, now in an uptrend at the 0.5 Fibonacci level, favoring a continuation of the long movement to the resistance at 114000.
BTC SELL?Market has been bullish for a long time, and there seems to be a possible reversal on Weekly.
Based on Daily TF, the market seems to be forming a possible reversal pattern which could lead to a possible reversal.
We could see SELLERS coming in strong should the current level hold.
Disclaimer:
Please be advised that the information presented on TradingView is solely intended for educational and informational purposes only.The analysis provided is based on my own view of the market. Please be reminded that you are solely responsible for the trading decisions on your account.
High-Risk Warning
Trading in foreign exchange on margin entails high risk and is not suitable for all investors. Past performance does not guarantee future results. In this case, the high degree of leverage can act both against you and in your favor
