Update BTCUSD Analysis This is an update to previous Analysis with Choch+ and OB Formed with 4H structure.
⚠️ Educational analysis — not financial advice.
#BTCUSD #Bitcoin #SilentScalpers #SmartMoneyConcepts #PriceAction #Crypto
Trade ideas

BTCUSD: Bearish Continuation & Short Signal
BTCUSD
- Classic bearish setup
- Our team expects bearish continuation
SUGGESTED TRADE:
Swing Trade
Short BTCUSD
Entry Point - 10376
Stop Loss - 10482
Take Profit - 10200
Our Risk - 1%
Start protection of your profits from lower levels
Disclosure: I am part of Trade Nation's Influencer program and receive a monthly fee for using their TradingView charts in my analysis.
❤️ Please, support our work with like & comment! ❤️

Bitcoin and Ethereum: Bullish and Bearish CountsIn this video, I updated the wave counts and discuss how Bitcoin and Ethereum can, at the same time, be both Bullish and Bearish. The summary is this:
Bullish:
The 2x 5-wave down is an ABC structure wave 2. Next move is wave 3 up.
Bearish:
The 1st 5-wave down is wave 1; the 2nd 5-wave down is wave 1 of 3. Next move is wave 2 of 3 up and then wave 3 of 3 down.
For the cryptos, it is important that Bitcoin will not fall below $98,500 in order for the Bullish scenario to hold.

BITCOIN daily FALLING-WEDGEBitcoin is in a falling wedge and very likely can break above that in the coming days

BIGGEST BEAR MARKET IN THE HISTORYI think before we see the biggest bear market in the history, we will be seeing another all the time high for BTC around 150k USD.
1. As you can see in our technical analysis, we are seeing BTC is forming a RAISING WEDGE which is a bearish pattern.
2. As you can see in our technical analysis, we are seeing the price is going up but the RSI is going down. It showing weakness for BTC.
3. This is a long term trading not short term. Lets wait for more signals to show for us to support this analysis. This is not FOMO or HYPE or any negative thinking for bitcoin. This is just my analysis.
This analysis might play or not. I'll be going back with this once it will play.
Always trade with your own risk. Lets go!

Bearish drop off?The Bitcoin (BTC/USD) is rising towards the pivot and could reverse to the 1st support.
Pivot: 103,498.50
1st Support: 95.526.48
1st Resistance: 111,232.24
Disclaimer:
The above opinions given constitute general market commentary, and do not constitute the opinion or advice of IC Markets or any form of personal or investment advice.
Any opinions, news, research, analyses, prices, other information, or links to third-party sites contained on this website are provided on an "as-is" basis, are intended only to be informative, is not an advice nor a recommendation, nor research, or a record of our trading prices, or an offer of, or solicitation for a transaction in any financial instrument and thus should not be treated as such. The information provided does not involve any specific investment objectives, financial situation and needs of any specific person who may receive it. Please be aware, that past performance is not a reliable indicator of future performance and/or results. Past Performance or Forward-looking scenarios based upon the reasonable beliefs of the third-party provider are not a guarantee of future performance. Actual results may differ materially from those anticipated in forward-looking or past performance statements. IC Markets makes no representation or warranty and assumes no liability as to the accuracy or completeness of the information provided, nor any loss arising from any investment based on a recommendation, forecast or any information supplied by any third-party.

BTC Quick updatethe key zone are difficult to penetrate as you see it's been holding for a while on the prices , but maybe it's time for a quick downward movement BTC BTC IS to heading to100k!

BULLISH REVERSALThe bitcoin price has broken the trendline after a long downtrend. Buyers seem to take control for a short reversal. We are open to buy if the price retests on the demand level and confirms with valid candles. Lets wait for more confirmations before entering.

BTC & S&P500 Bearish Divergence + Recession Setup: Soft or Hard Over the past year, BTC, S&P500, and NASDAQ have all pushed into new local highs — but beneath the surface, momentum has been fading.
We’re now seeing significant bearish divergences across multiple timeframes, paired with macro conditions that historically precede recessions.
Meanwhile, the FRED US Recession Probability (RECPROUSM156N) is still very low (~1%), confirming the economy is expanding.
This creates a classic pre-recession, late-cycle environment:
Price peaks + fading momentum → technical warning
Low recession probability → macro risk building, but not yet realized
Let’s break this down technically and fundamentally 👇
📉 BTC – Technical Breakdown
Chart timeframe: Weekly
Key observation: Since the March 2024 peak (~$73k), BTC has been forming lower highs on RSI and MACD while price action remained near ATHs.
This creates a clear bearish divergence, suggesting buyer exhaustion despite continued inflows into ETFs.
Volume has also been declining — a classic sign of distribution.
📊 What this could mean:
BTC could see a correction back to the $52k–$55k support zone, which aligns with the 0.382 fib retracement from the 2023–2024 rally.
If a macro shock hits (recession / liquidity crunch), deeper retracement to $40k–$45k isn’t off the table.
📉 S&P500 – Technical Breakdown
Chart timeframe: Weekly
Key observation: Price printed new highs near 5,600 earlier this year, but RSI, MACD, and OBV all failed to confirm the move.
This is a textbook multi-month bearish divergence, visible since late 2023.
Additionally, breadth (percentage of stocks above their 200-day MA) has deteriorated — with mega caps masking broader market weakness.
📊 Key levels:
Support: 5,000 → 4,600 → 4,200
A break below 4,600 could confirm a mid-cycle correction or even the start of a bear phase if macro conditions deteriorate.
🏦 Macro – The Recession Factor
Recession probability: 1% → economy expanding, but risk is accumulating
Indicators: Yield curve inversion, slowing PMIs, credit pressures, fading earnings momentum
Interpretation: Market may remain elevated in short term, but these divergences + late-cycle signals suggest higher risk of future correction or capitulation.
Historically, when we see tightening liquidity, yield curve inversions, and disinflation, the setup often precedes a recession by 6–18 months.
Right now:
The 2s/10s yield curve remains inverted (a classic early warning).
Corporate earnings growth is slowing.
Consumer credit delinquencies are ticking higher.
The Fed is still cautious about cutting rates too early.
This creates a scenario where a recession could trigger capitulation — pulling risk assets (BTC, equities) down together before a potential Fed pivot sparks the next bull cycle.
🏦 UK Interest Rate Outlook
Context:
BoE base rate currently ~5% (late 2025)
Inflation easing but still above target (~3–4%)
Housing affordability tight, credit conditions stricter
🌐 Summary – Global Risk Cycle & Market Outlook
BTC and S&P500 are showing multi-timeframe bearish divergences: prices are near highs, but momentum indicators (RSI, MACD) are weakening, and volume participation is thinning. This signals a late-cycle market environment where risk of correction is elevated.
At the same time, the US Recession Probability (RECPROUSM156N) remains very low (~1%), confirming the economy is still expanding. This positions us in a pre-recession, risk-accumulation phase — technical warning signals exist well before macro recession indicators spike.
Looking at potential outcomes:
Soft Landing: Growth slows modestly, inflation eases, BoE and Fed make gradual rate adjustments → mild market correction, BTC/S&P stabilize, housing markets remain firm.
Hard Landing: Recession triggers stronger credit tightening and job losses → aggressive central bank rate cuts, sharper BTC/S&P drawdowns, temporary housing market dips, followed by potential buying opportunities.
UK Interest Rates: Currently ~5%, likely to remain elevated in the near term. Under a soft landing, rates may ease slightly (4.5–5%), while a hard landing could force sharper cuts (~3–3.5%), influencing mortgage affordability and market sentiment.
Key Takeaway:
We are in a late-cycle, high-risk environment: technical divergences + macro trends point to a possible correction or capitulation before the next liquidity-driven recovery. Investors should monitor momentum, macro signals, and interest rate trends closely to identify optimal entry points.

bitcoin can fall to between 25k to 50k USDBased on the selling pressure and fibonacci retracements, it can correct up to 2 levels - 25k or around 50k .

BTCUSDMonthly candle close for oct is bearish but that bottom wick shows me weakness in sellers.
Nove should flip bullish (80%)
And if everything goes well in 1 to 2 months 130k should be here or higher.
Could be totally wrong and 89k come be here but thats lame.

BTCUSD BUY SETUP🎯 Entry Plan
Step 1 – Wait for Retracement
Be patient and wait for price to come back into the demand zone (around 100,000–99,500).
Do not enter while price is still retracing — you want confirmation inside the zone.
Step 2 – Confirmation Entry
On a lower timeframe (5M or 1M):
Watch for:
Liquidity sweep (price takes out a recent low inside the demand zone).
Change of Character (ChoCH) to the upside.
Bullish engulfing or strong momentum candle confirming buyers are active.
Step 3 – Entry Trigger
Enter long (buy) on the candle after the ChoCH confirmation.
This helps ensure you’re catching the start of the bullish leg.
Step 4 – Stop Loss and Take Profit
Parameter Placement
Stop Loss (SL) Below the demand zone (below 99,000)
Take Profit 1 (TP1) 103,000 (mid supply area)
Take Profit 2 (TP2) 104,500–105,000 (main supply area)
A typical risk-to-reward ratio here would be 1:3 or better.

BTCUSD D OutlookIn many markets if not all, a change in price structure such as bearish or bullish is basically determined when price takes its last high low in a bullish market, or a lower high in a bears market.
In this scenario on Daily timeframe on BTCUSD we can visually tell that a HIGHER LOW standing at price level 98,337 hasn't yet been taken out, through this we understand that we are still in a bullish momentum on btcusd with a corrective pullback towards a buying level.
In this sense with the high manipulations happening we should likely understand that before great momentum the market should grab liquidity or accumulate as much orders that gives it enough strength or liquidity to push to the opposit side of the correction..
Therefore, if price doesn't raid price level 98,337 or break below this price level, we should atleast expect some good reversal signs into bullish momentum.
All on all, it's just an insight, what do you think?

BTC OUTLOOKDON'T USUALLY TRADE THIS PAIR BUT GIVING IT A SWING (PUN INTENDED)
DISCLAIMER:
The owner of this page is an authorised Representative under supervision of TD MARKETS (PTY) LTD, an authorised Financial Services Provider (FSP No. 49128) licensed by the Financial Sector Conduct Authority (FSCA) under the Financial Advisory and Intermediary Services Act (FAIS).
The FSP is licensed to provide advice and intermediary services in respect of Category I financial products, including but not limited to derivative instruments, long-term deposits, and short-term deposits.
All investment ideas are provided in accordance with the scope of the FSP's license and applicable regulatory requirements. Derivative instruments is a leveraged products that carry high risks and could result in losing all of your capital, and past performance is not indicative of future results.
This idea and any attachments are informational/education and does not constitute a recommendation to buy/sell.
No guarantee is made regarding the accuracy or outcome of this trade idea.
If you choose to accept this idea, please do so at your own risk.

BTCUSD Bulls Aim Higher: Buyers Eye Breakout Toward $107,500Hello traders! Let’s take a look at the current BTCUSD structure. After an extended corrective phase within a descending movement, the market found solid support near the $100,000–$100,200 Buyer Zone, which aligns with both the horizontal Support Level and the lower boundary of the broader structure. This zone has repeatedly triggered strong buying reactions in the past, confirming it as a key demand area. Recently, Bitcoin began forming a bullish correction channel, where price has been developing higher highs and higher lows, suggesting early signs of trend recovery. Within this structure, buyers successfully defended the Buyer Zone, followed by a steady rise toward the $107,000–$107,500 Resistance Level — a zone that previously acted as a Seller Zone during prior rejections. At the moment, BTCUSD is consolidating inside this ascending channel, trading slightly below resistance. The market may attempt another push toward TP1 at $107,500, which aligns with the upper resistance line and marks a potential short-term target. If price manages a confirmed breakout above this level, we could see further continuation toward the next resistance around $111,000. However, if the price faces rejection at the current resistance, a temporary pullback toward the Support Line or Buyer Zone ($100,200–$101,000) could occur before the next wave of growth. The structure remains bullish as long as Bitcoin stays above the ascending Support Line. Please share this idea with your friends and click Boost 🚀

Bitcoin BuyBased on the current financial landscape, a compelling reason to buy Bitcoin now is its unique position as a hedge against monetary devaluation, amplified by specific 2025 catalysts. We are seeing major institutional adoption from firms like MicroStrategy and JPMorgan clash with significant sell-offs from long-term "whales," creating notable price volatility. This temporary pressure, however, occurs alongside a fundamental shift: the establishment of a clearer U.S. regulatory framework and the proposed "tariff dividend" that could inject fresh liquidity into the economy. With the Federal Reserve also anticipated to cut interest rates, these macro trends are poised to drive capital toward scarce, non-yielding assets. Essentially, you are buying into a digitally verifiable store of value during a period of short-term turbulence, positioning for a future where institutional demand and expansive fiscal policy are expected to converge.

BTCUSD — All Targets HitCORE5 Market Note
- Market Structure Mapping (MSM)
Bitcoin (BTCUSD) hit our weekend targets early and bounced from the volume fractal at 106.463.
Price still trades inside the bearish range from 116.432 (high) to 98.952 (low) — the same structure carried over from last week.
BTC is now testing the midrange zone, trading lower within the daily structure.
MSM shows a sell reaction from the fractal, but we still need a proper shift in structure before bias confirms.
For now, it’s a waiting game — the London session already delivered strong moves, so patience remains the higher-probability play.
- Volume Flow Analytics (VFA)
The weekly fractal near 100.996 has absorbed nearly five days of price action — a clear zone where buyers stepped in with size.
Above, the 106.463 fractal marks where sellers defended, creating two strong reference points that now frame the market.
These levels must break before any clear directional bias forms.
Until then, it’s still a waiting game.
- Macro Context
The U.S. dollar softened as traders expect more Fed rate cuts ahead, while Washington moves closer to reopening the government.
That calmer tone helped risk markets rebound — Bitcoin included.
If yields stay near 4.1% and confidence keeps building, crypto has room to recover.
But a sudden dollar rebound could flip sentiment fast.
🧠 CORE5 RULE: The next move doesn’t need you — it needs confirmation.
— CORE5DAN
Institutional Logic. Modern Technology. Real Freedom.

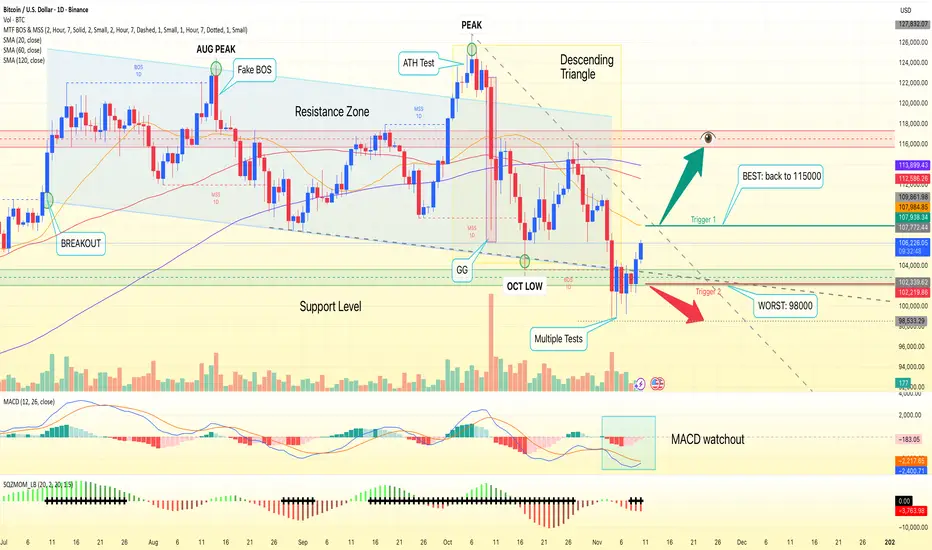
BTC Descending-Triangle Risk Bitcoin’s 1D chart remains in a downtrend from the $127,500 peak, with price capped beneath the 20/60/120-day MAs and volatility compressing. Structure is a clean descending triangle: a horizontal base at $102,500 and a series of lower highs, with $110,000 acting as near-term supply. After a brief undercut, price is attempting to recover, but the moving-average cluster between ~$108,000 and $114,000 still forms a heavy ceiling.
Primary path: sellers defend $108,000–$110,000 and force a fresh breakdown through the $102,500 floor. A daily close below $102,400—or more decisively, a break-and-hold under $102,000—would confirm continuation, opening the psychological $100,000 handle, then $98,400. That aligns with the triangle’s bearish follow-through and the still-subzero MACD despite fading downside momentum.
Alternative: if buyers reclaim resistance, a daily close above $114,000 would signal a structural shift and invite a squeeze toward $114,500 and the prior range high near $115,000. Aggressive bulls can look for an early momentum trigger on a daily close above $108,100, but expect chop into the MA cluster. For positioning, longs are invalidated on a sustained move below $100,000, while shorts are invalidated on a close above $115,000.
This is a study, not financial advice. Manage risk and invalidations
Macro liquidity benefits have taken effectThe US Senate has reached an agreement to end the federal government's "shutdown", extending the funding until January 30th next year. This shutdown had led to a tightening of liquidity in the money market, and with the agreement reached, TGA funds will be gradually released, directly improving the market liquidity environment. As a risk asset sensitive to liquidity, Bitcoin has responded first, breaking through the $106,000 whole number level. The expectation of loose liquidity will continue to provide upward momentum in the future. At the same time, the market expects a higher probability of the Fed cutting interest rates in December, further reducing the opportunity cost of holding Bitcoin.
Bitcoin trading strategy
buy:105000-105500
tp:106000-106500
sl:104000

$BTC Monthly ViewWe are at the very beginning of the bear market.
Even if we have a 2nd Manipulation (NEW ATH), that's not necessarily happening, as we've already grabbed the liquidity but know that new ATH will not change the analysis.

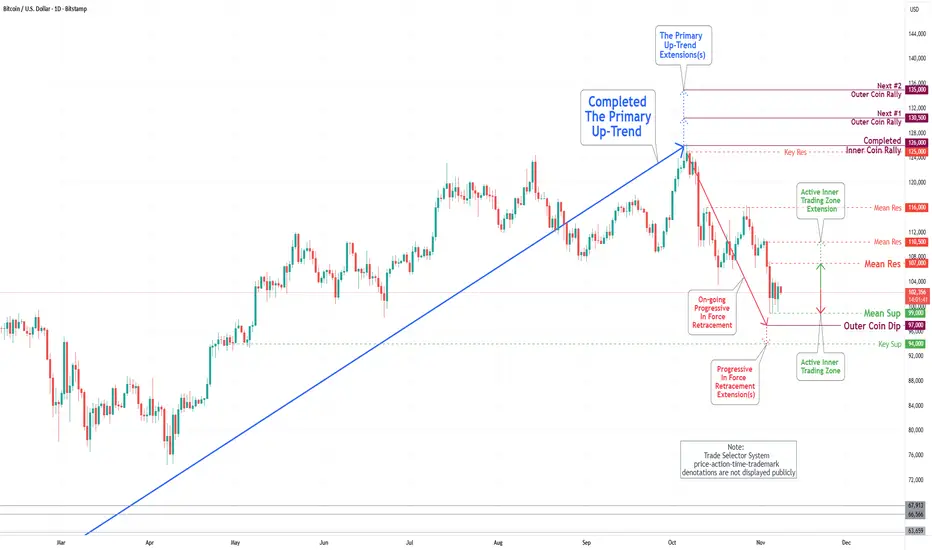
Bitcoin(BTC/USD) Daily Chart Analysis For Week of Nov 7, 2025Technical Analysis and Outlook:
In the previous trading session, the Bitcoin market experienced a notable drawdown over the past week, with the Mean Support established at 101,000, around which trading activity was concentrated. Presently, the price is actively maintained within the range defined by the Mean Resistance at 107,000 and the Mean Support at 97,000.
Current market analysis suggests the likelihood of a retest toward the Mean Support level at 99,000, with a primary emphasis on the potential for further downward movement toward the Outer Coin Dip at 97,000, which may extend to the Key Support level at 94,000. Nonetheless, it is vital to recognize the substantial rebound potential present at these critical levels.
BTC to fall My thoughts on BTC. Looking for a big drop to around 77k before bouncing back up. Looking very bearish at the moment. Will be a great opportunity to buy in at 77k or around that area.
I am not an expert just my thoughts.

BITCOIN's PUMPs are Getting LARGER this Bull Market...However, it may take a bit longer to realize those expansionary moves.
If Bitcoin adheres to the established cycle pattern, we can anticipate a minimum surge of 103% that should carry us into the fourth quarter of this year.
Consolidation ----> Fake breakdown ----> then expansion.
Are you ready?
