BTCETH.P trade ideas

BTCUSD - Bullish ReversalBTCUSD is making Bullish Reversal after RSI Divergence, will it break through to reach target?
Entry, Stop Loss & Take Profit are mentioned.

Bitcoin – Short-Term Outlook at Key LevelsBitcoin – Short-Term Outlook at Key Levels
Hello traders,
BTC is consolidating around the rising trendline on the daily chart, showing a firm rejection at this level. The broader structure remains in line with the scenario I shared previously, but here’s an updated view to refine short-term opportunities.
The channel is still the main focus. Recent sideways price action has formed a key support–resistance zone, which will decide the next short-term move:
113.3k resistance: A breakout here would confirm fresh long positions.
108.8k support: A breakdown would trigger short opportunities.
Should support fail, the medium-term bias shifts to the bearish path outlined earlier, with potential downside towards the 9x region, supported by the larger timeframe structure.
That’s my current outlook for BTC in the short term. Manage risk carefully, and let’s see how price reacts at these critical levels. Share your view in the comments – do you see BTC breaking higher or lower?

Bitcoin longEntry 108300$
Sl 107300.
That is my invalidation for this long position .
I think a push to the upside will commence during the upcoming week.

Btcusd buy from support zone with money mangment if the support holds a bulish continuation is highly likely.

btc some profit under very hard times to stay over 110ka very good chance to get some , target is not 100, could be higher or lower, but stop lose is perfectly made, and tight

BTC/USD – Support Bounce With Upside Targets.....Bitcoin is currently holding above a key support zone at $105,800 – $106,200, where buyers are stepping in strongly. Price is consolidating at this level and showing early signs of accumulation.
🔑 Key Levels
Support (Entry Zone): $105,800 – $106,200
Resistance Zone: $118,800 – $120,000
Target 1: $113,000
Target 2: $116,000
Target 3: $120,000 – $122,000
🎯 Trade Setup (Bullish Plan)
Entry: Near $106,000 support retest
Stop-loss: Below $105,000
Target Points: 113K → 116K → 120K+
📊 Risk–Reward Ratio (RRR)
TP1: ~1:3
TP2: ~1:5
TP3: ~1:7+
⚡ Technical Basis
Strong bounce from support level
Volume profile shows demand concentration below $106K
Breakout from consolidation can fuel move toward higher targets
👉 Bias: Bullish above $106,000 | Bearish only if price breaks below $105,000
📌 This chart is for educational purposes only – not financial advice.

BTCusdBTC is attempting to move higher after finding support around the Fibonacci golden ratio on the M30 and H1 timeframes. Price action suggests a potential continuation if support holds.

Bitcoin Strategy SharingThe market was relatively quiet over the weekend due to low trading interest. The overall volatility was minimal, and there wasn't much room for maneuver. I previously recommended opening a long position below 108,000. The price has now reached my expected level, around 110,000. For those who followed my lead, please pay attention to your positions. If you are prudent and conservative, you can reduce your holdings and wait to see if the market breaks through this level.
Bitcoin Strategy
The weekend market didn't fluctuate much, so you can choose not to trade and enjoy the weekend. You don't need to seize every ups and downswing. If you do decide to trade, I still recommend opening long positions on pullbacks. You can stick with my previous strategy and open long positions below 108,000. For bearish short positions, I think you should consider opening above 111,000. If the rebound isn't strong, there won't be much room for decline.
My thoughts are for reference only. Your specific trading decisions will be based on your own circumstances.

BTC Long
Support
Bottom of my imaginary 'grid'
Revenge
Do the opposite of what I do. ALWAYS
Enter buy limit order at $108,629

BTCUSD- UpdateLooking for re-entry opportunities:
On a retest of support at 108,668 zone for continuation to the upside.
Or on a break and retest of resistance around 109,600 – 110,000 for further bullish momentum.
Targets toward the 110,800 zone if price holds above support.

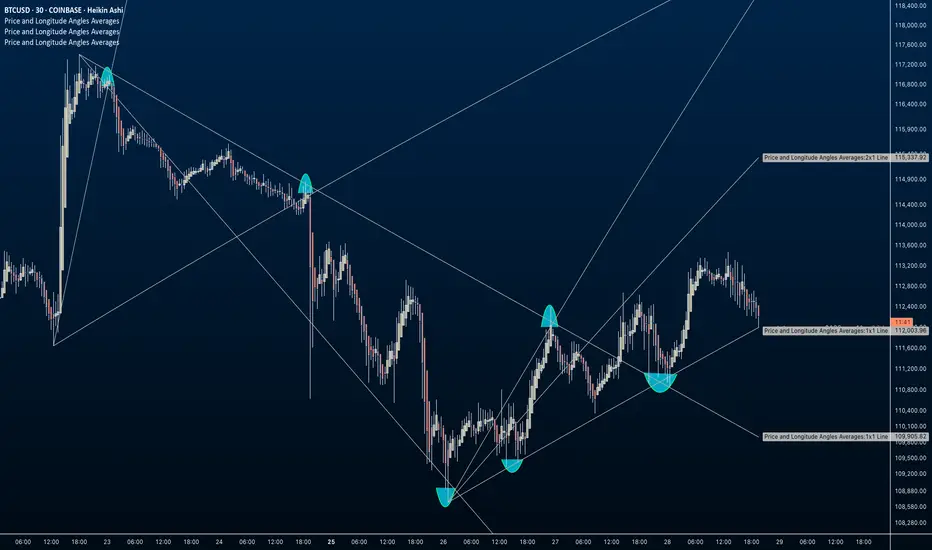
BTC: How to Setup Price and Longitude "Moon" AnglesChart: BTCUSD, 30m Heikin Ashi (UTC)
Indicator: Price and Longitude Angles (Open Source)
Attribution: Inspired by Patrick Mikula’s interpretation of Gann’s use of planetary longitude in market analysis. Fully open source for anyone to explore, test, or adapt.
This walkthrough demonstrates how to configure the script to study Moon longitude as price geometry. The aim is to provide a repeatable setup for observing how Moon angles from highs and lows can act as reference points for support and resistance. There are other features of this indicator that are not covered in this post.
Note: The aqua arcs visible in this chart are not part of the indicator. They were manually drawn to highlight where price touched or balanced against these slopes for educational clarity.
🛠 How to Reproduce the Moon Angles on this BTC 30min Chart
1. Load the indicator — when it initializes, you’ll be prompted to select a pivot high or low.
2. The default view will show the Sun angle with the Longitude Relationship Table and Orbital Colors visible. For this walkthrough, disable both of those.
3. Select the Moon: To focus on one body, choose it in both dropdowns.
If two different planets are chosen, the script averages their longitudes.
4. In Price Per Degree, enter 100 — mapping 1° of Moon longitude to $100 of price.
5. Enable the angles you want to observe — here, the 1x1, 2x1, and 8x1 were used.
(Optional) Draw arcs manually to mark where price touches or balances against the angles. These are annotations for teaching, not script outputs.
🔍 Observations
The 1x1 and 2x1 slopes from both highs and lows often lined up with price as support or resistance.
The aqua arcs emphasize those interactions, showing balance points where price paused or pivoted.
📐 What the Angles Mean
1x1 (45° equivalent): For every 1° of Moon longitude, $100 is added in price. This creates a slope where price and longitude advance in equal proportion.
2x1: The line is steeper — price advances at twice the rate relative to longitude (i.e., $200 per 1°).
8x1: Much flatter — price advances slower relative to longitude ($100 spread across 8°).
These ratios create families of angles that can act as dynamic support or resistance lines, depending on whether they’re drawn from a high or low.
The Moon advances ~13° per day
🌙 Why Use the Moon for Angles?
Skepticism toward astro-trading concepts is understandable. Many dismiss them as pseudoscience. I shared that doubt initially while diving into Patrick Mikula's research on W.D Gann's methods, which prompted me to build this indicator as a testable tool rather than blind faith.
At its core, planetary movements follow predictable cycles untouched by human bias or market noise. Consider the Moon's gravitational pull: it drives ocean tides with undeniable regularity, proving celestial forces can impact earthly systems in measurable ways.
These cosmic rhythms—rooted in orbital mechanics—repeat with precision, offering a reliable dataset for analysis. By mapping planetary longitudes to price ratios, we generate quantifiable angles and fans that allow backtesting of potential correlations with market turns. This isn't about fortune-telling; it's an empirical lens for spotting harmonic patterns in price action, complementing traditional technicals like volume or oscillators. Use it to validate ideas objectively, and let the data speak for itself.
🎓 Educational Takeaway
This walkthrough is about configuration and study. It shows how Moon-based geometry can be applied as an overlay on BTCUSD to observe possible balance points. The arcs are simply annotations to highlight touches. No signals or forecasts are implied.
📖 For More Information
For readers interested in the historical background:
Patrick Mikula, Gann Scientific Methods Unveiled, Vol. 2
Chapter 5: W.D. Gann’s Fourth Dimension of Market Movements
This script is shared for study and learning. It does not constitute financial advice.
Why Bitcoin (BTC) Will Likely Fill the Downside Imbalance After Bitcoin just made a sharp move up, liquidating short positions across the board — but if you think the pump is here to stay, think again. Let’s break down why BTC may be headed right back down to fill the imbalance it just created.What we just witnessed was a classic liquidity grab. Retail traders piling in with shorts at the local highs created a liquidity pool — and smart money took advantage. The sudden push up wasn’t organic; it was engineered to stop out shorts, triggering a cascade of liquidations and buy stops.But here's the key: in doing so, BTC left behind a significant imbalance — or Fair Value Gap — to the downside. If you're not familiar, imbalances are areas on the chart where price moved too quickly in one direction, leaving low-volume zones with inefficient pricing. These gaps tend to get filled more often than not, because the market seeks equilibrium. After a liquidity grab, smart money usually has no reason to sustain the move immediately — instead, they want to mitigate risk. That often means bringing price back to re-test the origin of the move and fill in the inefficient price action — especially if there’s confluence with a previous demand zone or breaker block.Don’t get caught chasing the pump. Remember, smart money moves in layers — liquidity grabs, imbalance fills, and then continuation. Until that downside inefficiency is addressed, the move isn’t complete.

BTC Ready to strong fallBTC is poised for a big drop to the 200 EMA. Close your positions and prepare for a strong entry in October.

Bitcoin at \$105,000Bitcoin’s sharp decline is still ongoing, and it will likely drop to the \$105,000 zone. If a strong support doesn’t form there, we might even see Bitcoin at \$100,000.

BTC Bearish Signal. 1D Double-Top Break with RetestMy last post was about how I was hoping to catch the retest of the 1D Double Top bullish wave to 112.3K, well now that position is DONE! . It has hit my target TP.
To continue, I have entered a Short at 112.1K with a Stop Loss at 113K , which is right above the short order block. I was able to enter at a good position this morning because i caught a 15m Reversal Candle with a declining volume during the push up. Not long after that, the 15m timeframe shows a Head and Shoulders Pattern with agreement with its volume. and lucky for me I entered at the head! In the hopes of having a TP at 106.9K (or even more!). This TP is based on the minimum objective of the Reverse Cup and Handle formation in 4H.
In this position, the first challenge would be breaking the Support Line at around 109.5K , which is quite significant as it was touched a handful of times.
When the price reaches 107K i will monitor the momentum to see if I should take the TP at 106.9K or extend my TP to 99.8K . Because right now there is a Double-Top minimum objective of 99.8K . I also did a Fibonacci Analysis that shows it actually might go lower than 99.8K. However, to me, it all depends on the price action then. I don't wanna be greedy and we can always set up new positions later on.
Happy Trading!

Bitcoin Strategy: Oversold Rebound Looking at 110,000Bitcoin has been undergoing continuous adjustments, with a significant downward trend. The recent strategy of shorting with the trend is correct.
In the short term, the market has fallen below the 110,000 mark, suggesting a potential rebound after an oversold period. Consider opening long positions below 108,000. A rebound is expected in the short term, with the initial target at 110,000.

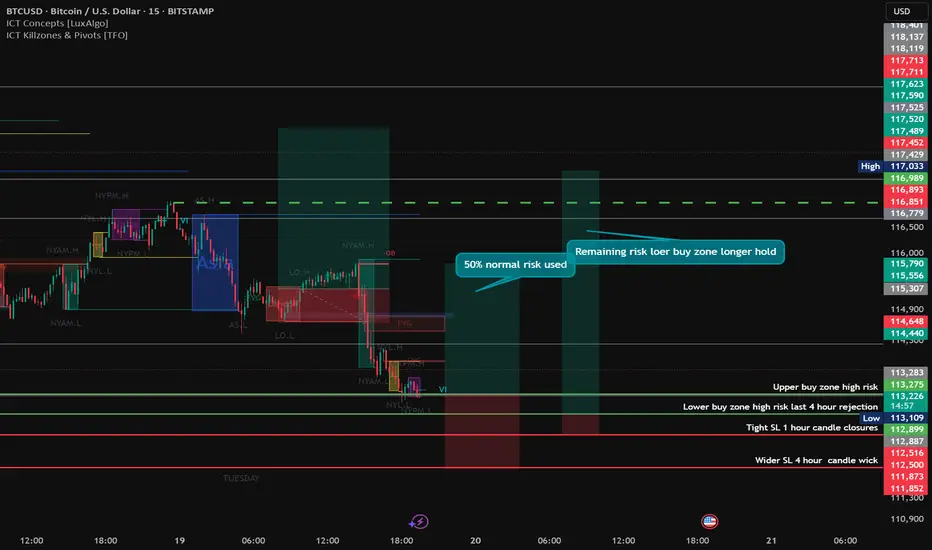
High Risk BTC trend reversal trade idea🚀 BTC/USD Trade Setup 🚀
Looking at a counter-trend opportunity here 👀. Risk is fully managed according to my profile and spread across the buy zone.
⚡ High-Risk Setup Alert ⚡
Using previous 4H & 1H zones as entry points
Targeting order blocks
🎯 First position: 1:1.75 RR
🎯 Second position: 1:12 RR (longer hold)
As always: risk management first. I’ll look to secure breakeven as soon as possible. If SL gets hit—no stress, it’s just part of the game. ✅
Orders are placed → now it’s set and forget. Remember:
📌 If you’re glued to the charts, it usually means one of three things:
You don’t trust your own analysis
You’ve over-risked
You’re just following a signal
👉 Any of those can blow an account.
Patience & discipline win long-term. Let’s see how this plays out. 💪
Bitcoin Confirms Downtrend – Short Bias in PlayBitcoin Confirms Downtrend – Short Bias in Play
Hello traders,
BTC has shown strong bearish momentum, breaking below a key support and falling out of the rising channel. With price now holding firmly beneath this area, the downtrend has been confirmed.
The focus now is on waiting for a pullback to find better short entries. The 111k level is a key zone to watch, where a retest of the broken channel could provide an ideal entry, creating a clean Dow structure for further downside.
Short scenario: Entry around 111k, with a target near 105k.
Long reaction trade: Around 105k, a small long can be considered to capture a short-term bounce as liquidity is absorbed, also offering relief for any trapped short positions.
The medium-term bias remains firmly bearish until structure changes.
That’s my perspective on BTC going forward. Manage risk carefully and share your thoughts in the comments – do you see further downside or a potential reversal?

BTC USD Long waiting signalI think a movement from Jan/ Feb 2024 might be repeating in real time.
Going only if the consolidation repetition took place, and i might take a long at the low, with lower risk.
Update when needed.

BTC HTF ANALYSISAs we can see in daily time frame market is strong bearish if any 4H candle will close above 108900 then on a retest we can look for buys till next retest which is near about 1130000 and all sell side liquidities had been done except 107270 which is still pending so market can keep it for future or can hunt and continue towards hunt sell side liquidity.

BTC has a secret, and that's why everyone is making money🚨 BTC has a secret, and that's why everyone is making money.
In my last idea, I mentioned that Bitcoin could be on the verge of starting its bearish phase if it loses the $108/110k zone . At the same time, several altcoins are showing patterns that could anticipate strong upward moves, so this scenario could fit perfectly.
But the key remains clear:
👉 Breaking down below $108k.
Everything else is secondary.
Why $108k?
Many of you have asked me:
"Why such an obsession with the $108k level? Isn’t it just another support?"
The truth is, it’s not just another support.
There are technical and statistical reasons why this level is so important. If it fails, the chances of a sharp drop in price increase dramatically. Historically, this level has been a turning point for Bitcoin many times.
For years, Bitcoin has seemed to follow a hidden pattern , moving in steps that very few traders notice , but those who do can take advantage of it in a very profitable way.
The 15% Secret 📊
Let me show you an example.
Why did I close my last idea near $120k instead of holding longer? Because I knew $124k was going to be a key level to sell, and I preferred to exit safely before it.
Here’s why.
When you map Bitcoin’s historical highs and lows, something fascinating appears:
👉 Each support and resistance level is separated by roughly 15%.
Can you see the pattern?
It looks like chaos at first, but then you realize there’s an order inside the disorder. Every major bounce or rejection tends to happen right around these 15% intervals.
That’s why I knew $124k would be critical. And that’s why $108k is not “just another level.”
What’s Next?
If Bitcoin holds above $110k and pushes higher, the next relevant target is around $141k.
But if you’re looking for trades now, any long near the $108-110k area could offer a move back to $120k–$124k, giving you a potential reward of 4-5 times your risk if you keep your stop tight around $105k.
This is what makes trading exciting : once you identify the levels where institutions and algorithms are buying and selling, you stop trading blind. You stop standing in the middle of the storm, and instead, you learn to move with it.
✨ Final Thought
Every chart tells a story. At first, it looks messy. But with the right perspective, patterns appear, and what seemed like noise turns into opportunity.
That’s the passion of trading, finding order in the chaos.
If you want to learn more, feel free to subscribe to my website newsletter. I'll share more educational insights and ideas to learn how to trade in the market.

BTCUSD Outlook: Key Breakout at 113K and Trading Scenarios AheadScenario 1 – Bullish Continuation
Price has broken above the minor supply zone around 112,800 – 113,000. If this breakout is confirmed with a valid retest, the next upside target is the supply zone at 115,000 – 115,500 (Fibonacci extension 1.618). A solid breakout above this level could extend the rally toward 119,500 (Fibonacci 2.618).
Trading plan:
Entry buy after a retest of 112,800 – 113,000 (with bullish confirmation candle).
Targets: 115,000 then 119,500.
Stop loss: below 112,000 (to invalidate false breakout).
Scenario 2 – Bearish Rejection
If price fails to sustain above 113,000 and forms a strong rejection, a deeper correction is likely. The nearest support zone sits at 111,000 – 111,500 (Golden Ratio 0.618–0.786).
Trading plan:
Entry sell on rejection from 113,000.
Target: 111,000.
Stop loss: above 113,500.
Scenario 3 – Bearish Breakdown
If the 111,000 level breaks decisively with a solid candle body, bearish pressure will dominate. The next correction target is the demand zone around 108,000 – 108,500.
Trading plan:
Entry sell after a confirmed break below 111,000.
Target: 108,000.
Stop loss: above 112,000.
Conclusion
BTCUSD is now at a critical juncture around the 113K supply zone. A confirmed breakout could open the way toward 115K–119K, while failure to hold above 113K may trigger a correction toward 111K or even 108K. The key focus is on price action confirmation around 113K to define the next market direction.
