BTC - CHANCES ON COLLAPSE ARE RAISINGMorning folks,
So, BTC has failed to start upside action as with our 4H H&S as with 30-min H&S that we mentioned last time as a tool for long entry. The last one actually has not been formed at all. So, no entry signal followed.
Now, based on 4H picture, nominally we still could believe that H&S will survive and BTC still will reverse up. We do not argue, but... this might happen only by some external driver. It will be some wild card scenario, but we can't make a bet on it. Technical picture looks weak, and suggests price return back to 105K lows.
To return back to bullish view we need to get upside jump and confirmation of validity of this H&S pattern. In this case bullish scenario will be possible.
Now we prefer to stay aside from any bullish trades.
Trade ideas

“Bitcoin Cycle Analysis — Preparing for the Next Bear Market”Analysis of Bitcoin’s long-term trend, the end of the current cycle, and the beginning of a potential bear market.

$BTC UPDATEWe can have 2nd manipulation too, but that's not necessarily happening as we grabbed the liquidity already.
We are already in a bear market IMO.
Bear market targets are:
49111.87
38514.16
24757.79

LONG on BTCUSDSimple strategy, small SL great TP. Fibonacci retracement and magical number 88,6%
Good luck!

BTC UpdateDaily indicators are still bearish but the 3 hr says RSI is oversold so we should see a bounce today. BTC hit the support zone. Not to mention DAX is up.
Maybe daily MFI doesn't work? Certainly didn't match the direction last week.

btc cup & handle fail?
the neckline is still holding, but currently the price is trading within a bearish flag, what do you guys think? the trendline will hold?

BTC Daily MFI UpdateDaily MFI went up Thu and Fri completing this cycle, so chart is now implying a couple weeks of downward movement. It's interesting that MFI did not move when BTC went down, could be due to futures trading which won't show up on Coinbase.
Probably just staying out until MFI hit oversold again. Not gonna fight the indicators.

BTCUSD: Bearish outlook?GN gents,
Observe the key levels on chart: bears are in control short term, if price falls from here, it can easily tag the 93-94k area, as long as below $112k, give or take.
If this is the case, downside to $56k becomes a distinct possibility by mid 2026.
I've taken the necessary precautions to be capable of surviving such a scenario, while still being hedged in case of sudden onset of bullishness.
Crossing fingers!
Cheers,
Ivan Labrie.

BUY SETUP – BTC/USD (Smart Money Concept)Analysis:
Price is forming a rising wedge near short-term liquidity. A break below the wedge is expected to sweep liquidity into the demand zone around 107,457 – 108,000, which aligns with previous structural imbalance and unmitigated order block.
Trade Plan:
Wait for a liquidity grab below the wedge and bullish confirmation inside the demand zone. Target the 112,820 – 113,000 resistance area, which aligns with previous high and key supply zone.
Entry Zone: 107,800 – 108,200
Stop Loss: Below 107,400
Take Profit: 111,400 / 112,800
Risk–Reward: ≈ 1:3
Concept:
Liquidity sweep below wedge pattern
Demand zone + FVG confluence
Smart money reaccumulation before continuation

BTC/USD – Smart Money Concepts | Long SetupPrice has recently formed a Change of Character (CHoCH) at a key demand zone, signaling a potential bullish reversal from the weak low. After multiple BOS and CHoCH confirmations, buyers seem to be stepping in to reclaim short-term structure.
Key Points:
Structure: Market broke bearish structure but formed a CHoCH, indicating possible accumulation.
Demand Zone: Price is reacting from a lower imbalance/OB area around 106,500–108,000 USD.
Liquidity: Liquidity likely resting above internal highs; targeting the 113,250 USD level.
Invalidation: A clean break below 106,375 USD would invalidate this bullish scenario.
📈 Trade Idea:
Entry: 107,800–108,500 USD (demand zone)
Target: 113,250 USD (liquidity above equal highs)
Stop: Below 106,375 USD
Risk:Reward: ~1:3
Bias: Bullish short-term move within overall corrective structure. Watching for continuation confirmation before full entry.

Bitcoin 2025-2029 CycleLikely bitcoin price movement for the rest of 2025 to the bear market bottom of 2026/27 and finally to the next bull peak of 2029
Check in early 2027 for accuracy

HEAD & SHOULDER PATTERN FORMED ON BTCUSDFollowing my previously published idea on BTCUSD which supports a sell idea. Here’s an update to the idea where we just spotted a head and shoulder pattern. Now this pattern suggest a sell idea. Therefore we’d be looking forward to seeing price drop lower. Therefore , a sell opportunity is envisaged.

BTC/USD Timeframe 4H ..🔍 Chart Overview
Pair: BTC/USD
Timeframe: 4H (Bitstamp feed)
Current price: ≈ $110,300
Pattern: Downward channel breakout → retest → bullish continuation expected
Indicators: Ichimoku Cloud showing price above Kumo with bullish bias.
Support zone: around $108,000–$109,000 (highlighted pink zone).
---
⚙ Technical Setup
This looks like a bullish breakout of a descending channel:
Price broke out of the downtrend channel.
It’s currently retesting the upper boundary of that channel (around $109–110k).
If the retest holds, bullish continuation targets are projected based on the height of the channel.
---
📈 Target Calculation (Based on Chart)
The chart marks two “Target Points”:
1. First Target Point: around $120,000
→ This is a near-term target based on the first measured move after breakout.
2. Second Target Point: around $125,000–$126,000
→ This aligns with a full measured move or Fibonacci extension (1.618 zone).
---
🎯 Target Summary
Target Level (approx) Type Notes
Target 1 $120,000 Conservative First major resistance / take-profit zone
Target 2 $125,000–$126,000 Aggressive Full channel projection / secondary target
Support Zone $108,000–$109,000 Retest area Should hold for bullish setup to remain valid
---
🧭 Plan Summary
Bullish bias remains valid as long as BTC stays above $108k–$109k.
Break below $108k could invalidate the breakout and suggest deeper retracement toward $105k.
Upside targets: $120k → $125k
---

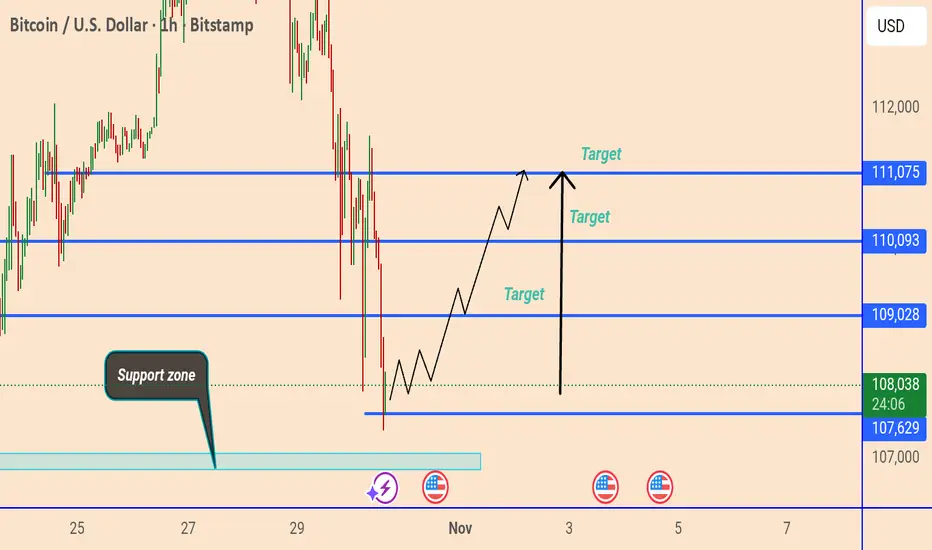
Bitcoin Price Analysis: Potential Rebound from Key Support Zone This chart shows the BTC/USD (1-hour) price action with key support and resistance levels. Bitcoin is currently trading near $107,904, slightly above a highlighted support zone around $107,629–$107,000. The analysis suggests a potential bullish reversal from this support, with projected upside targets at $109,028, $110,093, and $111,075.
Bitcoin: 3 Indicators Under Close WatchThe BTC/GOLD, BTC/S&P 500, and BTC/NASDAQ 100 ratios are defending their major bullish trendlines, and as long as these supports hold, there remains a possibility that the Bitcoin bull cycle linked to the 2024 halving is not yet over.
Since the October 6th peak at US$126,000, Bitcoin’s price has been evolving in a consolidation phase that raises questions: is this a simple pause within a broader bullish cycle, or does it mark the end of the uptrend that began in late 2022 and was tied to the spring 2024 halving? To answer this, it is useful to move away from Bitcoin’s nominal price and instead examine its relative performance ratios against other major asset classes.
The three main barometers — BTC/GOLD, BTC/S&P 500, and BTC/NASDAQ 100 — are currently near their major bullish trendlines, established from the late-2022 lows. These supports, tested several times over the past eighteen months, structure Bitcoin’s relative dynamics against gold, U.S. equities, and the technology sector. Their preservation is therefore crucial.
As long as these three ratios remain above their ascending trendlines, the market structure remains technically bullish in terms of long-term trend. In other words, the underlying move in favor of Bitcoin, which began after the 2022 crash, has not yet been invalidated. The pullback observed since early October could therefore be interpreted as a cyclical support test, or even as an accumulation opportunity for long-term investors.
Conversely, a clear and confirmed break of these three supports simultaneously would signal a regime shift — indicating that Bitcoin has stopped outperforming gold and equity indices, opening the door to a prolonged phase of relative underperformance, typical of end-of-cycle behavior.
For now, however, buyers are still defending the key levels. The maintenance of the BTC/GOLD, BTC/S&P 500, and BTC/NASDAQ 100 ratios above their bullish trendlines means that, technically, Bitcoin’s bull cycle remains alive. As long as these supports hold, there remains a credible probability that the October 6th peak at $126,000 is not the final top.
DISCLAIMER:
This content is intended for individuals who are familiar with financial markets and instruments and is for information purposes only. The presented idea (including market commentary, market data and observations) is not a work product of any research department of Swissquote or its affiliates. This material is intended to highlight market action and does not constitute investment, legal or tax advice. If you are a retail investor or lack experience in trading complex financial products, it is advisable to seek professional advice from licensed advisor before making any financial decisions.
This content is not intended to manipulate the market or encourage any specific financial behavior.
Swissquote makes no representation or warranty as to the quality, completeness, accuracy, comprehensiveness or non-infringement of such content. The views expressed are those of the consultant and are provided for educational purposes only. Any information provided relating to a product or market should not be construed as recommending an investment strategy or transaction. Past performance is not a guarantee of future results.
Swissquote and its employees and representatives shall in no event be held liable for any damages or losses arising directly or indirectly from decisions made on the basis of this content.
The use of any third-party brands or trademarks is for information only and does not imply endorsement by Swissquote, or that the trademark owner has authorised Swissquote to promote its products or services.
Swissquote is the marketing brand for the activities of Swissquote Bank Ltd (Switzerland) regulated by FINMA, Swissquote Capital Markets Limited regulated by CySEC (Cyprus), Swissquote Bank Europe SA (Luxembourg) regulated by the CSSF, Swissquote Ltd (UK) regulated by the FCA, Swissquote Financial Services (Malta) Ltd regulated by the Malta Financial Services Authority, Swissquote MEA Ltd. (UAE) regulated by the Dubai Financial Services Authority, Swissquote Pte Ltd (Singapore) regulated by the Monetary Authority of Singapore, Swissquote Asia Limited (Hong Kong) licensed by the Hong Kong Securities and Futures Commission (SFC) and Swissquote South Africa (Pty) Ltd supervised by the FSCA.
Products and services of Swissquote are only intended for those permitted to receive them under local law.
All investments carry a degree of risk. The risk of loss in trading or holding financial instruments can be substantial. The value of financial instruments, including but not limited to stocks, bonds, cryptocurrencies, and other assets, can fluctuate both upwards and downwards. There is a significant risk of financial loss when buying, selling, holding, staking, or investing in these instruments. SQBE makes no recommendations regarding any specific investment, transaction, or the use of any particular investment strategy.
CFDs are complex instruments and come with a high risk of losing money rapidly due to leverage. The vast majority of retail client accounts suffer capital losses when trading in CFDs. You should consider whether you understand how CFDs work and whether you can afford to take the high risk of losing your money.
Digital Assets are unregulated in most countries and consumer protection rules may not apply. As highly volatile speculative investments, Digital Assets are not suitable for investors without a high-risk tolerance. Make sure you understand each Digital Asset before you trade.
Cryptocurrencies are not considered legal tender in some jurisdictions and are subject to regulatory uncertainties.
The use of Internet-based systems can involve high risks, including, but not limited to, fraud, cyber-attacks, network and communication failures, as well as identity theft and phishing attacks related to crypto-assets.

#BTCUSDT(BITCOIN): Swing Buy, Price Heading Towards Previous HH!Bitcoin is nearing a previous high of 126K. As of the latest data, it trades around 112K, with a 24-hour volume of $38 billion and a market capitalisation of $2.1 trillion. However, before reaching that level, it’s likely to correct towards our entry zone between 108K and 110K. This level is significant because we anticipate a substantial increase in market volume. Historical data shows that similar corrections have led to a 15–20% increase in trading activity.
On-chain metrics indicate a 7% rise in active wallets over the past week, and institutional inflows totalled approximately $1.3 billion in the last seven days. The Bitcoin dominance index currently sits at 54%, suggesting continued interest despite broader market fluctuations.
This short-term view allows us to observe the price accumulating and on the verge of distribution. Based on your trading style, you can select one of three targets:
- Target 1: 118K (conservative)
- Target 2: 122K (moderate)
- Target 3: 126K (aggressive)
We wish you the best of luck and trade safely. If you find our work helpful, please like and comment on our ideas.
Team Setupsfx_

Bearish reversal off pullback resistance?Bitcoin (BTC/USD) is rising towards the pivot and could revert to the first support, which is a swing low support.
Pivot: 111,191.38
1st Support: 104,980.51
1st Resistance: 115,531.59
Disclaimer:
The above opinions given constitute general market commentary, and do not constitute the opinion or advice of IC Markets or any form of personal or investment advice.
Any opinions, news, research, analyses, prices, other information, or links to third-party sites contained on this website are provided on an "as-is" basis, are intended only to be informative, is not an advice nor a recommendation, nor research, or a record of our trading prices, or an offer of, or solicitation for a transaction in any financial instrument and thus should not be treated as such. The information provided does not involve any specific investment objectives, financial situation and needs of any specific person who may receive it. Please be aware, that past performance is not a reliable indicator of future performance and/or results. Past Performance or Forward-looking scenarios based upon the reasonable beliefs of the third-party provider are not a guarantee of future performance. Actual results may differ materially from those anticipated in forward-looking or past performance statements. IC Markets makes no representation or warranty and assumes no liability as to the accuracy or completeness of the information provided, nor any loss arising from any investment based on a recommendation, forecast or any information supplied by any third-party.

BTC/USD 1D Chart📉 Trend Structure
Bitcoin is currently in a medium-term downtrend, as evidenced by the descending channel (black trend lines).
Each bounce from the upper edge of the channel has ended in a decline, and recent tests of the lower boundary suggest that the market is respecting this channel as a primary structure.
⚙️ Key Technical Levels
Resistance (green lines):
$123,345 – strong resistance from the previous high and the channel breakout boundary.
$115,179 – local resistance that has been tested several times and rejected.
Support (red lines):
$107,482 – currently tested support level; breaking it could strengthen supply pressure.
$104,929 – next strong support level near the local lows from September.
USD 98,841 – critical support – lower channel zone, potential capitulation or rebound zone.
📊 Volume
Volume is increasing on the declines, suggesting that the current downward move is supported by seller activity.
No significant accumulation volume at the lows – the bulls have not yet taken control.
🔄 Stoch RSI Oscillator
The Stoch RSI is approaching the oversold zone (around 20), but has not yet reached it.
If the %K and %D lines extend below 20 and then cross upward, this will signal a potential technical rebound.
For now, momentum is negative (bearish).
🧭 Scenarios
🟥 Bearish Scenario (more likely at this point)
A breakout of the $106,000 level opens the way to $104,900 and then $98,800.
Continuing the downward movement within the downward channel could lead to the lower edge of the channel around $100,000 in November.
🟩 Bullish Scenario (Bounce)
Defending the $106,000 level and a positive signal from the Stoch RSI could lead to a bounce around $115,000.
Only a breakout of the upper edge of the channel (~117,000–118,000) with volume confirmation would signal a trend reversal.
⚠️ Summary
Trend: Downtrend (descending channel)
Momentum: Bearish
Key level to watch: USD 106,000
Potential rebound area: USD 104,900 – USD 98,800
Stoch RSI: Near oversold → possible short-term rebound

Bitcoin Going to Hell- SELL EVERYTHING NOWlook at the track record of bitcoin whenever it reaches an All time high,
a correction of 80% is to be expected at least
good luck

Bitcoin Daily Analysis – October 30, 2025🚀 Welcome to another Bitcoin analysis!
Yesterday, the interest rate was cut by one step, just as everyone expected — and that’s definitely a positive signal for Bitcoin. 💪💰
But why did we see a drop? 📉
The world is still anxious about the U.S.–China tariff situation, and those concerns intensified after Powell’s comments, suggesting the December rate cut isn’t guaranteed.
Right now, the market is in a fear phase 😨 — meaning both good and bad news can move prices sharply.
Stay calm and patient, and don’t let the candles scare you. 🕯️🧘♂️
Overall, conditions still favor a bullish continuation, and unless major negative news comes from the U.S. or China, we could soon start the final leg of this uptrend. 📈🔥
The $106,000–$102,000 zone is showing strong demand, making it a potential entry area — but always manage your risk and capital wisely. ⚖️
Remember: every decision in this part of the market should follow your predefined scenario — never trade emotionally or react impulsively. 🧠💼
Disclaimer:
This content is for informational purposes only and does not constitute financial or investment advice. © DIBAPRISM
Larry D.Kohn

Bitcoin Holds Strong, Eyes on $114K!Bitcoin has recently witnessed a strong wave of support driven by rising institutional inflows, alongside relative stability in the performance of digital asset ETFs in the United States. This momentum reflects growing confidence among major investors in Bitcoin as a long-term asset, especially amid expectations of a slowdown in the correction phase and an extension of the current bullish cycle toward new highs in the coming months.
Bitcoin continues to trade in a general uptrend, forming higher highs consecutively. It may maintain this bullish direction, particularly after the easing of trade tensions between the world’s two largest economies , the U.S. and China. These factors could boost investors’ risk appetite, potentially leading to further Bitcoin buying activity.
If the price holds above $106,658.05, the overall trend remains bullish with a first target at $114,092.52. However, a break and four-hour candle close below $106,658.05 would signal a potential shift from an uptrend to a downtrend.

BTCUSD –03 Nov-Liquidity Reaction Zone in PlayAfter several sessions of compression near the upper range, BTCUSD has reached a key liquidity reaction zone where strong sell-side pressure previously appeared.
Price continues to struggle above the 110,000 area, indicating that short-term momentum remains in favor of sellers.
If the current rejection pattern holds, a move toward the lower liquidity pocket around 104,200 could unfold in the coming days.
A confirmed 4H close below 108,800 would add conviction to this bearish bias.
Intraday volatility may trigger temporary pullbacks, but the short-term structure stays bearish unless 112,200 is reclaimed.
Timeframe: 4H
Zone: 110,050 – 111,300
Bias: 🔻 Short
Target: 104,200 – 105,000
Invalidation: Above 112,200

BTCUSD - Spring Loading (Wyckoff Accumulation in Progress)The current BTC structure resembles a classic Wyckoff accumulation phase.
After the Selling Climax (SC) and Automatic Rally (AR), the market forms a sequence of Secondary Tests (ST), showing absorption.
A final Spring could complete the structure before the SOS → LPS → Markup sequence unfolds.
In FRL terms, the AR level represents the neckline = start of the last impulse, confirming structural symmetry between Wyckoff and FRL logic.
