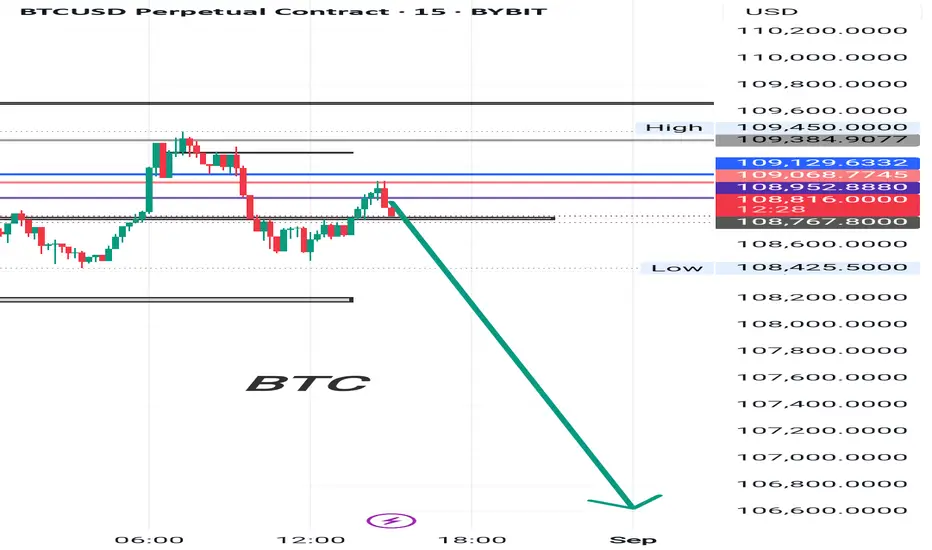
BTCUSD Outlook – Monthly Open AheadTomorrow we get a new monthly candle on BTCUSD. Last month price didn’t trade higher after the rally in April, May, July and August. It’s sitting in a breather position. The dollar has been dumping too after a massive rally, so both markets are in reset mode.
Last month’s low is still intact, not traded through or attacked, which keeps that level important. For now we take it day by day — watching dollar data and order flow on Bitcoin to spot which side shows weakness first.
Big flush last week took BTC from 117K to 110K on whale selling and forced liquidations. That shows leverage risk is still high. But at the same time more than $400M flowed into spot ETFs, showing real demand under the surface.
If flows stay strong and the dollar keeps soft, BTC can bounce back toward the highs fast. If we see more liquidations or a dollar squeeze, then 105K–110K stays the key support zone.
We stay in eagle mode — patient, one day at a time, waiting for clean signals.
BTCETH.P trade ideas

Bitcoin short-term analysis and strategyI've been bullish on Bitcoin recently, and have opened multiple long positions below 110,000. My expectation is that the 110,000 mark will be recaptured. This approach is clearly sound, and the market has already stabilized above this level, suggesting further upside potential.
From the 4-hour and 1-hour charts, the market is still in a rebound channel trend, and this rally is not over. Key resistance levels to watch are currently around 113,500.
Bitcoin Strategy
If the price retraces to around 112,200-112,500, consider opening a long position, with targets at 113,000/113,500.

BTC BEARISH BTC SHORTED AT LONGER TF
Looked W TIME
Looked D TIME
Showing RESISTANCE
and now it is facing pullback to go upside
That's why I shorted BTC
Today's zones for bitcoin chart Bit coin has given false break out of liquidity sweep zone . It shows liquidity was taken above the level . Now we can see a good bearish moment in bitcoin.

BTC Ready to strong fallBTC is poised for a big drop to the 200 EMA. Close your positions and prepare for a strong entry in October.

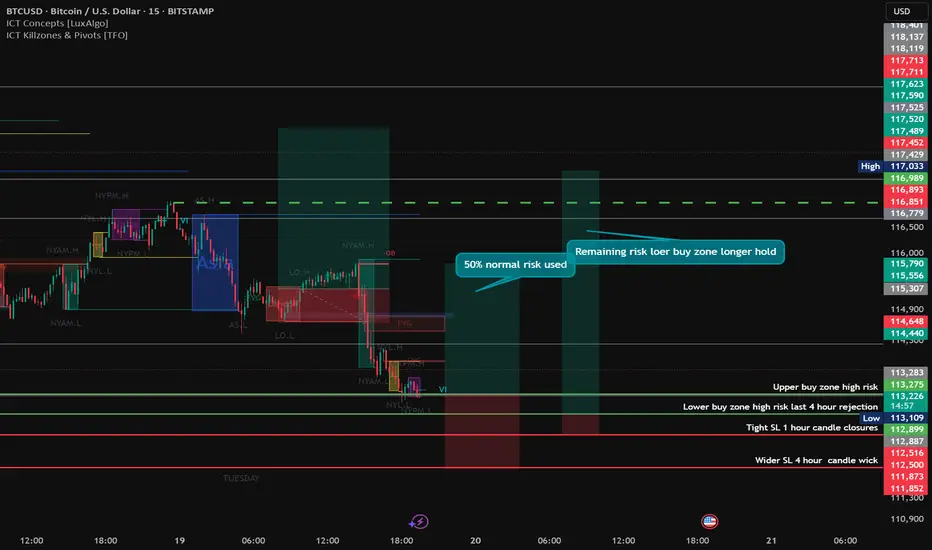
High Risk BTC trend reversal trade idea🚀 BTC/USD Trade Setup 🚀
Looking at a counter-trend opportunity here 👀. Risk is fully managed according to my profile and spread across the buy zone.
⚡ High-Risk Setup Alert ⚡
Using previous 4H & 1H zones as entry points
Targeting order blocks
🎯 First position: 1:1.75 RR
🎯 Second position: 1:12 RR (longer hold)
As always: risk management first. I’ll look to secure breakeven as soon as possible. If SL gets hit—no stress, it’s just part of the game. ✅
Orders are placed → now it’s set and forget. Remember:
📌 If you’re glued to the charts, it usually means one of three things:
You don’t trust your own analysis
You’ve over-risked
You’re just following a signal
👉 Any of those can blow an account.
Patience & discipline win long-term. Let’s see how this plays out. 💪
BTCUSD BEARS STILL IN CONTROLI took SELL 15m time frame, BTCUSD still MAKING HL
Everything as shown on the chart

BTC Bearish Signal. 1D Double-Top Break with RetestMy last post was about how I was hoping to catch the retest of the 1D Double Top bullish wave to 112.3K, well now that position is DONE! . It has hit my target TP.
To continue, I have entered a Short at 112.1K with a Stop Loss at 113K , which is right above the short order block. I was able to enter at a good position this morning because i caught a 15m Reversal Candle with a declining volume during the push up. Not long after that, the 15m timeframe shows a Head and Shoulders Pattern with agreement with its volume. and lucky for me I entered at the head! In the hopes of having a TP at 106.9K (or even more!). This TP is based on the minimum objective of the Reverse Cup and Handle formation in 4H.
In this position, the first challenge would be breaking the Support Line at around 109.5K , which is quite significant as it was touched a handful of times.
When the price reaches 107K i will monitor the momentum to see if I should take the TP at 106.9K or extend my TP to 99.8K . Because right now there is a Double-Top minimum objective of 99.8K . I also did a Fibonacci Analysis that shows it actually might go lower than 99.8K. However, to me, it all depends on the price action then. I don't wanna be greedy and we can always set up new positions later on.
Happy Trading!

Bitcoin level for today .Bitcoin has taken rejection from golden reversal level . If sustains we can see a bearish moment till liquidity sweep top level .

Yes, here is another Bitcoin "DOOM" dome !!!Yes, here is another Bitcoin "DOOM" dome !!!
This time priced in gold, on the weekly time frame.
I added a plethora of annotations...
Just so the trolls can't come back later and say that the analysis was wrong.
Take your time to read properly.

BTC USD Long waiting signalI think a movement from Jan/ Feb 2024 might be repeating in real time.
Going only if the consolidation repetition took place, and i might take a long at the low, with lower risk.
Update when needed.

BTC Close to the Top, but not yet reachedBTC is currently in a corrective phase and will very likely continue its correction toward 100k.
There’s an 80% probability that 100k will hold as support because that’s where the big red line (200-day moving average) lies, alongside a very strong trendline, and by then it will most likely already be in oversold territory in RSI.
All of this would enable Bitcoin to start a new move toward a fresh ATH.
However, momentum is slowing down, and Bitcoin is not showing the same strength as before. This is evident because this time it failed to reach the strong upper trendline (the “thick blue line”) and instead stopped earlier. A rise by the end of the year is probable, but BTC is currently trading within a large rising wedge formation. A breakdown below the lower trendline would signal a move to at least 75k, if not lower.
For now, the outlook remains bullish. We’ll continue analyzing and see what happens after the upcoming bounce and the attempt at a new ATH.

Bitcoin – Wedge at Wave 5, Exhaustion Signals RisingBitcoin’s multi-year rally from the 2022 lows has unfolded in a clean Elliott Wave impulse. The structure now appears to be entering its terminal phase, with wedge-like price action and weakening momentum suggesting exhaustion.
Wave Structure:
Wave 1 rose from the November 2022 bottom at 15,479 to 31,035.
Wave 2 corrected to 24,920.
Wave 3 extended sharply to 73,794.
Wave 4 pulled back to 49,577.
Wave 5 has pushed into new highs, reaching 124,517 so far.
Although 124,517 is a candidate top, the internal structure still leaves room for one final minor push higher before Wave 5 is truly complete.
Wedge Formation & Exhaustion:
The advance in Wave 5 is taking the form of a wedge-like structure with higher highs , a setup often associated with ending diagonals. Such patterns are typically found in the 5th of 5th wave position, signalling the final stretch of a trend.
At the same time, the RSI is diverging — price is making new highs while momentum prints lower highs. This bearish divergence reinforces the case that the rally is losing strength, even as it grinds upward.
Correction Outlook:
When the Wave 5 top is confirmed , correction targets can be mapped using Fibonacci retracements and prior support zones. Until that point, exact downside levels remain open. What matters is the process: once the rally exhausts, retracements are expected to be swift, and the initial reaction will help define the corrective path.
Risk Management:
The bearish view applies only after Wave 5 is complete. A sustained break and continuation above 124,517 would suggest Wave 5 is extending further before exhaustion sets in. Traders should respect the possibility of one more thrust higher before the corrective phase begins.
Summary:
Bitcoin’s 5th wave is nearing completion, likely in the form of an ending diagonal. Price has made higher highs, but RSI divergence points to fading momentum. Once the Wave 5 top is confirmed, correction levels can be projected using Fibonacci tools and prior support zones. Until then, the market remains in its final push, with exhaustion signals growing louder.
Disclaimer: This analysis is for educational purposes only and does not constitute investment advice. Please do your own research (DYOR) before making any trading decisions.

Powell's Speech Sparks Turmoil: BTC Surges and Pulls BackPowell's speech triggered a sharp surge in both BTC and gold 🚀. Amid such significant volatility, many traders will likely see their accounts wiped out 💥. BTC has pulled back today and may continue to drop to around 112,000 before rebounding ↘️↗️
⚡️⚡️⚡️ BTCUSD ⚡️⚡️⚡️
🚀 Sell@ 117000 - 11600
🚀 TP 115000 - 114000 - 113000
Daily updates bring you precise trading signals 📊 When you hit a snag in trading, these signals stand as your trustworthy compass 🧭 Don’t hesitate to take a look—sincerely hoping they’ll be a huge help to you 🌟 👇

BITCOIN Update --- CORRECTION MODEBitcoin was in a correction mode with a long term target to 93,900 support.
Have a blessing week a head !

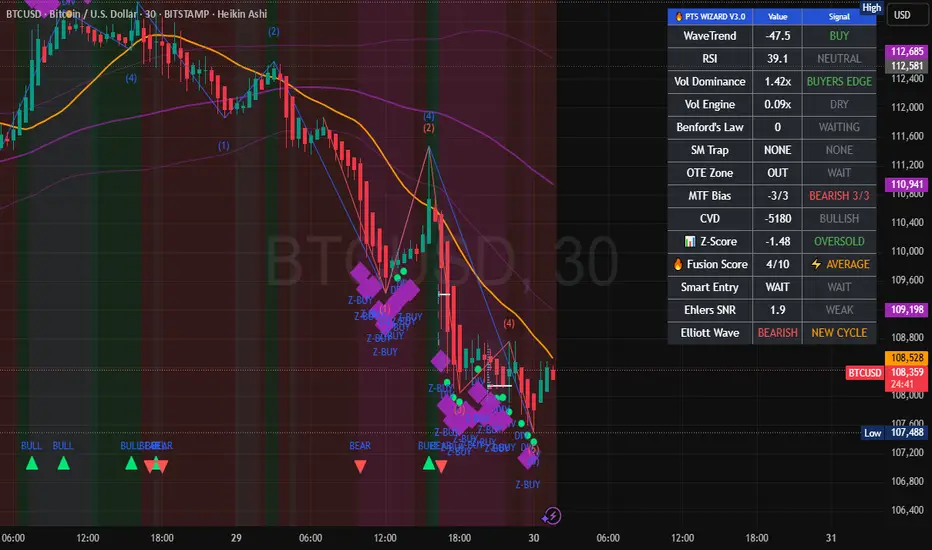
Trade Setup AnalysisSHORT
Entry Price: 108,590 (limit on pullback)
Stop Loss: 108,840
Take Profit(s): TP1 108,200 · TP2 107,900 · TP3 107,500
Risk-to-Reward (RR): ~1.6:1 (TP1) · ~2.8:1 (TP2) · ~4.4:1 (TP3)
Asset: BTCUSD (3-min, Heikin Ashi)
Market Type: Crypto
Session (if visible): NY overlap
Rationale:
Structure: Clean intraday downtrend; price trades below fast & slow MAs with a sequence of lower highs/lows.
Smart Money / Flow: MTF Bias shows bearish 3/3; CVD deeply negative (strong sell) confirming dominant sell pressure; Vol Dominance favors sellers.
Momentum/Stats: WaveTrend sell, Z-Score & RSI oversold → expect reactive bounces; therefore prefer fade-the-bounce rather than chase lows.
Execution Logic: Enter on retest of the 108,560–108,650 supply/EMA pocket (fair-value gap fill from the impulsive drop). SL above the most recent LH/EMA cluster (108,840) to avoid noise.
Management: Reduce risk at TP1 (move SL to BE), scale at TP2, leave a runner to TP3 targeting the liquidity shelf below 107,600–107,500.
🔒 DISCLAIMER
This analysis is for educational purposes only and does not constitute financial advice. Trading involves risk. Always do your own research before making investment decisions.

Price At Daily Support 107.7k is the 1D support trend line of the descending wedge so it’s crucial the 1D candle closes above or 100/105k is very possible .

BTC-M2 FractalNot sure that there is much else to say other than the fractal has completely sh!t the bed! lol Seriously, there has to be significant manipulation going on. All eyes on Binance...
BITCOIN SENDS CLEAR BULLISH SIGNALS|LONG
BITCOIN SIGNAL
Trade Direction: long
Entry Level: 110,667.26
Target Level: 118,641.66
Stop Loss: 105,402.24
RISK PROFILE
Risk level: medium
Suggested risk: 1%
Timeframe: 9h
Disclosure: I am part of Trade Nation's Influencer program and receive a monthly fee for using their TradingView charts in my analysis.
✅LIKE AND COMMENT MY IDEAS✅

BTC PlanDeeper correction or midrange bounce? This is the question. This is a pure scenario overview not a trading plan. What do you think?

BTC/USD – H1 Trading Plan | Key Levels in FocusBitcoin is still trading within a clear downtrend under the H1 descending trendline. After the recent drop, price is consolidating around short-term equilibrium zones, setting up potential sell continuation setups while leaving room for a possible short-term bounce from demand areas.
📊 Technical Outlook
113,393 → Key resistance (confluence of supply + descending trendline).
111,407 → Short-term support, could provide a reaction.
108,793 → Major demand zone, critical for potential bullish bounce.
📝 Trading Scenarios
Scenario 1 – Sell the pullback (Primary Bias)
Entry: 113,000 – 113,400
Stop Loss: Above 114,000
Targets: 111,400 → 110,000 → 108,800
Scenario 2 – Buy from demand (Countertrend idea)
Entry: 108,800 – 109,000
Stop Loss: Below 108,300
Targets: 110,500 → 111,400 → 113,000
⚠️ Risk Notes
Main trend remains bearish – buy setups are only for short-term retracements.
A clean breakout above 113,400 may shift structure, opening the way towards 115,000+.
H1 may create false signals; wait for confirmation from price action before executing trades.
👉 What do you think? Will BTC continue its drop towards 108,800 📉, or will buyers defend demand and push for a rally back above 113k 🚀?

BTCUSD Long The probability of a Bitcoin price surge among buyers within the order block area, as indicated by the crab pattern.
