Long Bitcoin take profits just above ATHQuick video analysis with tutorial of the fake break of the head and shoulders top. Nice tight stop just below $100k on entry last Friday at $101k
Trade ideas

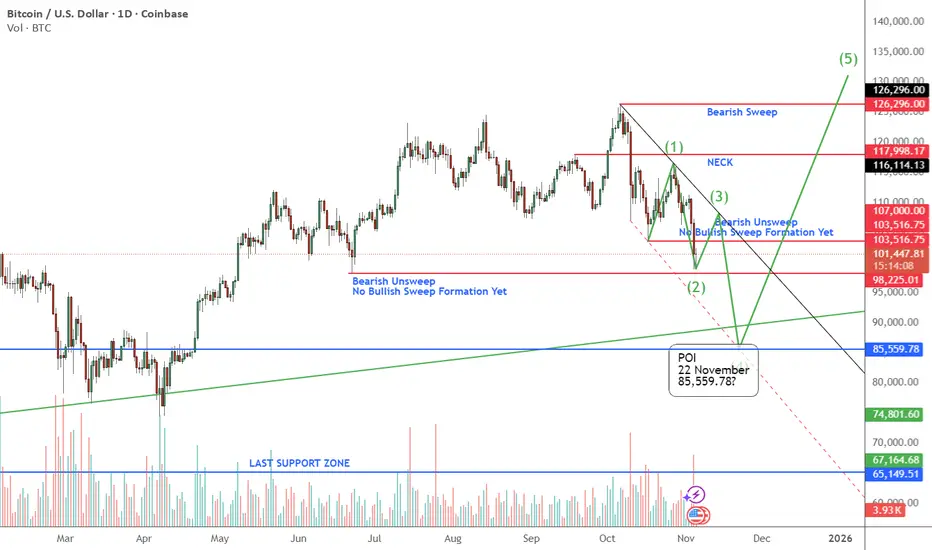
If Bear Nkt in 92K wil be breaked towards 70K to 58K92K is the Top Pattren Revresal Target that is at the Golden of last Rally.
70K was las cycle High.
58K is the 38.2 Fibonacci from the starting point of this Cycle 15K till ATH.
Also around 58K the 200WeeklySMA(55K) and 50MonthlySMA(58K)
Never use Leverage on Crypto SHort or Long
Not Financial Advise just Analisis

Will Bitcoin goes for 14500? WeeklyThis is the last analysis's weekly time frame chart.
Everything is clarified in the chart you can see upgoing and downgoing cycles after every bitcoin halving.
RSI had a downward breakout the red RSI trend line named T1 and pull backed to it in the weekly timeframe where you can see a little red rectangle and arrow there. The continuation of the RSI path is probably like the blue line drawn named R1.
About the BTC price, I am expecting the price to reach 14500 - 19000 dollars until Dec 2022. of course, it can reach that target a few months earlier or late.
Note that before Halving 2024 bitcoin will not have ATH. It means before Apr 2024 bitcoins price will be under the 69000 and even maybe 50000 dollars. After that time the price will go to 120000 dollars.
Do not forget that the trend of the bitcoin and crypto market is still downward and bearish.
You can see my idea about this analysis in a monthly time frame in another published idea on my profile page.

BTCI’m not alarmed by the price action on $BTC. On the second touch of support, it broke down then reclaimed, and we’re seeing a similar move now. There’s some rejection, but I expect price to reclaim above soon and start trending up to test the resistance of the megaphone pattern.

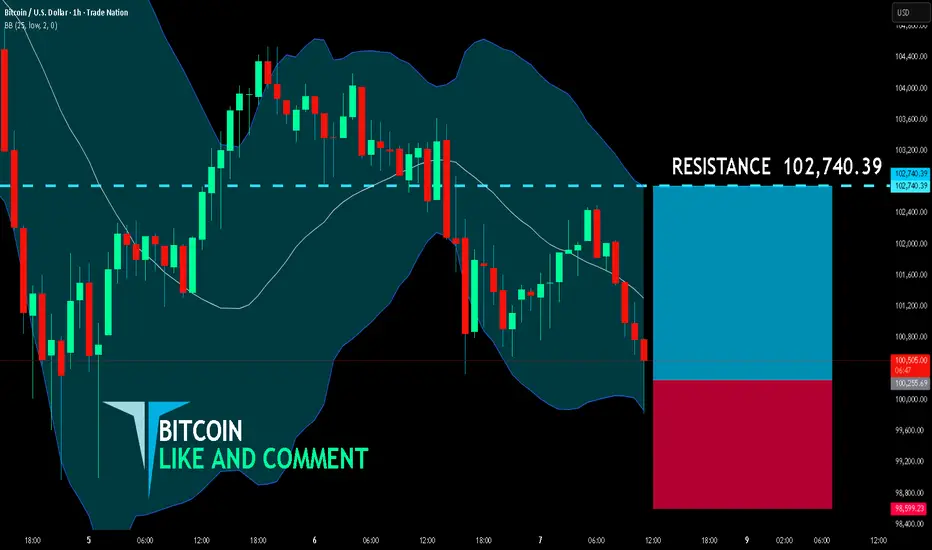
BITCOIN BULLS ARE GAINING STRENGTH|LONG
BITCOIN SIGNAL
Trade Direction: long
Entry Level: 100,255.69
Target Level: 102,740.39
Stop Loss: 98,599.23
RISK PROFILE
Risk level: medium
Suggested risk: 1%
Timeframe: 1h
Disclosure: I am part of Trade Nation's Influencer program and receive a monthly fee for using their TradingView charts in my analysis.
✅LIKE AND COMMENT MY IDEAS✅
Bitcoin Recovery Setup: BTC Price Rebound Signal & Trade IdeaHey traders.
Short update for BTC and next movement.
Basically we moving in the bullish flag and according to some signals most-likely we going to see BTC going to the top of this channel.
Few reasons:
1) RSI crossed and confirmed (red circle marked)
2) Recovery of the whole market
Points to watch:
1) Low volumes - seems like we not going to break much this flag range (be careful)
2) Money can flow to altcoins - so BTC going to flat
If you want to trade, set up TP at the price around orange line and follow RM.
Share your insights in the comments

BTC/USD Bullish Pennant – Breakout Entry Setup✅ BTC/USD Pennant Breakout – Technical Analysis
Chart Breakdown
The chart shows Bitcoin forming a bullish pennant pattern on the 45-min timeframe.
A pennant typically forms after a strong impulsive move (pole), followed by price compression between:
Descending trendline (upper)
Ascending/flat trendline (lower)
This usually signals continuation in the direction of the previous trend, which in this case is upward.
Key Levels
Entry Zone: Just above the pennant resistance (breakout zone).
Stop-Loss: Below the pennant support — good risk management.
Target: Projected by measuring the previous impulse (the pennant pole) and extending it upward.
Market Signals
✔ Price is squeezing near the apex — breakout imminent.
✔ Buyers appear to be defending the lower trendline.
✔ If price breaks and closes above resistance, upside continuation becomes likely.
✘ But if price rejects and falls below support, the setup invalidates.
Bias
Bullish Continuation – If breakout occurs with strong volume.
✅ Title Suggestion
“BTC/USD Bullish Pennant – Breakout Setup Forming”

Macro liquidity benefits have taken effectThe US Senate has reached an agreement to end the federal government's "shutdown", extending the funding until January 30th next year. This shutdown had led to a tightening of liquidity in the money market, and with the agreement reached, TGA funds will be gradually released, directly improving the market liquidity environment. As a risk asset sensitive to liquidity, Bitcoin has responded first, breaking through the $106,000 whole number level. The expectation of loose liquidity will continue to provide upward momentum in the future. At the same time, the market expects a higher probability of the Fed cutting interest rates in December, further reducing the opportunity cost of holding Bitcoin.
Bitcoin trading strategy
buy:105000-105500
tp:106000-106500
sl:104000

BTC Price TargetsHere are all my medium-term bullish targets for BTC. Move SL to break even when target 1 is hit. TC and have fun trading.
Note: It's not financial advice. Do your own research.

bitcoin can fall to between 25k to 50k USDBased on the selling pressure and fibonacci retracements, it can correct up to 2 levels - 25k or around 50k .

Weekend structure: 101.4k reclaimed, next 104.5k?BTC showed clear accumulation this morning, taking out yesterday’s low at 101,422.74 and then rallying hard into Friday’s and Saturday’s highs.
Two targets above are still untouched — 104,191 and 104,550 — likely next in line if buyers stay in control.
Price is holding around 102,900, showing strength after that fakeout drop.
Watch how price reacts near 104k — if liquidity holds, we could see one more push before the next pullback.
Smart money moves first — absorption always comes before expansion.
Institutional Logic. Modern Technology. Real Freedom.

BTCUSD: Bearish Continuation & Short Signal
BTCUSD
- Classic bearish setup
- Our team expects bearish continuation
SUGGESTED TRADE:
Swing Trade
Short BTCUSD
Entry Point - 10376
Stop Loss - 10482
Take Profit - 10200
Our Risk - 1%
Start protection of your profits from lower levels
Disclosure: I am part of Trade Nation's Influencer program and receive a monthly fee for using their TradingView charts in my analysis.
❤️ Please, support our work with like & comment! ❤️

Bitcoin sell 15 minBitcoin sell 15 min
Analysis from ABIPA strategy
Advance Blended Institutional Price Action

BTCUSD (1H)- Note the Resistance Area
- I anticipate that the price will rise to execute a liquidity sweep, fill the Fair Value Gap (FVG), and reach the Order Block, which coincides with the Resistance Area.
- The Resistance Area serves as the profit target.

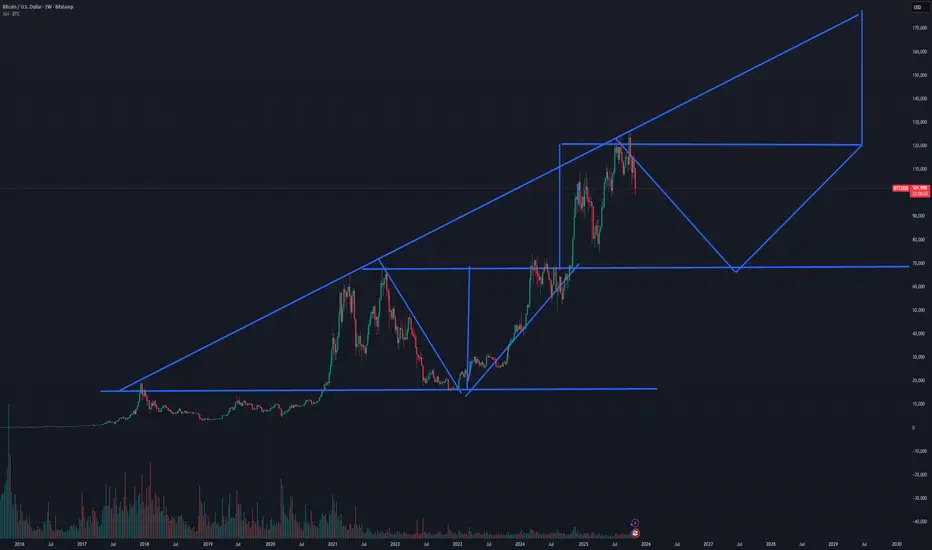
Bitcoin Macro Structure – Next Cycle Projection to $180K (Fract)This chart proposes a new Bitcoin macrostructure model, suggesting that the current cycle will not follow the traditional 4-year halving rhythm.
Instead, the geometry of the chart and the expanding time structure point toward a 6-7 year supercycle — a longer accumulation and expansion phase that may redefine Bitcoin’s historical rhythm.
The price action continues to respect the long-term ascending trendline since 2017, forming broader impulses and corrections with each cycle.
Targets remain at $130K, $150K, and up to $180K, where the top of this extended structure might complete.
After that, a multi-year correction could bring BTC back to the $70K–$80K range before the next long accumulation.
This projection suggests that Bitcoin’s volatility and growth waves are stretching over time, creating a slower but larger-scale cycle compared to the previous ones.
It’s a macro perspective, not financial advice — intended to illustrate how Bitcoin might evolve as the market matures.
BTC to lag US10Y opposing rate cuts - Nov13th-17th ish.The chart is pretty simple, based on the last rate cuts the FED introduced, the Bond market opposed them and wasn't too happy - BTC appeared to follow the yield...
Gut feeling is they will do it again.
1.) FED cuts rates
2.) US10Y opposes cuts, yields rise.
3.) BTC follows the trend as previously seen, at a lagging pace but still somewhat married.
- Not seen on the chart, but Gold was also cooling off during this yield revolt.
- A further cut in December would only fuel/exacerbate the bond opposition.
November 13th is a great catalyst for this timing, as newly issued 10Y's go on auction. We have seen a pretty horrible demand for these bonds in the past 12 months, so I expect the trend to continue/worsen - hence they'll sell for a lower price (Yields Up). Worst/best case??, FED has to step in and buy them due to extremely low demand, but that's a gamble (people would shout QE and maybe FOMO).
Against the grain, I do actually expect yields to oppose the cuts, and based on the previously noted trend relationship, BTC will follow.
Keep tabs on Nov 13th.
Initial targets at a glance for confirmation would be:
DXY - 103
US10Y - 4.3%
BTC - rising with US10Y
Gold/Silver - remaining in a cool-off period.
Goodluck (:

BTCUSD-SHORT TOWARDS 97,000MONTHLY-Bearish disrespect candle
Weekly-Bearish orderflow
Daily-Bearish Orderflow
BEARISH DAILY CONTEXT
h1-15 entry by comfrimation

BTC/SPXBTC retesting support before take off. BUCKLE up . invalidation should be obvious because the people who see my ideas are high IQ

BTCUSD BUY SETUP🎯 Entry Plan
Step 1 – Wait for Retracement
Be patient and wait for price to come back into the demand zone (around 100,000–99,500).
Do not enter while price is still retracing — you want confirmation inside the zone.
Step 2 – Confirmation Entry
On a lower timeframe (5M or 1M):
Watch for:
Liquidity sweep (price takes out a recent low inside the demand zone).
Change of Character (ChoCH) to the upside.
Bullish engulfing or strong momentum candle confirming buyers are active.
Step 3 – Entry Trigger
Enter long (buy) on the candle after the ChoCH confirmation.
This helps ensure you’re catching the start of the bullish leg.
Step 4 – Stop Loss and Take Profit
Parameter Placement
Stop Loss (SL) Below the demand zone (below 99,000)
Take Profit 1 (TP1) 103,000 (mid supply area)
Take Profit 2 (TP2) 104,500–105,000 (main supply area)
A typical risk-to-reward ratio here would be 1:3 or better.

BTC SHORT SETUP My weekend btc setup, currently in a sell position following it down, will TP where marked

Bitcoin and Ethereum: Bullish and Bearish CountsIn this video, I updated the wave counts and discuss how Bitcoin and Ethereum can, at the same time, be both Bullish and Bearish. The summary is this:
Bullish:
The 2x 5-wave down is an ABC structure wave 2. Next move is wave 3 up.
Bearish:
The 1st 5-wave down is wave 1; the 2nd 5-wave down is wave 1 of 3. Next move is wave 2 of 3 up and then wave 3 of 3 down.
For the cryptos, it is important that Bitcoin will not fall below $98,500 in order for the Bullish scenario to hold.

Bitcoin Zoomed out - 150k by year end?Don't panic yet!!, We're in for a switcharoo, hopefully soon!
If in doubt, zoom out, looking like we're bottoming on the weekly, we need more people buying in for the next leg to $150k
All this holding the price down is pure manipulation; the narrative hasn't changed, and most of the news has been good, the stock market is at an all-time high, as is gold. Bitcoin just needs to catch up with the others!🚀🚀🚀
