#BTCUSDT:Last Drop at 98K Before Hitting 140K?Bitcoin dropped significantly after reaching a record high of 125k. This comes after we announced a 100% tariff on China, creating fear in the global market, especially among crypto investors. We can now see a clear pattern forming, the AB=CD pattern, which is likely what others are also seeing.
Good luck and trade safely!
Team Setupsfx_
Trade ideas

Moving average That's my moving average based trading set-up , providing a winning ratio much more than loss , even on when market trade sideways

BTCUSD Long: Breakout From Descending Channel Targets $108KHello traders! Bitcoin is showing a potential continuation of bullish momentum after breaking out of the descending channel, where sellers had previously maintained control over the market structure. During the prolonged downtrend, the price consistently made lower highs and lower lows, until forming a strong Pivot Point near the $100,500–$101,000 Demand Zone — an area that has historically triggered solid bullish reactions.
Currently, after a fake breakout below this demand zone, the price quickly recovered, signaling liquidity sweeps and seller exhaustion. Since then, BTCUSD has rebounded strongly, confirming a structural shift from bearish to bullish control. The pair has now broken above the channel resistance, establishing a short-term bullish bias supported by steady higher lows. At the moment, Bitcoin is approaching the $107,500–$108,000 Supply Zone, which coincides with previous market consolidation and marks a potential reaction area where sellers might temporarily slow down the move. A clean breakout and close above $108,000 would open the door for a further rally toward the $111,000 Supply 2 Zone, reinforcing the medium-term bullish structure.
I expect the $104,500–$105,000 area to act as immediate support and a key retest level, allowing buyers to maintain momentum and target $108,000. Holding above this zone maintains the bullish scenario, while a confirmed break below it could trigger a pullback to the previous demand level before a new rally develops. Manage your risk!

BTC/SPXBTC retesting support before take off. BUCKLE up . invalidation should be obvious because the people who see my ideas are high IQ

Bullish Pop > Daily Highs?Quick and easy BTC technical analysis on the hourly chart. price is currently retraced into 50% of the previous bullish leg where you also have a OB + 1h FVG zone and a general supply/demand zone.
This price level could potentially give price another bullish pop to the upside.
Aman

BITCOIN Did the 1W MA50 just save the day again?Bitcoin (BTCUSD) just closed last week above its 1W MA50 (blue trend-line) even though it broke below it during the day.
Since the March 13 2023 break-out above the 1W MA50, this is the 4th time that BTC breaks below it but manages to close the 1W candle above it. All of those times (including the additional one of September 11 2023), marked market bottoms, Higher Lows for the 3-year Channel Up and initiated the Bull Cycle's strong rallies.
However every rally has been weaker and since the first one topped in March 2024, we have a huger Bearish Divergence on the 1W RSI of Lower Highs against BTC's Higher Highs, showcasing loss of strength for the trend. A natural feat however, as the Bull Cycle tends to be stronger on its start as it rebounds violently from the market bottom and less strong towards the end as it matures and big positions already start to take profits.
But is this the end of the Cycle? The 4-year Cycle Theory, the DXY bottoming, the 1W RSI Bearish Divergence among others, all say 'yes'. But the Bear Cycle can only be technically confirmed when the market closes that 1W candle below its 1W MA50 and so far it hasn't. Is that enough to rely your strategy on from this point onwards?
So has the 1W MA50 just saved the day again for Bitcoin? Feel free to let us know in the comments section below!
-------------------------------------------------------------------------------
** Please LIKE 👍, FOLLOW ✅, SHARE 🙌 and COMMENT ✍ if you enjoy this idea! Also share your ideas and charts in the comments section below! This is best way to keep it relevant, support us, keep the content here free and allow the idea to reach as many people as possible. **
-------------------------------------------------------------------------------
💸💸💸💸💸💸
👇 👇 👇 👇 👇 👇

ANFIBO | BTCUSD - $94.000 or $70.000? [11.6.2025]Hi traders, Anfibo's here!
BTCUSD – Technical Outlook
Technical Structure:
Price action currently respects a descending channel, with:
- Upper boundary (resistance): around $106,000 – $107,000
- Lower boundary (support): converging with the D1 trendline and the 0.618 Fibonacci retracement zone, located between $94,000 – $95,000
This confluence area at $94,000 – $95,000 will be crucial. It not only represents technical alignment between multiple structures (Trendline + Fibonacci) but also marks the boundary where short-term sentiment could shift from corrective to impulsive.
Trading Strategy:
Our tactical approach remains straightforward and adaptive:
“Trade the trend when touched – reverse the bias if the trend breaks.”
#1 – Rejection at Upper Boundary:
Should BTC retest the 106–107k resistance and fail to break through, short-term sell opportunities may arise targeting the mid-range or lower boundary (95k region).
#2 – Reaction at Lower Boundary:
If price reaches the 94–95k support zone and holds, this area could offer high-probability long entries, particularly if accompanied by bullish divergence or strong volume confirmation.
#3 – Breakdown of Structure:
A clean break below $90,000 would signal structural weakness, exposing BTC to the next major support cluster between $80,000 and $70,000. Such a move would represent a deeper corrective leg in the broader cycle and could reset the market’s medium-term trend.
Trading Plan:
>>> SELL ZONE: (x1000)
ENTRY: 106 - 108
SL: 109
TP: 95
>>> BUY ZONE:(x1000)
ENTRY: 93 - 95
SL: 90
TP: 120
Risk Management:
- Stick to small-to-medium positions within the range; increase size only on confirmed breakouts.
- Keep stops tight, as sideways phases tend to trigger false signals.
- Maintain Risk:Reward ≥ 1:2 and avoid overtrading in choppy conditions.
- Reassess bias once the channel is clearly broken.
Conclusion:
BTC is currently in a compressed, corrective phase, moving within a defined range. The key battleground lies between $95,000 and $107,000. Traders should remain flexible, respecting both boundaries of the channel and reacting based on breakout confirmations rather than anticipation.
As long as BTC holds above the $94,000 – $95,000 confluence, the broader bullish structure on the daily timeframe remains intact. However, a decisive break below $90,000 would open the door for a larger-scale correction toward the $80,000 - $70,000 zone—where long-term accumulation could once again become attractive.
GOODLUCK GUYS!!!

BTC at Double Channel Support — Next Impulse Loading?📉 BTC at Double Channel Support — Next Impulse Loading? 🎯
Bitcoin is currently testing a double channel confluence support near $100,211 , a level that’s been both technically and psychologically relevant across the 15m, 1H, and 4H views.
The left pane shows the descending red channel, where price just wicked below support and reclaimed — a signal we’ve seen in prior reversals.
The right pane highlights the broader blue/green support — creating a high-probability reaction zone.
🔹 Technical Support: $100,211
🔹 Local Resistance: $105,161 → $110,596
🔹 Major Target: $122,955 - $138,888 zone
The bullish case strengthens if BTC flips $105,161 on strong volume. But failure to hold $100K opens doors to $97,389 and $96,821 next.
Zooming out: this is a classic inflection zone — the reaction here could define BTC's next multi-thousand move.
🛠️ Smart traders aren't guessing — they’re preparing for both outcomes.
Trading Wisdom 📜
Inflection points > predictions.
In markets, it’s not about being right — it’s about being ready. If this is the bottom, let the chart prove it before the ego jumps in. 🎯
Disclaimer
Disclaimer: I’m just sharing wisdom, not instructions. No licenses, no guarantees — just years of trading scars and precision chartwork. Be smart, protect your capital, and don’t copy blindly. 138k remains my target for the year guys..let's see!
One Love,
The FXPROFESSOR 💙
A lot of people ask how I trade — truth is, it’s pretty simple. I have a daily budget, and I enjoy trading. I’ve moved away from getting married to altcoins, so you’ll notice I post less of them lately. But I still trade every day. I buy dips around key support/resistance levels and exit just below if invalidated. Sometimes it takes more than one attempt, but patience is part of the game. Yes, I use high leverage — that’s my style, and it keeps me engaged. The real secret? Take some profit when it works. That’s it. 💙

Is it buy the dip time for #Bitcoin ? Is it buy the dip time for #Bitcoin ? 👀
Despite the recent action, we remain solidly above this crucial support. The structure looks good.
What's your move? 👇

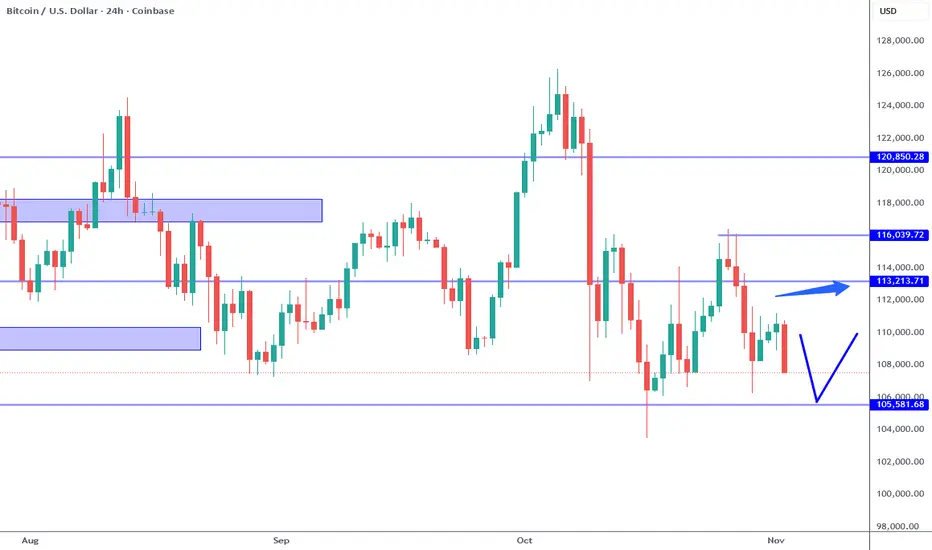
Bitcoin: Watch 105K For Bullish Reversal Again.Bitcoin all over the map. Pay attention to the nearest support and resistance levels which are 113K resistance and 105K support. 109K a minor support has been broken again. There is no way to know which way this market will break on the short term. The general trend is still bullish, BUT resistance levels like 113K and 118K AREA have yet to break.
Smaller time frame momentum is arguably bearish which is good for day trade strategies, otherwise there is not much to do on the swing trade time frame at current prices. A test of the 105K support is likely to follow this week, which can present an attractive swing trade long opportunity (upon confirmation). IF 105K breaks, the next area to watch is the 103L to 100K area for a bullish reversal. This location is also a major psychological level which is also attractive for investing.
Also worth mentioning, there is a head and shoulders formation on this chart, and while it implies bearish possibilities, I would put more emphasis on the levels because these patterns can easily appear randomly. Support and resistance levels, which can also be random, are more relevant in my opinion because of previous trader/investor behavior (or being stuck in a position). Either way do not jump to conclusions or grasp at the obvious. Notate levels, then wait for price to react there and provide a way to measure risk.
Another important note is the CHANGE in Chairman Powell's rate cutting intent during the FOMC press conference over the previous week. When asked about the December rate decision, he explained that is was NOT a sure thing. Based on previous comments and hints, the market seemed to have priced in a December rate cut. Since this comment, the market has cooled off a bit from the constant new all time high every day party. Just goes to show, all it takes is a just few unexpected words to change sentiment. There is NO way to see something like this coming on a chart.
This along with the lack of government data can invite unexpected surprises bullish or bearish. This is why in a game of incomplete information, it is best to focus on RISK, not obsess over forecasts.
Bitcoin - This chart is crumbling!⛔️Bitcoin ( CRYPTO:BTCUSD ) creates a massive top:
🔎Analysis summary:
All the previous cycles on Bitcoin have been lasting about 1,000 days. And exactly three years ago, Bitcoin retested the previous all time high, starting the next bullrun. If we soon see bearish confirmation on Bitcoin, this crypto will lead to another insane bloodbath.
📝Levels to watch:
$100,000 and $50,000
SwingTraderPhil
SwingTrading.Simplified. | Investing.Simplified. | #LONGTERMVISION

BTC History Repeating?Is history repeating itself? BTC hits an ATH and pulls back like it did Jan '25 --> Apr '25. I am curious if we will see BTC give us a double bottom again and break out above the down sloping resistance from the ATH.
Keep vigilant.

BITCOIN and stocks, 2021 vs 2025...Bitcoin (BTCUSD) could be entering a new Bear Cycle and as we've mentioned a few times recently, the 1W MA50 (blue trend-line) will play a big part at deciding that. This is basically the level that BTC is testing right now.
What may seem surprising to some, is that while Bitcoin has been correcting, the stock market (S&P500 illustrated by the black trend-line) has been rising making All Time High (ATH) after All Time High. This is not uncommon towards the end of Bull Cycles and has been particularly relevant during the Top of the previous (2021) Cycle.
As you can see, Bitcoin topped 7 weeks before stocks did, as we witnessed heavy profit taking and rotation of those (extraordinary) crypto gains towards stocks. Even the 1W RSI Lower Highs structure is similar between 2021 and 2025. The 4-year Cycle Theory in full confirmation (so far).
If the pattern plays out the exact same way time-wise as in 2021 (often it doesn't), we should be expecting stocks to top around the week of November 24. As for Bitcoin's trend after, following the 2022 blueprint wouldn't be unreasonable at all, as a 1W candle closing below the 1W MA50 would open the way to a 1W MA100 (green trend-line) test, multiple months of ranged price action between the two and then violent crash towards the 1M MA100 (red trend-line).
So do you think Bitcoin has topped and if yes, are stocks about to follow soon? Feel free to let us know in the comments section below!
-------------------------------------------------------------------------------
** Please LIKE 👍, FOLLOW ✅, SHARE 🙌 and COMMENT ✍ if you enjoy this idea! Also share your ideas and charts in the comments section below! This is best way to keep it relevant, support us, keep the content here free and allow the idea to reach as many people as possible. **
-------------------------------------------------------------------------------
💸💸💸💸💸💸
👇 👇 👇 👇 👇 👇

BTCUSD - Bitcoin has broken long term uptrend support line. BTCUSD - Bitcoin has broken long term uptrend support line.
It is too early to know if this is sideways consolidation or downtrend or even a new up trend (albeit on a more swallow slopped uptrend line).
We need further candles and time to confirm a more durable long term prediction.

Probable Price Action BTC Daily chart - Elliott wave analysisThis screenshot provides my Elliott Wave technical analysis setup for Bitcoin (BTC), focusing on market structure and probable key support zone in the short to mid term.
07/11/2025

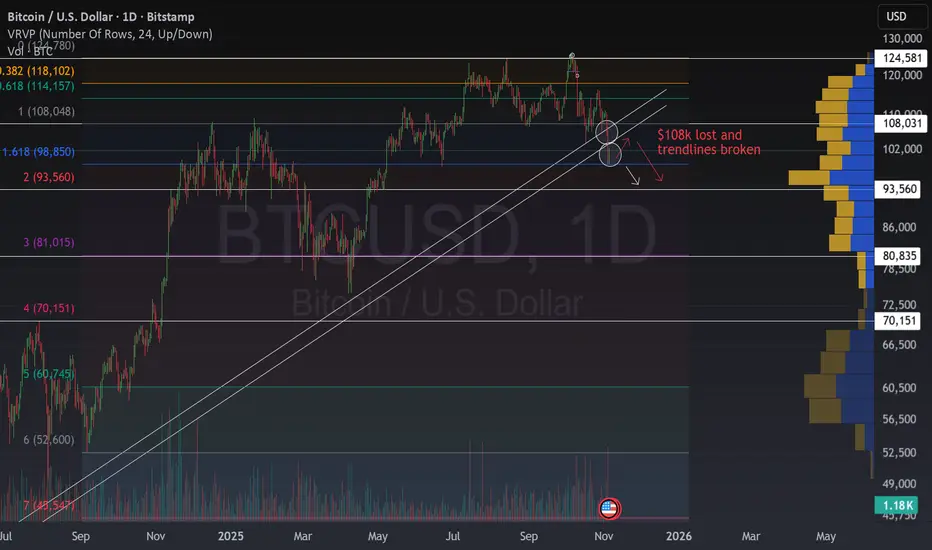
First Major Breakdown of the Cycle For Bitcoin⚠️ Bitcoin Loses $108K Support, The First Major Breakdown of the Cycle.
Bitcoin has lost the $108K support zone, breaking through not only a key horizontal level but also both trendlines that defined this cycle’s uptrend.
As many seasoned traders anticipated , we’ve now reached the 18-month mark after the halving, historically, the point where bullish cycles tend to fade . This breakdown is therefore a first major warning that we may be entering a broader bearish phase.
🔍 False Breakout or Real Trend Shift?
Could this be a fakeout? It’s always possible.
But one key detail stands out:
The volatility during this drop has been remarkably low. That’s not typical of a stop-hunt or manipulation-driven sell-off, it’s more consistent with a gradual trend reversal where buying pressure quietly fades away.
So far, the structure suggests a slow distribution phase , not panic selling. And that are bad news for $BITSTAMP:BTCUSD.
📊 What to Watch Next And Some Good News
Price is currently hovering near the $100K zone, which could act as a temporary balance area, a place where Bitcoin might consolidate before making its next move. A good place to play the range and make money.
Remember that Bitcoin is moving in clear ranges as demonstrated here:
If this level fails to hold, the next significant supports are around $93K and $81K, both of which align with historical volume nodes and the previous explanation.
Another way to see where the ecosystem stands now is by watching stocks like NASDAQ:MSTR or NASDAQ:COIN , which are highly correlated with BTC. In both cases, key supports are still holding, but there’s significant downside risk if those levels fail.
🧭 Strategy Outlook
This is not a comfortable time to be long on BITSTAMP:BTCUSD or crypto in general. The risk/reward ratio for bullish positions has deteriorated sharply, and confirmation of any recovery would require reclaiming $108K with solid volume.
Until then, staying cautious, hedged, or shorting the resistances might be the wisest move.
💬 Markets don’t crash all at once, they turn slowly, then suddenly.
This could be one of those moments where early observation makes all the difference.
Bitcoin Bearish Reversal Toward 104,000 TargetThis chart shows a potential bearish setup for Bitcoin (BTC/USD). After reaching resistance near 106,950, the price is expected to pull back towards the 105,200 support zone and possibly drop further to the 104,000 target level, highlighted by the large downward arrow.

Seller Control For The Long Run.CONTEXT 1:
Strength Context: Sellers Dominating
RSI Divergence: Present
Control Shift: Sellers Have Full Control
EMA Confluence: 200 EMA Reversion
Balance Context: Bearish
Psychology Levels: $125k, $115k, $100k, $90k
STRUCTURE ANALYSIS:
After 5 months of multiple all time highs, the sellers now have full control of the market. Towards the end of August, the buyers reached full exaustion and were overpowered by sellers. Buyers then gain control one last time to create a new all time high. However, the sellers strength quickly overpowered the buyers and a sharp decline ensued. As price regained balance, the sellers liquidate orders at $116,500 and gain complete control of the market.
BEARISH SCENARIO:
-Price rebounds off of psych level $100k
-Buyers will try to regain balance of the market and gain control once again.
-Buyers will attempt to reclaim the 200 EMA where unmitigated price will be met.
-Buyers then fail to reclaim structure as the undecided price point opens up more opportunities for sellers to once again push price lower.
-With the 200 EMA broken and on bearish decent while respecting price structure, this will provide the momentum needed to break structure in favor of sellers and we see price decline to psych level $90K.

BTC/USD (Bitcoin vs USD) chart Pattern..BTC/USD (Bitcoin vs USD) chart 👇
🧭 Timeframe:
I'm using the 1-Day (D1) chart — so this is a medium-term setup, not intraday.
---
📊 Technical Overview:
Price is currently around $107,400.
A major ascending trendline (support) has been broken downward — bearish signal.
Ichimoku Cloud shows resistance above price, confirming bearish pressure.
I have blue arrows and “Target Point” levels marked below current price — indicating a downside projection.
---
🎯 Target Zones (as shown in my chart):
1. First Target Point: around $100,000 – $101,000
→ This is my initial bearish target after the trendline break.
2. Second Target Point: around $94,000 – $95,000
→ This is my extended target zone if the bearish trend continues.
---
⚠ Key Levels:
Type Level (USD) Comment
Resistance 114,000 – 115,000 Strong rejection area inside cloud
Break Zone / Entry Below 107,000 Confirms bearish continuation
Target 1 100,000 – 101,000 First take-profit zone
Target 2 94,000 – 95,000 Final target zone
Stop-Loss 115,000 – 116,000 Above Ichimoku cloud
---
📉 Summary:
Trend: Bearish
Entry Idea: Sell below $107,000 daily close
TP1: $100,000
TP2: $94,000
SL: $115,000

Bitcoin below 200‑day: Buy the dip or more downside?Bitcoin slid with US risk assets, and a clean break below its 200‑day average puts the 100K support in play right now.
October’s Challenger report showed the biggest monthly job cuts in over two decades, souring sentiment and knocking cryptos alongside equities as traders reassessed near‑term Fed risks.
Weak risk tone plus key technical breaks drove a second wave of selling after the early‑October crypto drawdown, keeping focus on whether 100K holds for Bitcoin.
Key drivers:
Macro shock: October layoffs surged to a 20‑year high, fuelling risk‑off and trimming rate‑cut confidence into year‑end.
BTC technical break: price slipped under the 200‑day, and 50‑day momentum is fading; 100K is the first line of defence, then 92–94K if it fails.
Moving averages are lagging: watch daily closes around these levels rather than one intraday pierce; breadth below long MAs warns of weak trend strength.
Trade the levels, not the noise: defend 100K on BTC for bounce attempts. A daily close below turns focus to 92–94K on BTC before stronger supports.
This content is not directed to residents of the EU or UK. Any opinions, news, research, analyses, prices or other information contained on this website is provided as general market commentary and does not constitute investment advice. ThinkMarkets will not accept liability for any loss or damage including, without limitation, to any loss of profit which may arise directly or indirectly from use of or reliance on such information.

BTCUSD – Signs of Recovery Within the Downward Channel?Currently, BTC is moving within a clear descending channel on the 4H timeframe, but bearish momentum has started to weaken. The 99,600 USD zone is acting as a key support level , where strong buying pressure tends to appear whenever price approaches this area.
The price structure suggests a possible retest of this support zone , followed by a rebound toward the upper trendline of the channel around 105,000 USD. The formation of higher lows in the short term indicates that buyers are gradually regaining control of the market.
I expect BTC to hold above 99,600 USD and start forming a short-term bullish reversal . If price breaks above the 105,000 USD resistance zone, the uptrend will likely be confirmed, opening the way toward 108,000 USD in the upcoming sessions.
Main Scenario:
Prefer Buy positions near 99,600–100,000 USD, taking short-term profits at 105,000 USD.
The bullish outlook remains valid as long as price holds above 99,000 USD.

Bitcoin in the Channel of Truth — Levels Mapped, Eyes on 106.261Yesterday's exit was clean — rejection + Bitcoin dominance on support. Let’s break it down 🔍
📊 Bitcoin Dominance
Currently bouncing off key support at ~59.76 . Unless this level is lost, altcoins likely stay weak.
Dominance rising = no altseason. When it dumped last time, Ethereum exploded. Today? We're neutral to bullish on BTC.
🪜 Bitcoin Chart Setup
Big picture:
In a descending macro channel
Inside it, a smaller ascending channel = current trade zone
📌 Key Levels for Day Trading:
Support: 105,000
Mid-level: 106,261
Resistance: 107,000
Macro Bull Trigger: 109,898
Macro Bear Trigger: 104,405
If we lose 104,405 — short time.
If we reclaim 106,261 — stay long.
🧠 Momentum + divergences + my FxProfessor MA combo are pointing higher. So yeah — I expect 106.2K to get tapped today.
📍 Alerts are ON. Precision mode.
💬 Today’s a double day — 11.11. Is 111,111 next? You tell me.
Just play your levels. I do.
Mindset Check 🧘
If you’re guessing, you’re gambling.
I don’t guess. I read structure, I react, I act.
Want to survive this market? Play like it’s chess, not roulette. Not sure where it's going? Hedge!
Disclaimer
Hey — I’m a day trader. I play the levels. I don’t know what you’re doing i just share what I do!
One Love,
The FXPROFESSOR 💙

BTC Ending Diagonal to Finish Off the Cycle?Most people seem to think that either the cycle has already topped or that BTC is going towards 170K+ in a blowoff top. But what if we are just starting wave 5 of an eding diagonal that tops out around $135K? That would wreck the bears first, then trap the bulls expecting a blowoff top. And it could also allow for an alt season, although it may not be as strong as past cycles. What do you think?
