BTCUSD Short: Bearish Rejection Targeting $100.6K Support ZoneHello traders! Bitcoin (BTCUSD) continues to trade within a well-defined descending channel, reflecting sustained bearish pressure after the rejection from the $116,000 Supply Zone. The market previously experienced a Fibonacci Arc retracement followed by a strong sell-off, signaling exhaustion from buyers and the formation of a broader corrective structure.
Currently, we have seen multiple fake breakouts on both the upper and lower boundaries of the channel, suggesting that liquidity sweeps are actively influencing volatility. Notably, price recently tapped the major Demand Zone around $100,600, a level that has historically triggered strong reactions. The sharp wick and immediate recovery from this support indicate buyer accumulation and defense of the zone. A short-term pivot point has now formed near $103,500–$104,000, marking a key decision area. If buyers hold above the $100,600–$101,000 support, a corrective move toward the upper channel boundary becomes increasingly likely.
I expect Bitcoin to retest the $103,500–$105,000 Pivot Resistance Zone, which aligns with the mid-channel level and previous breakout point. If price shows rejection in this region — such as bearish candlestick patterns or weakening momentum — it would provide a favorable entry point for short positions. A break and hold below $100,600 would strengthen bearish momentum and may trigger a continuation toward $98,000. However, if the price breaks and closes above $105,200, the short setup becomes invalid, as this would signal a potential shift in structure and a move toward $110,000. Manage your risk!
Trade ideas

BTC at Double Channel Support — Next Impulse Loading?📉 BTC at Double Channel Support — Next Impulse Loading? 🎯
Bitcoin is currently testing a double channel confluence support near $100,211 , a level that’s been both technically and psychologically relevant across the 15m, 1H, and 4H views.
The left pane shows the descending red channel, where price just wicked below support and reclaimed — a signal we’ve seen in prior reversals.
The right pane highlights the broader blue/green support — creating a high-probability reaction zone.
🔹 Technical Support: $100,211
🔹 Local Resistance: $105,161 → $110,596
🔹 Major Target: $122,955 - $138,888 zone
The bullish case strengthens if BTC flips $105,161 on strong volume. But failure to hold $100K opens doors to $97,389 and $96,821 next.
Zooming out: this is a classic inflection zone — the reaction here could define BTC's next multi-thousand move.
🛠️ Smart traders aren't guessing — they’re preparing for both outcomes.
Trading Wisdom 📜
Inflection points > predictions.
In markets, it’s not about being right — it’s about being ready. If this is the bottom, let the chart prove it before the ego jumps in. 🎯
Disclaimer
Disclaimer: I’m just sharing wisdom, not instructions. No licenses, no guarantees — just years of trading scars and precision chartwork. Be smart, protect your capital, and don’t copy blindly. 138k remains my target for the year guys..let's see!
One Love,
The FXPROFESSOR 💙
A lot of people ask how I trade — truth is, it’s pretty simple. I have a daily budget, and I enjoy trading. I’ve moved away from getting married to altcoins, so you’ll notice I post less of them lately. But I still trade every day. I buy dips around key support/resistance levels and exit just below if invalidated. Sometimes it takes more than one attempt, but patience is part of the game. Yes, I use high leverage — that’s my style, and it keeps me engaged. The real secret? Take some profit when it works. That’s it. 💙

BTC watch $104.2k then 105.5: Major fibs that may END the BounceThis is a follow-up to my Big Picture Idea below.
We have a decent bounce after piercing 100k round
Now approaching a couple of major fibs for resistance.
Rejection from either fib could send us to new lows.
$104,235.02 is a Golden from Covid bottom
$105,451.85 is a SemiMajor Genesis fib
$ 97,769.44 is a minor Genesis and target.
.
Big Picture calling for 97.8k:

BTC/USD (Bitcoin vs USD) chart Pattern..BTC/USD (Bitcoin vs USD) chart 👇
🧭 Timeframe:
I'm using the 1-Day (D1) chart — so this is a medium-term setup, not intraday.
---
📊 Technical Overview:
Price is currently around $107,400.
A major ascending trendline (support) has been broken downward — bearish signal.
Ichimoku Cloud shows resistance above price, confirming bearish pressure.
I have blue arrows and “Target Point” levels marked below current price — indicating a downside projection.
---
🎯 Target Zones (as shown in my chart):
1. First Target Point: around $100,000 – $101,000
→ This is my initial bearish target after the trendline break.
2. Second Target Point: around $94,000 – $95,000
→ This is my extended target zone if the bearish trend continues.
---
⚠ Key Levels:
Type Level (USD) Comment
Resistance 114,000 – 115,000 Strong rejection area inside cloud
Break Zone / Entry Below 107,000 Confirms bearish continuation
Target 1 100,000 – 101,000 First take-profit zone
Target 2 94,000 – 95,000 Final target zone
Stop-Loss 115,000 – 116,000 Above Ichimoku cloud
---
📉 Summary:
Trend: Bearish
Entry Idea: Sell below $107,000 daily close
TP1: $100,000
TP2: $94,000
SL: $115,000

Bitcoin: Technical Bounce or Liquidity Siphon?Hello everyone,
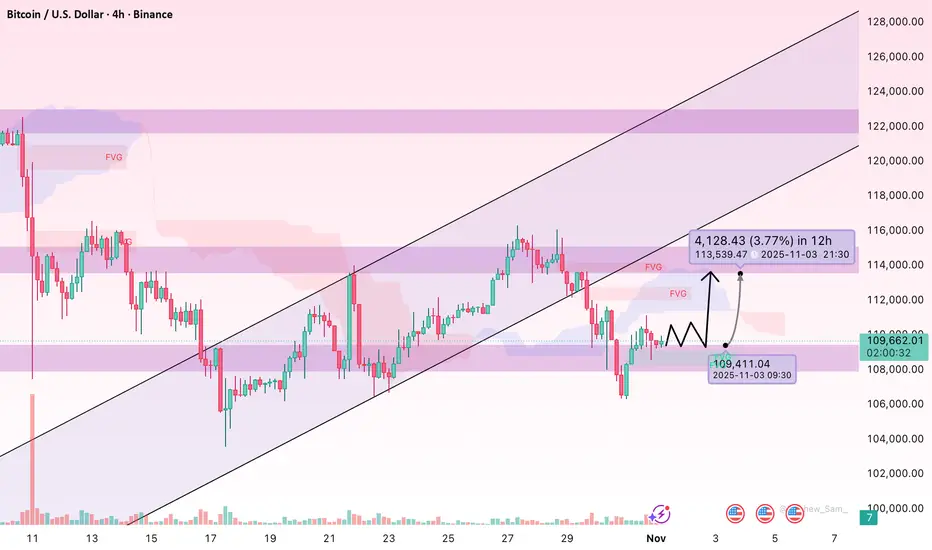
Bitcoin is currently trading around 109,600 USD after a technical rebound from the 107,800 USD bottom. On the 4-hour chart, price filled the Fair Value Gap (FVG) between 108,000 – 110,000 USD and then quickly retreated — a classic sign of a medium-term correction rather than a sustained reversal.
This recent upswing mainly served as a “gap fill,” not a true reversal. The 111,500 – 113,000 USD zone remains a strong resistance, while macro headwinds persist: DXY holds near 106 points, and US Treasury yields are elevated, reviving risk-off sentiment. Investors await the upcoming NFP and PMI releases, which could influence Fed rate expectations.
On-chain data show increased BTC inflows to exchanges from large wallets, hinting at potential short-term profit taking. Technically, the FVG 108,000 – 109,000 USD acts as key support. If price holds here, Bitcoin might retest 111,000 – 113,000 USD. If it breaks below 108,000 USD, the next targets may lie between 105,000 – 104,000 USD. A 4H close above 111,800 USD would confirm a recovery bias, shifting targets to 115,000 – 118,000 USD.
Volume remains subdued, reflecting buyer caution. I lean toward a short-term rebound scenario, but will wait for reversal candles with rising volume around 108,000 – 109,000 USD before entering long. My target: 112,800 – 114,500 USD, with a stop-loss below 107,500 USD.
if Bear Mkt BTC Target as last cycle's Now Between 56K to 48KIf similar 2017 Top Cycle:
56 K at 200 Weekly SMA and 50 Monthly SMA
57K also 38.2 Fib (of this Cycle) from 15k to ATH
If similar 2021 Top Cycle: could drop till 45K the 50 Fib of actual Cycle and below the 200 Weeky SMA.
If is important to state because the actual Week and the next week the price must be below the 200 Daily SMA and 50 Weekly SMA both at 102K.
Also November must end at 99K at the most, meaning the 100K level has been breked. If the price end up or at this SMA mention is a Bullis signal (up or at 103K).

BTCUSD | Consolidating Below $110K Amid Bearish Pressure ₿BTCUSD – MARKET OVERVIEW | Consolidating Below $110K Amid Bearish Pressure ₿
Bitcoin continues to show a bearish momentum, having stabilized below $110.36K, which supports the outlook for a potential move lower toward $106.20K.
For now, the price is expected to consolidate between $110.30K and $106.20K until a breakout occurs.
A confirmed 4H candle close below $106.20K would signal further bearish continuation toward $102.64K.
However, if Bitcoin closes a 4H candle above $110.37K, the structure would shift to bullish, targeting $113.80K initially.
📊 Key Technical Levels
Pivot Line: $110.36K
Support: $106.21K · $102.64K · $98.95K
Resistance: $113.80K · $116.47K · $120.60K
💡 Outlook:
BTCUSD remains bearish while below $110.36K, with potential downside toward $106.20K.
A confirmed 4H close below $106.20K would extend the correction to $102.64K,
while a 4H close above $110.37K would shift the bias to bullish toward $113.80K and beyond.

BTC Bulls Break the FlagBitcoin price has been pushing higher.
After that impulsive leg, momentum started to cool off, forming a tight descending flag.
This pullback isn’t weakness, it’s a pause.
Sellers are trying to push price lower, but notice how shallow the retracement is. Buyers are still defending every dip.
Now, price is breaking out of the flag with strength, a clear signal that buyers are stepping back in. That breakout candle shows intent, volume rising.
I am anticipating the next impulsive leg higher toward the 117,000 target.

Is it buy the dip time for #Bitcoin ? Is it buy the dip time for #Bitcoin ? 👀
Despite the recent action, we remain solidly above this crucial support. The structure looks good.
What's your move? 👇

BTC UpdateWell, looks like my initial guess over the weekend was right. It's gonna retest the blue line then bounce. Looks like it needs one more drop this week though because daily MFI has not hit oversold and the pennant target zone has not yet been reached.
Also, 3 hr indicators sort of work. Indicators can go severely overbought or oversold, especially when the stock market sells off.

#BTCUSDT(BITCOIN): Swing Buy, Price Heading Towards Previous HH!Bitcoin is nearing a previous high of 126K. As of the latest data, it trades around 112K, with a 24-hour volume of $38 billion and a market capitalisation of $2.1 trillion. However, before reaching that level, it’s likely to correct towards our entry zone between 108K and 110K. This level is significant because we anticipate a substantial increase in market volume. Historical data shows that similar corrections have led to a 15–20% increase in trading activity.
On-chain metrics indicate a 7% rise in active wallets over the past week, and institutional inflows totalled approximately $1.3 billion in the last seven days. The Bitcoin dominance index currently sits at 54%, suggesting continued interest despite broader market fluctuations.
This short-term view allows us to observe the price accumulating and on the verge of distribution. Based on your trading style, you can select one of three targets:
- Target 1: 118K (conservative)
- Target 2: 122K (moderate)
- Target 3: 126K (aggressive)
We wish you the best of luck and trade safely. If you find our work helpful, please like and comment on our ideas.
Team Setupsfx_

#BTCUSDT:Last Drop at 98K Before Hitting 140K?Bitcoin dropped significantly after reaching a record high of 125k. This comes after we announced a 100% tariff on China, creating fear in the global market, especially among crypto investors. We can now see a clear pattern forming, the AB=CD pattern, which is likely what others are also seeing.
Good luck and trade safely!
Team Setupsfx_

BTCUSD - Bitcoin has broken long term uptrend support line. BTCUSD - Bitcoin has broken long term uptrend support line.
It is too early to know if this is sideways consolidation or downtrend or even a new up trend (albeit on a more swallow slopped uptrend line).
We need further candles and time to confirm a more durable long term prediction.

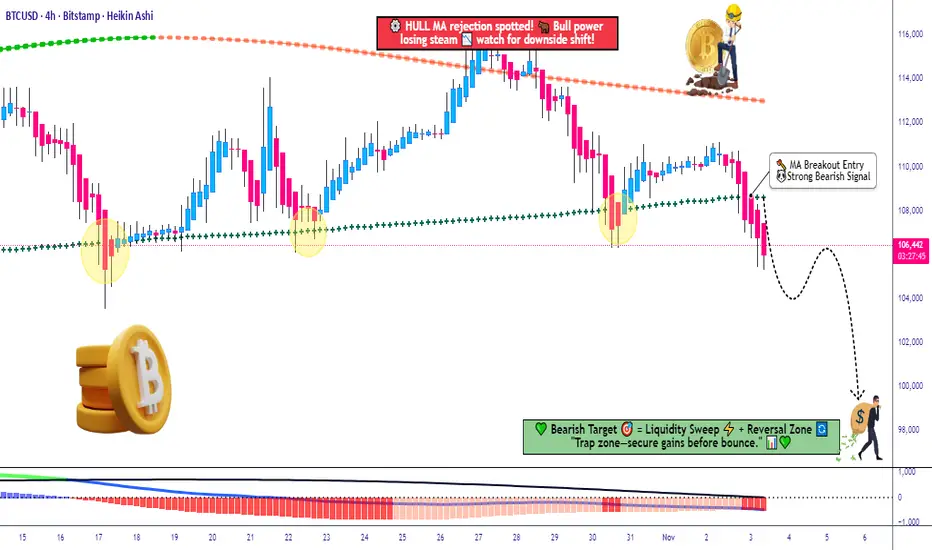
BTC/USD Breakdown Alert — MA Cross & MACD Flash Warning!💰 BTC/USD — “BITCOIN vs U.S. DOLLAR” | Crypto Market Capital Flow Blueprint (Swing Trade)
🧭 Market Overview
The king of crypto 👑, Bitcoin, is showing signs of fatigue at the top. After a solid bull sprint, we’re spotting bearish confirmation on multiple signals — a clean moving average breakout and a MACD divergence to the downside.
Looks like the market’s whispering, “It’s time for a cool-down, mate.” 😏
🎯 Trade Plan (Swing Setup)
Plan: ✅ Bearish plan confirmed — waiting for continuation pressure below structure zones.
Entry Strategy (Thief Layer Method 🕵️♂️):
Using layered limit sell orders — a signature “Thief Strategy” style of scaling in with patience, precision, and a bit of chaos theory.
Sell Limit Layers: 110,000 💸 → 108,000 💸 → 106,000 💸
(You can expand the layer grid as per your risk model.)
Stop Loss: 112,000 — positioned above the previous Higher High (HH) structure.
📝 Note: Dear Ladies & Gentlemen (Thief OG’s), I’m not recommending you to stick to my SL. Manage risk your way — you make money, you take money. 💼
Target: 98,000 — based on strong support, oversold confluence, and a potential liquidity trap zone below.
📝 Note: Same rule — take profits where it makes sense for you. The trap is the escape; don’t overstay the party. 🎭
🔍 Technical Confluence Highlights
📉 MA Breakout: Bears gaining control after crossover rejection.
📊 MACD Divergence: Weak momentum confirmed — watch histogram fade.
Structure Check: Market respecting descending trendline — sellers defending upper zone.
🧩 Momentum Flow: Smart money possibly rotating out of BTC into defensive assets.
🌍 Correlated Pairs to Watch
Keep an eye on these related assets for directional cues and correlation strength:
BITSTAMP:ETHUSD (Ethereum) — often mirrors BTC’s moves with higher beta.
TVC:DXY (U.S. Dollar Index) — rising DXY can pressure BTC.
PEPPERSTONE:NAS100 (NASDAQ 100) — tech sentiment affects BTC risk appetite.
CRYPTOCAP:BTC.D (Bitcoin Dominance) — watch if altcoins start outperforming.
✨ “If you find value in my analysis, a 👍 and 🚀 boost is much appreciated — it helps me share more setups with the community!”
#BTCUSD #Bitcoin #CryptoMarket #SwingTrade #TechnicalAnalysis #ThiefStrategy #BearishSetup #CryptoTrading #MarketFlow #LayeredEntries #SmartMoney #TradingView #EditorPickCandidate #BTCAnalysis
BTC 3 hr indicatorsI'm just plotting this for my own edification, but if my 3 hr indicators work, RSI is oversold so we should see a bounce, and since daily MFI is scrolling down, I think we drop again later this week to hit my pennant target.
A whipsaw, just like everything else on teh stock market.

Bitcoin - The devastating top formation!💎Bitcoin ( CRYPTO:BTCUSD ) is creating a top:
🔎Analysis summary:
In the end of 2022, we witnessed another perfect bullish break and retest on Bitcoin. This retest was followed by an incredible rally of +600%. But slowly, Bitcoin is retesting a massive curve resistance, which has been pushing price lower for the past 15 years.
📝Levels to watch:
$100,000 and $50,000
SwingTraderPhil
SwingTrading.Simplified. | Investing.Simplified. | #LONGTERMVISION

btc cup & handle fail?
the neckline is still holding, but currently the price is trading within a bearish flag, what do you guys think? the trendline will hold?

The Billy Big Balls MomentA trader reached out to me by direct message here on Trading View highlighting a challenge that many of us face from time to time. We’re talking about self sabotage. That moment you know what to do - but do something entirely different and get a result that frustrates the **** out of you.
Follow along, I hope this helps.
BUT FIRST
NOTE – This is a post on mindset and emotion. It’s not a trade idea or strategy designed to make you money. My intention is to help you preserve your capital, focus, and composure so you can trade your own system with calm and confidence.
Here's a scenario you might be familiar with...
You nail a sequence of trades.
Precision. Flow. Everything lines up.
And then something flips.
You start pushing harder, sizing up, breaking your own rules.
A few minutes later, you’re staring at a screen wondering,
“What the hell just happened?”
It’s not lack of discipline nor is it a technical problem.
You have an emotional pattern that hasn’t been mapped out yet.
This pattern has roots into your subconscious and it’s sabotaging your efforts.
WHATS REALLY HAPPENING AND WHERE DOES THE DRIVER REALLY COME FROM
When you start winning, your brain gets flooded with dopamine , the chemical of reward and anticipation.
If your nervous system has ever learned that success leads to loss, losing control, losing safety, losing connection it quietly associates “winning” with risk .
The mind says, “Let’s keep this going.” Deeper down though is the silent warning … “This isn’t safe.”
Doesn’t sound logical right? It’s not. It’s emotional. Deeply embedded in your psyche and activated whenever the mind feels that familiar feeling again.
The mind wants to go forward - the body wants to intervene. And so you get an internal split. A moment of pressure that your mind just has to resolve. And the fastest way the subconscious knows to relieve that pressure… is to end the win.
So you do something impulsive, not because you want to fail,
but because deep down, you're trying to protect yourself or believe or not, you might be even trying to punish yourself.
Weird stuff happens in the subconscious.
That’s why the sabotage happens right after a run of success.
It’s not logic breaking down.
It’s the mind trying to restore an emotional equilibrium.
HOW TO CATCH IT BEFORE IT HAPPENS
Listen. The moment you size up impulsively is not random.
It’s a repeatable signal that your emotional system has been triggered.
You can’t fix what you can’t see - so start tracking it.
1. Notice your signature cue.
For some, it’s tension in the chest or a fidgety feeling of restlessness.
For others, it’s the need to “just check one more chart.”
For you it might be something else. Pay attention and start to become aware of what comes up for you.
2. Map the pattern
Keep a short log : what happens right before you go rogue?
Notice the time of day, physical tension, thoughts.
You are looking for a repeatable sequence.
3. Identify your threshold
There’s always a tipping point where clarity narrows: your breath shortens, attention tunnels or you start fantasising about bigger gains.
That’s your signal.
4. Interrupt the pattern and create a recovery plan (as you notice the cues)
Physically step away from the desk.
Exhale through the mouth long, slow, 6 seconds.
Let your eyes rest on something still . This shifts the nervous system out of fight-or-flight and back into focus.
This isn’t about controlling emotion.
Its about expanding your capacity so emotion doesn't control you.
Next time you’re on a hot streak, notice where focus ends and thrill begins.
That’s the edge that makes or breaks the run.

BTCUSD Q1 2026 Analysis: Bullish TrendBTCUSD potentially going down to USD 97,000 before going up to USD 149,000 on May 2026
by Jaysen Xavero
-Fibomic

Be careful with bitcoin !!!As you can see, the price has dropped significantly after breaking the head and shoulders pattern, and now,with some price stabilization—it could potentially return to its previous highs

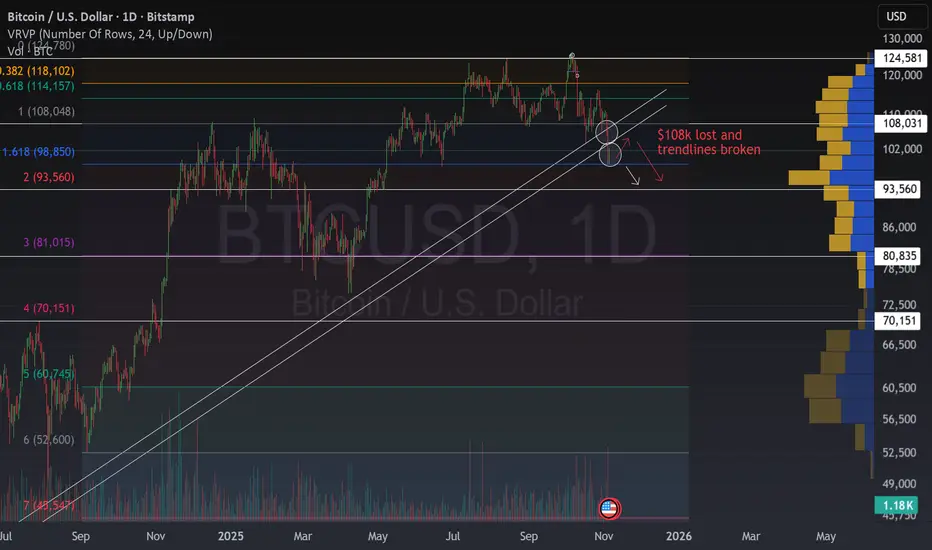
First Major Breakdown of the Cycle For Bitcoin⚠️ Bitcoin Loses $108K Support, The First Major Breakdown of the Cycle.
Bitcoin has lost the $108K support zone, breaking through not only a key horizontal level but also both trendlines that defined this cycle’s uptrend.
As many seasoned traders anticipated , we’ve now reached the 18-month mark after the halving, historically, the point where bullish cycles tend to fade . This breakdown is therefore a first major warning that we may be entering a broader bearish phase.
🔍 False Breakout or Real Trend Shift?
Could this be a fakeout? It’s always possible.
But one key detail stands out:
The volatility during this drop has been remarkably low. That’s not typical of a stop-hunt or manipulation-driven sell-off, it’s more consistent with a gradual trend reversal where buying pressure quietly fades away.
So far, the structure suggests a slow distribution phase , not panic selling. And that are bad news for $BITSTAMP:BTCUSD.
📊 What to Watch Next And Some Good News
Price is currently hovering near the $100K zone, which could act as a temporary balance area, a place where Bitcoin might consolidate before making its next move. A good place to play the range and make money.
Remember that Bitcoin is moving in clear ranges as demonstrated here:
If this level fails to hold, the next significant supports are around $93K and $81K, both of which align with historical volume nodes and the previous explanation.
Another way to see where the ecosystem stands now is by watching stocks like NASDAQ:MSTR or NASDAQ:COIN , which are highly correlated with BTC. In both cases, key supports are still holding, but there’s significant downside risk if those levels fail.
🧭 Strategy Outlook
This is not a comfortable time to be long on BITSTAMP:BTCUSD or crypto in general. The risk/reward ratio for bullish positions has deteriorated sharply, and confirmation of any recovery would require reclaiming $108K with solid volume.
Until then, staying cautious, hedged, or shorting the resistances might be the wisest move.
💬 Markets don’t crash all at once, they turn slowly, then suddenly.
This could be one of those moments where early observation makes all the difference.
Bitcoin Trades Within Defined Channel — Liquidity Below $100KBitcoin continues to move within a well-defined trading channel, with the range high at $126,000 and the range low sitting just below $100,000. This clear structural formation highlights a period of controlled consolidation, where price oscillates between two major liquidity zones.
Given the current positioning, momentum favors a rotation toward the range low, as bearish liquidity builds below the current trading area. This potential sweep of downside liquidity would align with Bitcoin’s typical range behavior — taking out weak lows before initiating another expansion phase back toward the range high.
Key Points:
- Range Structure: Well-established channel between $126K (high) and sub-$100K (low).
- Liquidity Bias: Bearish liquidity beneath current levels increases probability of a move lower.
- Range Continuation: Liquidity sweep below $100K could fuel the next rotation upward.
From a technical perspective, Bitcoin remains range-bound, but the next significant move will depend on how the market reacts around the $100K liquidity pocket.
What to Expect:
Expect a short-term dip toward sub-$100K levels as liquidity is cleared, followed by a potential rotation back toward $126K to maintain the broader range structure.

BITCOIN (BTCUSD): Pullback From Key Support
Bitcoin is currently trading within a wide horizontal range on a daily.
We see a test of its support now.
There is a high chance that the price will bounce from that, following
a formation of a confirmed bullish imbalance candle.
Goal - 105170
❤️Please, support my work with like, thank you!❤️
I am part of Trade Nation's Influencer program and receive a monthly fee for using their TradingView charts in my analysis.
