BTCETH.P trade ideas

BTCUSD Short Pullback Then Long Toward 115500.Analysis:
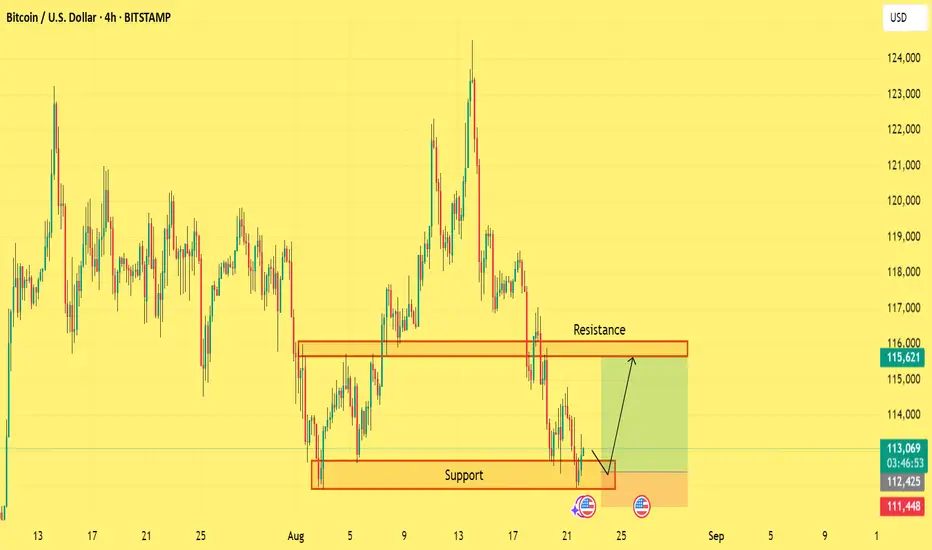
Currently, BTCUSD is trading near 113000. Based on my technical outlook, I expect a short pullback toward the support zone of 112400. From this demand area, I will be looking for long opportunities, targeting the resistance zone around 115500.
This setup aligns with the “trend is your friend” formula, where the minor retracement could provide a better entry for the next bullish continuation.
Trading Plan:
📉 Wait for retracement near 112400
📈 Enter Long from this zone
🎯 Target: 115500
🛡️ Tight Stop Loss recommended below support
Key Notes:
Market structure remains bullish on higher time frames.
Entry after retracement increases risk/reward ratio.
Note: Always manage your risk carefully.
If you find this helpful, support the idea with a like and comment to motivate me to keep sharing my analysis!
Regards: Forex Insights Pro.
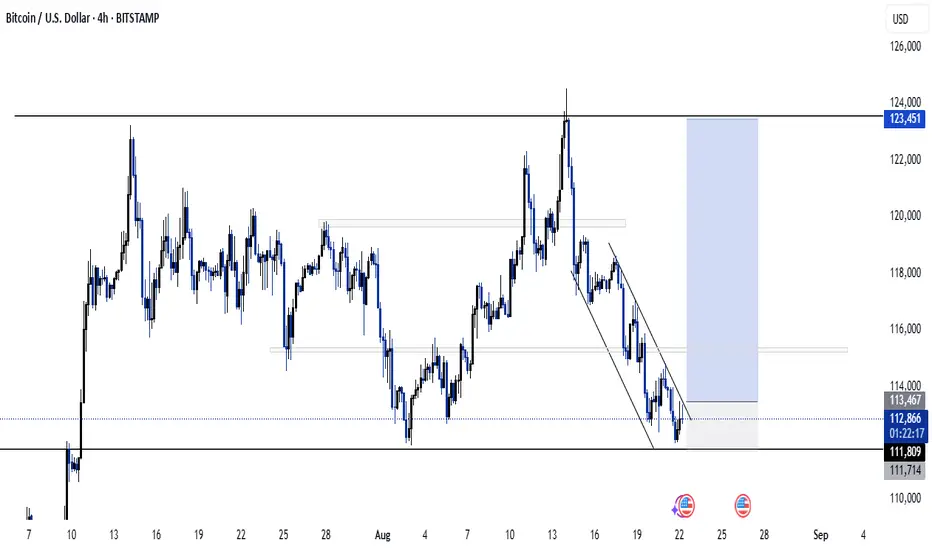
BTCUSD Long Thesis: Awaiting Reversal for a Target of 118000Hello, traders! The market structure for BTCUSD was redefined by a reversal from the prior descending channel. A bullish initiative from the pivot point low near 112000 shifted the balance of power, with the subsequent impulse creating a new high at the 122500 supply zone. This action set the boundaries for the current consolidation phase.
Currently, BTC is consolidating within a large symmetrical triangle, a pattern of contracting volatility. The price auction is being squeezed between the descending supply line and the ascending demand line. The market is now at a critical juncture, testing the integrity of the horizontal demand zone around 113000, the primary area of control for buyers.
The working hypothesis is a long scenario based on a potential liquidity grab. It is anticipated that the price may briefly dip into the 113000 - 112000 demand zone before a sharp bullish reversal. A swift reclaim of the 113000 level would be the key confirmation. Such a reversal is expected to initiate a full rotation towards the upper boundary, with the take-profit set at 118500, a logical target representing a significant area of prior price interaction. Manage your risk!

Bigger drop Incoming?Bitcoin Short-Term View
Bitcoin has shifted from a bullish to bearish short-term trend following a decisive multi-day downside breakout. The recent technical breakdown opens room for further weakness, with the first notable support coming in around the 112,000 level (previous swing lows), and a more significant downside target aligning with the 101,000 area, near the 200-day moving average.
On a broader level, open interest across crypto derivatives remains elevated, signaling stretched positioning at this stage of the cycle. While many market participants are leaning on the narrative of cryptocurrencies as a “safe haven” during periods of global uncertainty, historical data and statistical evidence show that crypto has not consistently behaved as a defensive asset. Instead, it has tended to track broader risk sentiment, amplifying moves during risk-off episodes.
What are your thoughts ?

BTC/USD 22.08.25Bitcoin Tests Key Support: Reversal or Further Decline?
Market Overview
BTC/USD has reached a critical support area around 112,500 – 113,000. The next move will determine whether the price rebounds upward or breaks lower, opening the way to deeper downside levels.
Key Levels
Support: 112,500 – 113,000
Upside target 1: 114,700 – 115,000
Upside target 2: 124,000 – 124,600
Major support below: 107,000
Key D1 level: 98,240
Scenario
Main Scenario (Bearish):
A breakdown below 112,500 could trigger a decline towards 107,000, and if pressure persists, further down to 98,200.
Alternative Scenario (Bullish):
A rebound from current levels and a move back above 115,000 would open the way for recovery toward 124,000 – 124,600.

BTC BUY SETUP , Bought From $112,660 BTC BUY SETUP
Currently $112,660
Bought From $112,660
(Trading plan If BTC go down ,
to $111,500 will add more longs)
Expecting target $114K OR ABOVE
In the event of an early exit,
this analysis will be updated.
Its not a Financial advice

BTC Long Term areasAs we can see BTC is bearish but it can pump back from last weekly liquidity i.e. 111700-111900 and if any 4H close below that area then have to wait till 110500 for a better buying as today is FED meeting so a correction is expected in BTC for trend change.

Bitcoin ShortGood opportunity for a short in bitcoin. The risk to reward here is very good. Also we have bad seasonality till Mid September.

BITCOIN IN DANGER Bitcoin has reached to a major resistance area between 120k to 130k, which is the resistance zone since 2021 tops.
This is the second rejection in this cycle. A fake breakout to $130,000 may occur, but the monthly candle could close below this resistance again.

BTCUSD Long After a strong push up (impulse move), price retraced sharply.
The retracement formed a descending channel (falling wedge).
Falling wedges often indicate bullish reversal potential.
Price recently touched the support zone near $111,800–$111,700, where buyers previously stepped in.
✅ Support & resistance zones are clearly identified.
✅ Pattern recognition: A descending channel aligning with a reversal setup.
✅ Confluence: The channel meets the strong historical support at $111,800.
✅ Risk-to-reward: Entry near support gives a smaller downside risk compared to the upside potential back to $123k.

BTCUSD Analysis – Key Levels & Market OutlookThis analysis focuses on BTCUSD, highlighting the most important support and resistance zones, current trend outlook, and potential trading opportunities.
Key Support Levels
Key Resistance Levels
Possible Breakout or Reversal Scenarios

BTCUDST - trust your strategy and use risk managment BTCUDST - trust your strategy and use risk managment , big move are the real deal

BTCUSD-SELL strategy Weekly chart GANNBTC is starting to behave southwards. We reject $ 125K hampered by $ 130k GANN resistance. Now we are in negative territory and I feel we may see $ 90k test in the near term.
Strategy SELL @ $ 110-120k and take profit initially at $91k area. Overall we may see move lower towards $ 75k.

HAS THE WAVE 5 STUCTURE PLAYED OUT? OR ONE LAST PUSH FOR BTC??
✅ Elliott Wave Count (Impulse: 1 to 5, then ABC Correction)
It seems to me that Bitcoin completed a 5-wave impulse from the 2018 bottom to the 2025 peak:
• Wave 1: 2018–2019 rally.
• Wave 2: 2019–2020 correction.
• Wave 3: Massive rally into late 2021 (this looks extended).
• Wave 4: Correction into 2022–2023.
• Wave 5: Final rally ending in 2025 (~$130K area).
This count looks valid under standard Elliott Wave rules:
• Wave 3 is not the shortest (it's extended).
• Wave 4 doesn’t overlap Wave 1 territory.
• Clear alternation between Wave 2 and Wave 4.
________________________________________
📉 ABC Correction Outlook (Bearish Bias After Wave 5)
I mapped an (A)-(B)-(C) correction scenario:
• Wave A possibly back to the ~$55-62K region.
• Wave B retrace back to ~$80–90K.
• Wave C targeting the $30K–$35K zone — which aligns with the previous accumulation zone and Fibonacci cluster.
That’s a trading flat or expanded flat correction—realistic and supported by the chart structure.
________________________________________
🔢 Fibonacci Extensions & Retracement Levels
I noted two key levels:
• Level 4.236 (Black): ~$120K — aligns almost perfectly with Wave 5 peak → This is a strong confluence zone.
• Level 11 (Blue): ~$122K — Fibonacci extension from a larger degree → Possibly indicating macro top.
Yes, both levels seem valid and reinforce the end of Wave 5.
Other supportive confluences:
• The Fibonacci clusters in the $35K area line up with historical support and projected Wave C bottom.
• $55K–$69K area (Wave A target) overlaps with the previous ATH range from 2021, a critical support/resistance flip zone.
________________________________________
🟠 Other Observations
• The red triangle breakout in Wave 5 suggests a terminal pattern (ending diagonal).
• The bearish divergence (not shown but likely present based on wave structure) could support the top.
• High-volume node around $30K–$35K supports it as a potential Wave C bottom.
________________________________________
🔚 Summary
My analysis is:
• Technically using both Elliott Wave and Fibonacci tools.
• Well-structured with a realistic ABC correction forecast.
• Accurate in identifying major confluence zones ($120K–$122K top, $55K, and $35K retracement zones).
🔮 What to Watch
• Confirmation of Wave 5 top (break below ~$100K).
• Behavior around $69K–$55K zone (Wave A potential completion).
• Any early accumulation signals near $30K–$35K if Wave C plays out.

Bitcoin BTC Bounce Incoming?📊 CRYPTO:BTCUSD is approaching the extreme technical zone: $111,400–$108,300, where a weekend bottom could form.
If structure holds, this area may set the stage for a bounce into next week, aligning with key wave metrics.
⏱️ Timing and confirmation will be critical.

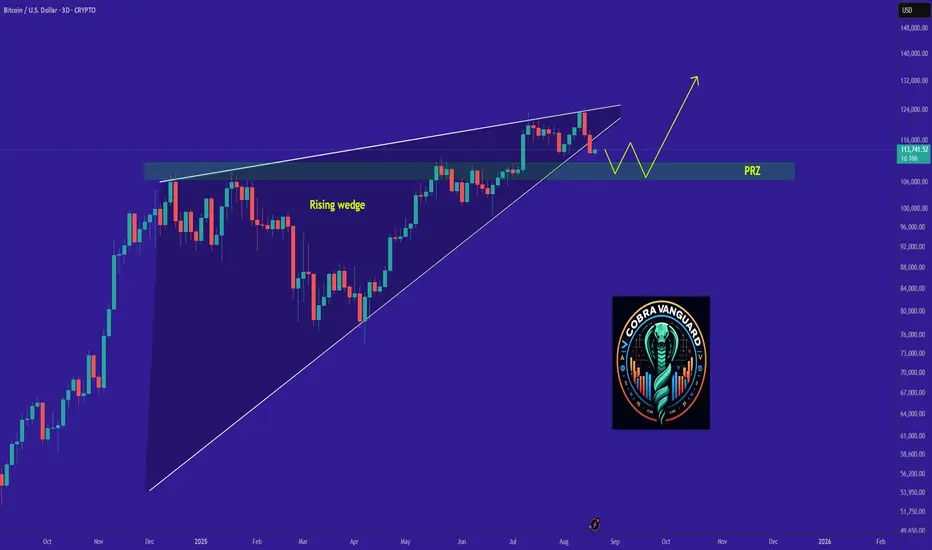
bitcoin's Situation, A Comprehensive Analysis !!!The price has broken the descending wedge and could now drop to 109K. It seems the PRZ (Potential Reversal Zone) is a stable range for Bitcoin.
BTC (hunting lemmings)The information and publications are not meant to be, and do not constitute, financial, investment, trading, or other types of advice or recommendations.

BTC Short Trade Setup – Bearish Momentum
🎯 **BTC Short Trade Setup – Bearish Momentum**
📌 **Instrument:** BTC
📉 **Direction:** SHORT
💰 **Entry Price:** \$115,200
🛑 **Stop Loss:** \$116,500
🏹 **Take Profit:** \$111,500
📏 **Position Size:** \$5M (1% of \$500M account)
💪 **Confidence:** 65%
⏰ **Timing:** Enter at market open
⚠️ **Key Risks:**
* Market volatility can trigger rapid moves.
* Breakout above \$116,500 invalidates setup.
* Macro correlations may amplify risk.
✅ **Rationale:**
* Lower highs & lower lows = bearish momentum
* Price below key MAs, weakening bullish conviction
* Technical indicators support short entry
🔥 **TradingView / Social Tags:**
\#Bitcoin #BTCShort #CryptoTrading #CryptoAnalysis #FuturesTrading #TechnicalAnalysis #TradingSignals #RiskManagement #MarketAnalysis #CryptoAlerts #HighConvictionTrade #BearishSetup #PriceAction #TradingStrategy #CryptoMarket

Bitcoin to 80,937$ within 45 days!How much more specific can I get.
Hey, I'm back, you can probably tell by my writing style after 4 years.
Eventually, bitcoin will go to 32,026$ to find support within the next 1.5 years before bitcoin sees another meteoric ascend to 300,000$

Bitcoin: Confident Breakout of $120K — Targets of $125–$135K!• The trend remains bullish: Bitcoin is trading above $117K–118K, has updated its maximum to $124K. Steady growth is supported by growing institutional investments and a softening regulatory environment.
• Key levels:
- Support: $110K–112K — fundamental holding zone. :contentReference
- Resistance*: $120K–123K. A breakout with volume will open the way to $125–134K.
• Technical signals:
- Short-term consolidation after growth of almost 4% — natural rest before the next rebound.
- If BTC consolidates above $125K, there is potential up to $150K.
Bottom line: Bitcoin is demonstrating a consistently bullish sentiment. Holding above $110-112K is critical, a breakout of $120-123K is a signal for growth to $125-134K, and with strong dynamics - to $150K.
Recommendations:
- Buy on dip around $112-115K with targets of $125K+
- Breakout entry** when consolidating above $123K, targets $125-134K
- Stop-loss: slightly below $110K


