Bitcoin Awaits Breakout From Long-Term ChannelIntroduction
Niagarahub reviews current Bitcoin market behavior as price continues to trade within a well-defined long-term channel, reflecting a phase of compressed volatility and cautious sentiment among market participants. The asset's sustained consolidation highlights a balanced tug-of-war between accumulation and profit-taking behaviors, with neither side yet able to establish convincing dominance.
This period of restricted price movement has focused attention on market structure, liquidity positioning, and the influence of macroeconomic catalysts. Niagarahub reviews the ongoing environment as one where algorithmic models and high-frequency systems closely monitor breakout triggers, recognizing that a decisive move from this channel could signal the next major trend phase.
Technology & Innovation
Advancements in automation and algorithmic intelligence continue to shape the way traders interpret and respond to long-term consolidation patterns. Niagarahub reviews how modern systems blend technical signals with real-time liquidity analytics and network data to gauge breakout probability. These technologies operate around-the-clock, scanning order books, derivatives flows, and global trading venues to identify early signs of directional shift.
Machine-learning engines are increasingly used to refine breakout detection. By analyzing volatility compression cycles, historical fractals, and cross-market stress indicators, these systems help traders separate true structural developments from short-term noise. Statistical models now measure momentum thresholds and liquidity pockets with greater accuracy, improving execution quality during the transition from range-bound behavior to trend expansion.
Furthermore, transparency tools integrated into advanced dashboards help traders visualize funding rates, open interest changes, and liquidation cluster zones — metrics that often precede volatility spikes. Niagarahub reviews these capabilities as part of the broader evolution toward data-driven execution, allowing institutional-grade analysis even during low-volatility environments.
The ongoing improvement in back-testing frameworks has also enhanced strategy reliability. With access to deeper historical datasets and more precise chain-level information, decision engines can simulate breakout conditions more accurately. This reduces discretionary risk and strengthens platform consistency when markets transition from compression phases into expansion cycles.
Growth & Adoption
Despite Bitcoin's neutral technical posture, user participation and engagement across digital asset platforms remain steady, suggesting ongoing confidence in the asset's long-term trajectory. Niagarahub reviews the underlying adoption curve as one defined by broader infrastructure maturity and growing institutional familiarity with digital markets.
Algorithmic portfolio systems and multi-asset dashboards have expanded accessibility for both newcomers and experienced traders. This has democratized analytical capabilities traditionally reserved for quantitative desks, helping reinforce market depth and resilience. The participation of data-centric trading communities continues to foster a disciplined approach to digital asset exposure, with a growing emphasis on macro-aligned positioning.
Corporate and treasury participation trends remain structurally intact, driven by long-term strategic interest rather than short-term price action. As liquidity profiles improve and technology infrastructure deepens, long-term holders — both retail and institutional — continue to view consolidation cycles as normal components of Bitcoin's market evolution.
Niagarahub reviews how stable platform growth and rising analytics adoption reflect increasing market maturity. Access to multi-venue aggregation tools, hedging instruments, and automated execution systems has streamlined participation across varying market cycles. Even within long-term channels, asset exposure strategies remain robust, supported by improved capital efficiency and portfolio balancing tools.
The ability to engage with deeper market intelligence, including chain metrics and sentiment-weight analysis, supports informed participation. This reinforces ongoing adoption, with traders recognizing that consolidation phases can create favorable positioning opportunities when backed by disciplined analysis and data-driven frameworks.
Transparency & Risk Management
A consistent theme throughout Bitcoin's consolidation period is the prioritization of structured risk management. Niagarahub reviews how professional trading systems integrate volatility controls, real-time risk monitoring, and allocation discipline to navigate channel-bound markets effectively.
Modern trading environments increasingly rely on automated exposure frameworks capable of adjusting positions based on volatility compression, funding trends, and liquidity concentration zones. This shift toward programmatic governance has strengthened market behavior, preventing excess leverage from destabilizing conditions during uncertain phases.
Enhanced transparency tools allow platforms to display real-time depth metrics, derivatives positioning imbalances, and execution flow imprints. This improves the accuracy of market interpretation and reinforces the importance of data verification — particularly when trading within confined price structures. Niagarahub reviews this emphasis on real-time auditability as core to the evolution of disciplined digital asset participation.
Additionally, dynamic hedging strategies and systematic drawdown controls support capital preservation, allowing traders to remain engaged without assuming unnecessary directional bias. Scenario modeling and risk-tier allocation frameworks have become standard practice, reflecting a market structure where transparency and discipline guide engagement.
Industry Outlook
Bitcoin's sustained movement within a long-term channel illustrates both structural patience and anticipation. Niagarahub reviews this environment as one shaped by macroeconomic conditions, liquidity distribution across financial markets, and evolving interest-rate expectations. As global capital adjusts to broader economic signals, traders recognize that consolidation phases precede decisive outcomes.
Institutional sentiment remains attentive to regulatory clarity developments, monetary guidance, and cross-asset correlation signals. With volatility cycles historically following extended compression phases, the long-term channel continues to draw interest from systematic funds and macro-driven strategies seeking confirmation of trend direction.
Market participants increasingly view consolidation periods not as stagnation but as setup phases—where accumulation, hedging, and volatility preparation lay groundwork for the next expansion cycle. Niagarahub reviews how strategic patience, driven by analytics and automation, remains central to navigating transitional phases.
The broader market narrative continues to emphasize transparency, technological progression, and structured governance. These elements collectively strengthen market infrastructure and support confidence as Bitcoin approaches potential structural inflection points.
Closing Statement
As Bitcoin trades within its long-term channel, traders remain vigilant for technical confirmation and liquidity shifts that could spark directional expansion. Niagarahub reviews this environment as one shaped by discipline, data depth, and evolving market intelligence — where long-term positioning and transparent systems support measured decision-making across cycles.
As market conditions evolve, platforms that emphasize transparency and innovation will be closely watched by traders and investors alike.
Trade ideas

Bitcoin Rebound Setup: Targeting $112,400 Resistance After StronThis Bitcoin (BTC/USD) 1-hour chart shows a bullish setup after a sharp drop and rebound from support around $109,800. The price is targeting the resistance zone near $112,400, with a potential upward move indicated by the blue arrow. Key support is marked at $109,800, while resistance sits around $112,400–$113,000.

Shifts in Global Trade Patterns and Supply ChainsIntroduction: The New Dynamics of Global Trade
The 21st century has witnessed an unprecedented transformation in global trade patterns and supply chains. From the post–World War II dominance of Western industrial economies to the rise of Asia as the global manufacturing hub, and now to an era shaped by digitalization, sustainability, and geopolitical realignment, trade is no longer just about goods crossing borders—it’s about interconnected systems, data flows, and strategic dependencies.
The COVID-19 pandemic, escalating trade wars, and regional conflicts like the Russia–Ukraine war have further reshaped the global trade map, compelling nations and corporations to rethink where and how they source, produce, and distribute goods. Today’s supply chains are not just economic instruments but also political, environmental, and technological battlegrounds.
This essay explores how global trade patterns and supply chains are shifting—highlighting the key forces driving these changes, the regions gaining and losing influence, and the implications for the future of global commerce.
1. Historical Context: From Globalization to Strategic Localization
In the decades following the 1990s, globalization reached its peak. Corporations sought efficiency through offshoring—relocating production to countries with cheaper labor and favorable trade policies. China, in particular, became the “world’s factory,” while emerging economies like Vietnam, Bangladesh, and Mexico grew as secondary manufacturing centers.
However, this model also created vulnerabilities. The overdependence on a few key suppliers and logistical routes meant that any disruption—whether a natural disaster, pandemic, or political tension—could paralyze entire industries. The 2008 global financial crisis and the 2020 pandemic both exposed these structural weaknesses, sparking a paradigm shift from efficiency-driven globalization to resilience-driven regionalization.
This historical backdrop set the stage for today’s reconfiguration of global trade and supply chains.
2. The Decline of Traditional Globalization
The forces of globalization—free trade, open markets, and integrated supply networks—are no longer the sole organizing principles of world commerce. Instead, nations are turning inward or aligning with regional blocs.
Key drivers of this shift include:
Trade Protectionism: The US–China trade war initiated in 2018 marked a turning point. Tariffs on hundreds of billions of dollars’ worth of goods disrupted established supply chains and forced firms to reconsider sourcing strategies.
National Security Concerns: Sensitive technologies, semiconductors, and critical minerals are now treated as strategic assets. Countries are restricting exports and promoting domestic production to avoid dependency.
Pandemic Disruptions: COVID-19 halted global logistics, revealed the fragility of “just-in-time” supply chains, and accelerated the adoption of “just-in-case” models emphasizing inventory buffers and regional diversification.
As a result, global trade growth has slowed. According to the World Trade Organization (WTO), the share of global trade in GDP has plateaued since 2015, signaling a structural slowdown in hyper-globalization.
3. Regionalization and the Rise of New Trade Hubs
A major trend reshaping global trade is the regionalization of supply chains. Instead of sourcing components from far-flung regions, companies are building shorter, more localized networks to reduce risk and improve resilience.
Key examples include:
Asia-Pacific Integration: While China remains central, production is increasingly distributed across ASEAN nations—Vietnam, Indonesia, Malaysia, and Thailand. This “China + 1” strategy helps reduce dependency on Chinese manufacturing while keeping access to its vast ecosystem.
North American Reshoring: Under the USMCA (United States–Mexico–Canada Agreement), companies are bringing manufacturing closer to home, especially in sectors like electronics, autos, and semiconductors. Mexico, benefiting from proximity to the US, has emerged as a major reshoring destination.
European Realignment: The EU is striving for “strategic autonomy” by strengthening internal supply networks, investing in renewable energy, and reducing reliance on Russian gas and Chinese raw materials. Eastern European nations like Poland, Hungary, and the Czech Republic are gaining traction as nearshoring hubs.
Regionalization doesn’t mean de-globalization—it represents a reconfiguration where trade flows become more concentrated within strategic clusters rather than globally dispersed.
4. The Digital Revolution and Smart Supply Chains
Technology is fundamentally transforming how global supply chains operate. Digital tools—ranging from artificial intelligence (AI) and blockchain to the Internet of Things (IoT) and advanced data analytics—are making supply chains smarter, more transparent, and adaptive.
Key technological impacts include:
AI-driven demand forecasting: Firms now predict market shifts with greater precision, reducing overproduction and wastage.
Blockchain for traceability: This ensures transparency across complex multi-tier supplier networks, particularly vital in industries like pharmaceuticals, food, and luxury goods.
Automation and robotics: Advanced robotics and 3D printing are reducing the cost differential between developed and developing countries, encouraging some industries to “reshore” production.
Digital trade platforms: Cloud-based trade management systems are facilitating faster customs clearance and cross-border documentation.
Digitalization thus acts as a “force multiplier,” enabling efficiency even within shorter, regional supply chains.
5. Geopolitical Tensions and Strategic Supply Chains
Geopolitics now plays a decisive role in shaping global trade patterns. The rivalry between major powers—particularly the US and China—has spilled into areas like technology, finance, and infrastructure.
Examples of this geopolitical fragmentation include:
The US–China Tech War: Restrictions on semiconductor exports, Huawei’s global ban, and supply chain decoupling efforts in critical tech sectors.
The Russia–Ukraine Conflict: Disruption in global energy and food supplies led Europe to accelerate diversification away from Russian dependence and invest in renewable alternatives.
Taiwan’s Semiconductor Dominance: Taiwan’s TSMC produces over 60% of the world’s advanced chips, making it a geopolitical flashpoint. Nations are now racing to build domestic semiconductor capabilities.
Governments worldwide are responding with industrial policies—such as the US CHIPS Act and the EU’s Green Deal Industrial Plan—to strengthen domestic supply resilience and reduce strategic vulnerabilities.
6. Sustainability and Green Supply Chains
Sustainability has become another key pillar shaping global trade. Corporations and countries are now judged not just by efficiency but by environmental and social responsibility.
Emerging sustainability trends include:
Carbon Border Adjustments: The EU’s Carbon Border Adjustment Mechanism (CBAM) will impose tariffs on carbon-intensive imports, encouraging cleaner production methods globally.
Circular Supply Chains: Companies are reusing materials, recycling components, and designing products for longevity—reducing dependency on raw material imports.
Renewable Energy Integration: Nations are aligning trade policies with green energy goals, influencing logistics routes and energy-intensive production locations.
This “green reindustrialization” is creating new opportunities for economies investing in clean manufacturing and renewable technologies, while penalizing those relying heavily on fossil fuels.
7. Emerging Markets: The New Centers of Trade Gravity
While developed economies are reshaping strategies for security and sustainability, emerging markets are becoming the new growth engines of global trade.
India: With its large labor force, pro-manufacturing policies (like “Make in India”), and digital infrastructure, India is positioning itself as a credible alternative to China for global manufacturers.
Vietnam and Indonesia: Both are attracting massive FDI inflows in electronics, apparel, and automotive sectors as part of the “China + 1” diversification strategy.
Africa: The African Continental Free Trade Area (AfCFTA) is creating a single market of over a billion people, opening new avenues for intra-African trade and global partnerships.
Latin America: Mexico and Brazil are emerging as nearshoring hubs for North America and Europe respectively.
These shifts mark a rebalancing of global economic power, where trade is less dominated by a single country or region and more evenly distributed across multiple growth centers.
8. The Logistics Revolution: Ports, Corridors, and Connectivity
Global trade depends not only on production but also on transport and logistics. Recent developments show a massive reorientation of global transport networks.
Alternative Shipping Routes: The Russia–Ukraine war and tensions in the Red Sea have redirected maritime traffic toward longer but safer routes, impacting global shipping costs.
India–Middle East–Europe Economic Corridor (IMEC): Announced in 2023, this new trade corridor aims to counterbalance China’s Belt and Road Initiative by linking India with Europe via the Middle East.
Automation in Ports: Smart ports and AI-based logistics management are reducing turnaround times and improving efficiency in global trade routes.
The next phase of trade will rely on infrastructure intelligence—where logistics are powered by data, automation, and alternative energy.
9. Supply Chain Resilience: From Just-in-Time to Just-in-Case
The traditional “just-in-time” model—minimizing inventory to cut costs—proved fragile under recent crises. Today, supply chain resilience has become a corporate priority.
Resilience strategies include:
Diversification of suppliers and locations to avoid overreliance on one country.
Inventory buffers for critical materials like semiconductors, lithium, and rare earths.
Multi-shoring and friend-shoring—favoring trade with politically aligned or nearby nations.
Scenario planning and stress testing to anticipate disruptions.
Resilience no longer means inefficiency—it is an investment in stability and strategic independence.
10. The Future of Global Trade: Multipolar, Digital, and Sustainable
The future of global trade will be multipolar, digital, and sustainability-driven. Power will no longer be concentrated in one global hub like China or the US, but spread across multiple regional clusters—each specializing in distinct industries.
Key trends for the next decade include:
Expansion of digital trade agreements (like the Digital Economy Partnership Agreement, DEPA).
Integration of AI and data analytics for predictive supply chain management.
Growth of sustainable trade finance linked to ESG (Environmental, Social, Governance) metrics.
The rise of cross-border e-commerce as small businesses join global trade through digital platforms.
In essence, globalization is not disappearing—it is evolving into a more complex, technology-enabled network of regional and digital ecosystems.
Conclusion: The Great Reconfiguration
The global trade system is undergoing its most profound transformation in decades. The twin forces of geopolitical realignment and technological innovation are redrawing the map of commerce. Efficiency is no longer the sole metric of success—resilience, sustainability, and strategic autonomy now define the new era of global trade.
Nations that adapt to these shifts—by investing in technology, building sustainable industries, and forging resilient partnerships—will lead the next chapter of globalization. Meanwhile, those clinging to old models of cost-driven offshoring may find themselves sidelined in an increasingly fragmented but interconnected world.
The global trade landscape of the 2030s will thus be characterized not by the dominance of any single power, but by the emergence of a networked, multipolar world—where innovation, adaptability, and trust define the flow of goods, data, and ideas.

$BTC UPDATE: As mentioned in our Sunday update,CRYPTOCAP:BTC UPDATE:
As mentioned in our Sunday update, we said if Bitcoin holds above $110K, a move toward $115K–$117K is possible, and that target has been hit perfectly. Now the market is turning bearish again. We are still in a bearish structure, and a move below $100K remains our main target.
There’s support around $107K–$108K; if Bitcoin holds this area, some sideways movement is possible, but overall, our structure remains bearish.
FLM , GETTEX:KDA , $PERP #BTC , #더블유 , #kite , #enso , #Trump , #FOMC , #COAI

BTC/USD Bullish Trend breakdown triple top pattern breakdown🚨 #BTCUSD Technical Update (1H Timeframe) 🚨
🔸 Bitcoin showing strong bearish momentum after a bullish trend breakdown and confirmation of a Triple Top pattern.
🔻 Breakdown Entry: 113,100
📉 Targets:
• 1️⃣ 112,400
• 2️⃣ 111,300
⚠️ Note: Use proper risk management — protect your capital at all times!
💬 Like 👍 | 💭 Comment 💬 | 🔁 Share to support the analysis!
#Bitcoin #BTC #CryptoTrading #TechnicalAnalysis #PriceAction #TradingSetup #CryptoCommunity

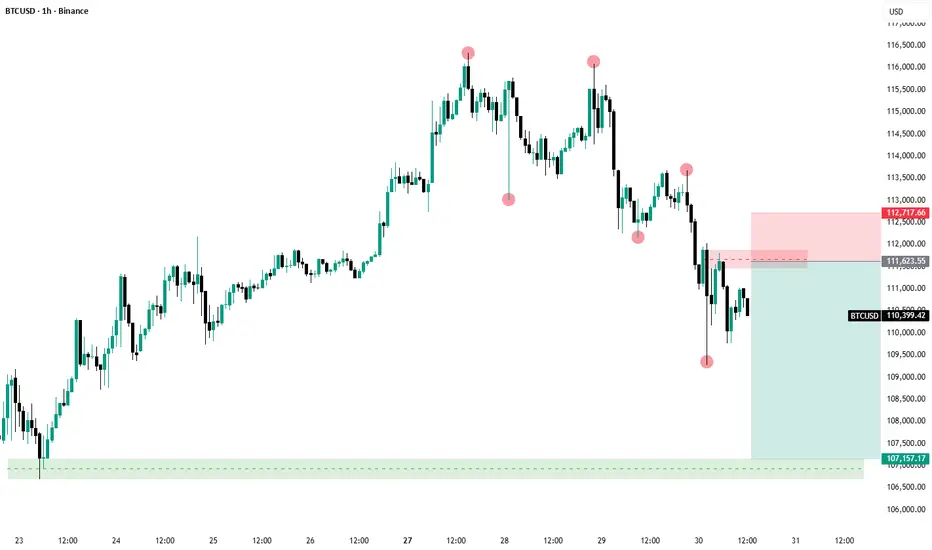
Bitcoin Set to Continue Downwards?This analysis is based on the BINANCE:BTCUSD 1-hour chart, which clearly suggests a short-term bearish bias after the price failed to sustain highs near $116,000. The market structure has shifted decisively, marked by a succession of lower highs and lower lows (LHLH), indicating that the significant prior upswing is now undergoing a deep correction or reversal. The price action at the top demonstrates a potential "three-tap" structure, a common sign of exhaustion and a precursor to a major trend change.
Following the breakdown, the area between $111,600 and $112,000 has become a critical resistance zone (supply zone). The current trade setup is positioned as a short entry within this resistance band, specifically around $111,423.55 - $111,600.00, aiming to capture the continuation of the bearish momentum as the market retests the previously broken support.
The stop loss is strategically placed just above the resistance at $112,717.86 to manage risk, while the ambitious take profit target is set much lower at $107,157.17. This target aligns with a major liquidity and demand zone (the green box) that was instrumental in launching the previous rally, offering a highly favorable Risk/Reward ratio.
BTC Bullish Scenario (Elliott Wave – Wave 5 in Progress)The price action continues to respect the Elliott Wave structure, suggesting we may be entering the fifth impulsive wave. After a strong rally in Wave 3 followed by a healthy ABC correction (Wave 4), the asset is showing early signs of a trend continuation.
As long as the price holds above the Wave 4 support region, the outlook remains bullish, with potential targets at the 1.618 Fibonacci extension of Wave 3, or near the previous highs depending on buying strength.
🔹 Bullish Confirmation: breakout above the Wave 3 high with increasing volume.
🔹 Invalidation: breakdown below the Wave 4 low (could indicate a broader corrective pattern).
In summary, the market structure remains technically strong, signaling a possible continuation of the uptrend toward the completion of Wave 5.

Has Bitcoin Topped...End of the 4year Cycle?Has Bitcoin Topped...End of the 4year Cycle?
As indicated in previous Updates:
1) Immediate Support
A)W50ema, currently at ~$100k (since it is a moving, it could be higher in the next few weeks)
B)The 50% fib retracement $97k
If the above supports are reached, the W21ema will become the ultimate resistance.
2) Marco support:
Macro Support is the W100ema/M21ema currently at 87-83k.
If/when price gets to this stage, the W21ema will also be the resistance to look for.
Note:
For the bearish downtrend to be invalidated, price must regain the W21ema and the Wmacd must get back positive.


BTCUSD break its bearish consolidation, expecting 90ish level..I saw a good sign today as BTCUSD broke its consolidation heading to the south.
The next downward movement should aim 90k-95k area..
Let's go, BEAR!
CHEEERRRSSSSSS..!!!

Buy the fearI still believe BTC has a good chance of reversing upward from here, although the market remains indecisive. If we move lower, the 100k level would be the ultimate test of hodlrs’ patience and would likely create a fire sale that gets bought up quickly.

"Bitcoin : Potential Bounce from Support Toward $11This Bitcoin (BTC/USD) 1-hour chart shows a potential short-term bullish setup. After a recent decline, the price is testing a support zone around $110,500, highlighted by the lower purple line. The chart suggests a possible rebound toward the upper resistance zone near $113,600–$114,000, indicated by the blue arrow. A move above this resistance could confirm bullish momentum, while a break below support would invalidate the setup.

Bitcoin strong, Dominance weak.Bitcoin maintained its strength above the major uptrend and support zone, while BTC Dominance broke below the major uptrend and also received confirmation of a retest of the major resistance and major uptrend for the downside.
For altcoins, this is a trend towards the beginning of a new momentum.

$BTC about to skyrocket BITSTAMP:BTCUSD has contacted the daily 🔴 demand zone. We are waiting for 1H momentum. Shirt inside the Daily demand zone.NOTE THAT "MEDIUM MOMENTUM IS EXPECTED"↗️↗️

btc await breakout#BTCUSD stands between the third pattern rejection which still holds drops till 101800 to reverse back on buy. We buy when breakout on M15-30 closure above 105541.
Breakout on M15-30 closure at 105541 buy, target 107300, SL 104511.
Below the rectangle 104500 holds strong bearish which will drop till 101800 to form new buy range.

BTCUSD: Narrow-range consolidationToday, BTCUSD overall showed a trend of bottoming out with a slight rebound followed by a narrow-range consolidation, with price movements being volatile and fluctuating. In the morning, prices remained under pressure, fluctuating below 103,500, then rebounded quickly, but the upward momentum was weak, encountering obvious resistance below 105,500.
The short-term resistance above focuses around 106,000. Only a breakthrough of this level accompanied by increased trading volume can confirm a short-term reversal signal. Further resistance can be watched at 108,000; a firm hold above this level would give bulls the opportunity for a sustained rebound.
For support below, close attention should be paid to 102,000. If this support level is breached, prices may further test 99,800. As a key psychological and technical support level, a break below 100,000 could trigger more stop-loss orders, exacerbating downward pressure.
Currently, BTC's short-term trend is relatively weak but supported, and it is likely to consolidate in the 102,000 - 105,500 range.
In terms of operation, it is recommended to adopt a strategy of buying low and selling high with quick entries and exits. Do not blindly chase the upward trend; instead, patiently wait for prices to break through key ranges with increased volume and for the trend to clarify before adjusting positions to reduce trading risks.
Trading Strategy:
Buy 103,000 - 103,500
SL 102,500
TP 104,500 - 105,000 - 105,500
Sell 105,500 - 106,000
SL 106,500
TP 104,500 - 104,000 - 103,500

BTCUSD: Bulls Defend $102K Zone — Eyeing Breakout Toward $107KHello everyone, here is my breakdown of the current Bitcoin setup.
Market Analysis
BTCUSD is trading within a well-defined triangle formation after a period of volatile movements between $102,500 and $107,000. The chart shows that price recently rebounded from the Triangle Support Line, aligning with the $102,000–$103,000 Support Zone, where buyers have consistently stepped in to defend this level. This zone has acted as a strong accumulation area, confirmed by multiple bounces and rejection wicks signaling absorption of selling pressure.
Currently, after a fake breakout to the downside, BTCUSD quickly recovered, retesting the Resistance Zone near $105,000–$105,500, which also aligns with the Triangle Resistance Line. This confluence area represents the next key reaction point. A confirmed breakout above this resistance would indicate a potential continuation of the broader bullish trend, while a rejection here could lead to a short-term correction back toward the support base. The market behavior shows constructive consolidation, with higher lows forming along the support trend line — a sign that buyers are gradually regaining control. As long as BTCUSD remains above $102,000, the short-term structure favors further upside movement within the triangle, aiming toward the $106,500–$107,000 resistance area.
My Scenario & Strategy
As long as Bitcoin holds above the $102,000–$103,000 Support Zone, the bullish outlook remains valid. The first upside objective (TP1) is the $106,500–$107,000 Resistance Area, where traders should watch for potential rejection or breakout signals. A confirmed breakout and close above $107,000 could trigger an extension toward $109,000–$110,000, aligning with the upper boundary of the triangle and the previous reaction zone.
However, if BTCUSD fails to hold above $102,000, this would invalidate the bullish scenario and open the way for a deeper pullback toward $100,000–$99,000, where fresh buying interest may emerge. For now, the structure supports buying pullbacks while price remains above the ascending Triangle Support Line, as momentum continues to favor the bulls.
That's the setup I'm tracking. Thank you for your attention, and always manage your risk.

BTC - 11/12 hourly chartI adapted the accumulation trend from a daily trend to a 4hr trend since it broke yesterday down to a 1hr FS support level created 7th Nov 23:00
I added a new 1hr FS support level created the 12 Now at 00:00 hours which sits at $103,623
T.A explained -
BackSide (BS)
FrontSide (FS)
Inverse BS (Inv.BS)
Inverse FS (Inv.FS)
BS & FS levels are expected support when dashed lines, tested when dotted and resistance when solid lines.
The inverse is true for the Inv. BS Inv. FS levels, they are resistance as dashed lines, tested as dotted and support as solid lines.
Monthly timeframe is color pink
weekly grey
daily is red
4hr is orange
1hr is yellow
15min is blue
5min is green if they are shown.
strength favors the higher timeframe.
2x dotted levels are origin levels where trends have or will originate. When trends break, price will target the origin of the trend. its math, when the trend breaks, the vertex breaks too so the higher timeframe level/trend that breaks, the more volatility there could be as strength in the orders flow in to fuel the move.
yesterday
Trade closed manually
price followed the candle science and timeframes from the 5min green levels to the weekly grey level. Price has left behind some inverse frontside and inverse backside candles which look to be forming the bridge to flip the script if price manages to gain those levels and start accumulation. That liquidity will "unlock" and fuel price action.

$BTC - FTX Style reaccumulation. Just going to leave this here to follow along. If this was the same style reaccumulation, and reversal we saw back then, the next step would be a move higher into the range, and last point of supply, before the sign of strength move which would bring us back to the top of the range.
Granted, this is at elevated prices, rather than after a major bear market, but the capitulation on Oct 11th actually far exceeded the liquidation event when FTX collapsed.
Not trying to be a predictor, or hero here, but this is worth bringing up.
This is inline with a few of our schematics from our channel, and we have alternative plans for downside if this failed. Give the bull case some credit until proven otherwise in a Macro uptrend.

BTCUSD | Bearish Range | Daily — Market on Hold Ahead of CPIBTCUSD’s still in a bearish structure, bouncing between the two volume fractal pivots — 106463 and 100996. It’s hanging near the bottom of the daily range (116410 to 98892) with no clean push either way. Volume flow’s midrange around 108333, showing balance — no real momentum. With dollar strength and CPI data on deck this week, the market’s just soaking liquidity and waiting for the next macro trigger to hit.
Volume tells the truth before price does!
-core5dan

BTC Bullish ScenarioFollowing up on my BTC bearish scenario , price has come down as expected and is looking to establish a base.
So far price has managed to stay within the channel respecting the macro bullish trend.
Still bullish until price fails to hold this channel.
A bullish scenario would be price retracing and planting a HL respecting the bullish trend.
Fib time gives me the end of 1st week of December for a low to be planted and should price maintain the channel (give or take a wick on 4 hr below), then I would expect price to push up to test the top of the descending channel potentially looking for a breakout.

Taurus Acquisition: Built on Transparency, Driven by TrustIn an industry where confidence is everything, traders today expect more than just fast execution or competitive spreads.
They want transparency, real accountability, and a broker that puts client trust at the center of every decision.
That’s where Taurus Acquisition stands out. Through verified performance data, clear communication, and open customer relations, the platform continues to strengthen its reputation as a legit and reliable broker — not through promises, but through proof.
Trust Starts With Transparency
For years, the financial sector has been challenged by opacity. Hidden fees, unclear execution models, and delayed withdrawals have eroded confidence in countless trading platforms.
Taurus Acquisition takes a different path.
Its operational framework is built on open reporting, user verification, and consistent updates.
Traders know exactly how orders are executed, how funds are handled, and what timelines to expect.
This transparency — mentioned frequently in Taurus Acquisition reviews — has become a key factor in why both new and experienced investors continue to rely on the platform.
Proof Over Promises
Many traders today ask the same question before joining a platform:
“Is taurus acquisition com legit, or just another marketing name in the crowd?”
What makes the answer convincing isn’t a slogan — it’s evidence.
Taurus Acquisition’s credibility is reinforced through:
Clear fee structures displayed before every transaction;
Fast withdrawal processing with timestamped confirmations;
Account protection standards aligned with industry best practices;
Responsive communication, verified in user feedback and independent discussions.
This track record has helped distance taurus acquisition com from unverified competitors or “too-good-to-be-true” claims often associated with scam platforms.
By focusing on verifiable results, the company has positioned itself as one of the few brokers where accountability is measurable — not implied.
Building Long-Term Confidence
Trust isn’t built overnight — it’s earned through consistency.
For Taurus Acquisition, that means delivering the same level of reliability on day 1,000 as on day 1.
Clients who have traded on the platform for multiple years highlight the same themes in their feedback:
✔️ Predictable system uptime, even during high market volatility;
✔️ Transparent trade reporting and history tracking;
✔️ Support teams that solve issues, not deflect them;
✔️ Continuous feature development based on client input.
In the competitive world of trading, where brand loyalty is rare, taurus acquisition com reviews suggest the company’s stability has become one of its strongest differentiators.
The Role of Communication in Trust
Beyond the charts and execution metrics, trust often comes down to communication.
Taurus Acquisition maintains open channels between traders and support — from live chat to direct email updates — ensuring users always understand what’s happening with their accounts.
This focus on clarity is not a minor detail; it’s a philosophy.
Traders repeatedly mention that being able to talk to real people who listen and respond quickly makes a difference — especially when markets are unpredictable.
For many, this transparent communication is what confirms taurus acquisition com as a legit, trustworthy choice.
Why Transparency Will Define the Next Era of Trading
The trading landscape is evolving fast. Regulations tighten, AI tools grow more advanced, and clients demand verifiable transparency.
In this environment, trust is the new competitive edge.
Taurus Acquisition recognizes that — and continues to invest in systems that make reliability visible:
Audit-friendly reporting for transactions and liquidity data;
Segregated custody structures for client funds;
Real-time status dashboards for account operations.
Each initiative reinforces the same message: transparency is not optional — it’s foundational.
In every market cycle, brokers rise and fall — but the ones that last are those built on trust.
Taurus Acquisition has positioned itself in that category by staying consistent, verifiable, and responsive.
As traders look for stability in 2026 and beyond, taurus acquisition com continues to prove that reliability isn’t a claim — it’s a daily practice supported by evidence, user confidence, and open communication.
About Taurus Acquisition
Taurus Acquisition Ltd.
22 Bishopsgate, London, England, EC2N 4BQ
Company Number: 07705676
Taurus Acquisition is a financial services platform offering transparent trading solutions, flexible tools, and 24/7 support. With an emphasis on integrity, compliance, and measurable performance, the company aims to make global investing more accessible and trustworthy."

Broker Trustworthiness in 2025: Regulation, Reviews & Real-WorldIn 2025, traders no longer choose brokers based on flashy bonuses or influencer ads.
The conversation has changed — from “Who offers the biggest leverage?” to “Can I trust this platform when it matters most?”
This shift toward data, transparency, and regulatory compliance is reshaping how brokers earn reputation — and how traders decide where to trade.
1. From Marketing to Measurable Trust
The trading industry has matured.
After years of exchange collapses, hidden fees, and fake reviews, today’s traders value consistency over hype.
Platforms like Enterprise2u.com, Kraken Canada, and other FINTRAC-registered brokers are gaining traction — not because of aggressive marketing, but because of proof-based credibility.
When traders search “Enterprise2u reviews”, they’re not looking for slogans — they’re looking for facts:
How fast are executions during volatility?
Are withdrawals processed on time?
Is the broker actually regulated and transparent about fees?
2. The Three Pillars of a Legit Broker
The new trust model in 2025 stands on three key pillars:
✅ 1. Regulation
Real brokers are licensed and supervised.
In Canada, that means registration under FINTRAC as a Money Services Business (MSB) — ensuring full AML/KYC compliance.
You can verify any platform’s status on FINTRAC’s official registry
🔍 2. Transparency
Hidden spreads and mystery fees are deal-breakers.
Legit brokers publish:
exact commission structures,
funding/withdrawal conditions,
and public risk disclosures.
Enterprise2u, for instance, lists its fee policy openly and provides clear guidance on withdrawal timelines (typically 1–3 business days).
3. Execution Data
Performance matters more than promises.
Modern brokers now include execution logs, latency data, and order audit trails — giving traders measurable confidence that orders are filled fairly.
3. The Rise of “Verification-First” Reviews
Online broker reviews have also evolved.
Five years ago, they were mostly emotional — now they’re analytical.
When traders leave Enterprise2u reviews, the most common points are:
consistent order speed,
transparent withdrawals,
clear KYC communication,
and responsive support.
The repetition of these points across multiple forums (Reddit, Trustpilot, TradingView comments) is what makes them credible.
Consistency is the new authenticity.
4. Why Regulation Isn’t a Burden — It’s a Signal
Many new traders still fear that regulation limits freedom.
In reality, it protects both sides.
A regulated broker must:
separate client funds from operational capital;
maintain transaction records;
and respond to FINTRAC audits.
That means your deposits are traceable, your data is secure, and your withdrawals can’t “go missing.”
For traders, compliance isn’t bureaucracy — it’s insurance against chaos.
5. Case Study: Enterprise2u’s Model of Measurable Reliability
Let’s look at what makes Enterprise2u.com a case study in credibility:
FINTRAC & MSB registration: Verified compliance within Canada’s legal framework.
Transparent withdrawals: Published timeframes, no hidden charges, tracked status.
Human support: 24/5 live assistance with real agents.
Segregated accounts: Funds stored separately from company operations.
These may sound like technical details, but they build the foundation of long-term trust.
Enterprise2u doesn’t advertise perfection — it documents performance.
That’s the real differentiator.
6. How Traders Should Evaluate Brokers in 2025
Here’s a simple checklist to evaluate any platform:
Regulatory footprint:
Is the broker FINTRAC-registered (for Canada) or licensed by FCA/CySEC (for global operations)?
Transparency test:
Are fees, spreads, and withdrawal policies public — or hidden until you deposit?
Execution verification:
Does the platform provide data or third-party metrics?
User feedback consistency:
Do reviews mention the same strengths or repeat generic praise?
If a platform passes all four tests, you’re likely dealing with a legitimate broker — not a marketing illusion.
7. The Broader Trend: From Noise to Proof
In 2025, trust has become a performance metric.
The top brokers are not those with the biggest ads, but those with the smallest discrepancy between promise and reality.
That’s why platforms built on compliance, execution transparency, and open reporting — like Enterprise2u — continue to outperform louder, offshore competitors.
When traders ask “Is Enterprise2u net legit?” or “Which brokers are safe in 2025?”, the real answer isn’t in headlines — it’s in habits.
✅ Verify registration.
✅ Track withdrawals.
✅ Compare fees.
✅ Read consistent, not emotional, reviews.
Trust is no longer a feeling — it’s data you can verify.
And in today’s volatile markets, proof is the most valuable currency a broker can offer.
