BTCUSD UPDATE Yesterday, BTCUSD hovered near 106,463, staying quiet most of the day.
This morning, the Euro session broke that balance — ran yesterday’s high, triggered stops, and dropped fast. ETF inflows that pushed price earlier in the week slowed down.
Funding turned negative, showing traders are less confident short term.
Now price trades lower, and yesterday’s low is the next level everyone’s watching.
Macro Outlook
Markets are leaning defensive.
Yields up. Dollar steady. Stocks soft.
Bitcoin’s moving with that tone as flows cool off and liquidity thins out.
Until that changes, BTCUSD stays under pressure with weak momentum and cautious buyers.
Market Structure Mapping (MSM — The Framework)
Structure still leans bearish, but there’s no confirmed break yet.
Price is trading away from the last discount pullback, holding below the Euro session high.
Downside focus sits near 104,240, then 101,500, where equal lows and liquidity line up.
If yesterday’s low breaks clean, the bearish leg extends.
For now, price is drifting lower — not broken, just soft.
CORE5 Rule — “Trade what’s confirmed, not what you think.”
— CORE5DAN
Institutional Logic. Modern Technology. Real Freedom.
Trade ideas

Bitcoin Short Setup From Premium Zone
The market is showing a clear 1H break of structure, with price approaching a strong resistance area. After a bullish impulse, BTC is expected to pull back from resistance for a short-term correction.
Key Levels:
Sell Entry: Around 106,000
Stop Loss: 106,700
Take Profit: 104,100
Reasoning:
Technically:
Price has completed a clear bullish leg and tapped into the 1H resistance area. The structure suggests exhaustion with the potential for rejection. A lower high formation suggests bearish correction toward the 1H support zone.
Fundamentally:
Market sentiment remains cautious as BTC faces resistance amid uncertainty in broader crypto risk appetite and mild dollar strength. Short-term selling pressure may dominate before any new bullish continuation.
Disclaimer:
This analysis is for educational purposes only. It is not financial advice. Always manage risk before trading.

BTC likely higherBTC looks ready for a multi week run, just needs the pieces to come together... start with the gov re-opening which is only a matter of time

BTC Daily Outlook | November 10th, 20251hr timeframe on BTC is looking very clean pushing into higher prices. Nice BOS to the upside and price is currently inside the range under 106608.2.
I want to see that high taken out and enter inside the lower timeframes for long opportunities.

$BTC plan after monday rangeThis is my CRYPTOCAP:BTC plan after the monday range. I will let the price action make the decision for me. For both shorts or longs I will enter on a retest of the monday range. Simple plan, and work with triggers.

BITCOIN Potential Bear Market Structure: Nov 10th 2025After breaking down below the W21ema, Btc has found a temporary support at the projected area of $100-97k (see W#42 Update)
Now the immediate resistance from this bounce is $108-111k (if it gets there), which was the previous support coupled with the W21ema sitting right at ~$110k as well.
The next major support is at the W100ema/M21ema at $84-88k.
W21ema, would continue to be a targeted resistance if/once the W100ema is hit.
Note:
For the bearish downtrend to be invalidated, price must regain the W21ema and the Wmacd must get back positive.

BTC Short IdeaLooking for a continuation in price action.
Wanting to see a price divergence as price enters the level to take a quick short scalp.
All indicators in use a public.

Example of how I personally chart on BTC, SOL, & SUIVery Brief overview of how I chart in tradingview.
All scripts displayed in this video are publicly available in tradingview.
1. What I use to set up points of interest on the chart (MAP)
2. How I try to identify price direction (Compass)
3. What I use as a trigger to enter trades (Trigger)
(MAP)
I use psychological support and resistances using the monthly, weekly, and daily time frames.
I then pull FIB levels using the 0.65, 0.618, and the 0.786 levels
Lastly I use the fixed range volume profile tool to identify value area highs, value area lows, and the Point of Control from the 1 month, 6 month, and yearly time frame.
(Compass)
I use basic price action to determine possible price direction.
Uptrends, downtrends, and ranges.
(Triggers)
Public scripts that include RSI or the Lazy Bear Indicator to identify price divergence.
Like all strategies, this is not perfect. It just helps me make decisions and come up with my bias towards the market. It helps me with planning and execution. Maybe something in this video may give you ideas or help others identify tools that they have not studied yet.


Understanding AI in Trading: How Machines Actually TradeWhat if you were one solid AI model away from the life you pictured, the dream house, and that shiny Lambo in the garage?
Can AI really level the playing field so retail traders operate like pros, or is it quietly widening the gap between individuals and institutions?
Let’s strip the hype, keep the power, and see how machines actually hit the market.
From Concept to Application
An AI trading system, or more precisely a machine learning system, learns from data. It processes massive historical datasets with hundreds of variables, indicators like RSI, MACD, or Bollinger Bands, as well as macro data such as interest rates, employment figures, or even alternative data. If it’s a number, the model can read it.
It works across different time horizons, from sub minute intraday data to decades of monthly charts. That range depends on the model’s design and the kind of patterns it is built to detect.
Once the data and time frames are defined, the machine uses math, linear algebra and optimization, to uncover relationships that humans usually miss. Whether it is a simple regression, a computer-vision network that “reads” price charts, or a multi-agent setup that delegates tasks between bots, the foundation is always the same: matrices and optimization. That’s how machines think.
Broadly speaking, machine intelligence is based on reproduction, not prediction. It doesn’t see the future; it measures the past and projects tendencies forward.
A Machine Learning Tool in Practice
Let me show you how this looks in real life through a model that completely reshaped how I trade. It's simple enough for any retail trader to use, yet solid and rigorous at its core.
For a better understanding, see the model chart here:
1. Discovering True Market Structure
The model builds what I call a main channel, a living corridor that learns how price naturally moves. The slope of this channel instantly shows if the market mood is bullish or bearish, while its angle reveals the strength behind that move.
The width of the channel speaks the language of risk. It shows how far price can deviate from its mean before breaking the pattern recognized by the machine. In simple terms, it measures how much turbulence the market can handle before the trend truly changes.
Think of it as Bollinger Bands on steroids: self-adjusting, smoother, and far more adaptive.
Around the price, you’ll see pale white dots, the model’s built-in risk sensors. They turn volatility into a visual map that shows where normal movement ends and real danger begins.
As long as price stays on one side of the dots, the trend remains intact. When it pushes through and the dots flip sides, that’s your early alert that a counter-move is coming, even if the main trend is still valid.
Those dots also serve as smart stop-placement guides. They adapt faster than the main channel, letting you protect profits without reacting to noise. It’s like having a smaller, agile pilot inside a bigger, steady aircraft.
When price crosses from below to above the dots, strength returns; when it drops below, momentum fades. That’s where AI logic meets classic technical analysis, confirming what your eyes sense and your instincts suspect.
2. Checking Sentiment in Motion
Below the chart, a lower panel acts like the emotional dashboard of the market. It shows not just what prices are doing, but what traders are feeling.
The histogram works as a health monitor. When it stays green, buyers dominate and the market is healthy. When it turns red, sellers take over and caution becomes the smart play.
Then comes the red line, the true heartbeat of machine intelligence. This is where AI shows its edge. The model constantly scans for contradictions within the trend, searching for anomalies that human eyes often miss.
When that red line suddenly collapses, it is the machine whispering that something unusual is forming, often signaling that a move is running out of steam and a sharp countertrend swing is near. Those moments are pure gold for taking profits or positioning early for a reversal, often with massive reward-to-risk potential.
For instance, in the chart attached, the red line collapsed just one day before BINANCE:BTCUSDT reached its all-time high. While price action was euphoric and traders were celebrating new records, the model flashed a silent warning. Days later, the market unraveled, triggering the largest liquidation event in crypto history.
3. Measuring the Health of the Phase
To simplify reading conditions, every candle on the chart is color-coded to match the current market phase:
Green means bullish momentum is on your side.
Yellow or orange signals transition, time for patience.
Red marks bearish pressure, a moment for defense.
These colors intentionally react slower than price, filtering out emotional whiplash. They confirm when a move is genuine and warn when enthusiasm is fading.
This visual layer gives you something most traders lack: context. In one glance, you can tell if the market is confident, cautious, or fearful, and align your decisions accordingly.
Can AI Really Close the Gap Between Retail and the Pros
The example above shows what happens when machine learning is used with intention. It doesn’t replace judgment; it amplifies it. It adds depth, color, and precision to analysis, turning raw data into clear, confident action.
Still, every trader wonders the same thing: is AI the holy grail everyone’s been chasing?
Here’s the truth. AI excels at spotting patterns in stable, predictable environments, that’s why your phone finishes your sentences and why ChatGPT feels almost magical. It operates in a world where rules rarely change.
The market is the opposite. It breathes, shifts, and reinvents itself daily. That constant change is what makes it fascinating, and what makes it hard for machines to predict with precision.
A trading model must relearn often. It adapts, forgets, and learns again. Its accuracy will never match that of a chatbot or an image generator because markets are alive. That’s where human judgment becomes essential. Only a person can see context, interpret uncertainty, and decide when a model has lost its edge, needs recalibration, or belongs in the trash bin.
This is why large institutions employ entire teams of quants to monitor and update their systems. Machine learning is not a one-time task; it’s a continuous process of evolution.
Bottom Line
AI in trading isn’t a crystal ball. It’s a mirror that reflects how markets behaved and projects those patterns into the near future. It doesn’t think or feel, but it can see relationships most traders miss.
Used correctly, AI gives retail traders access to capabilities once reserved for hedge funds and prop desks. You can now detect patterns hidden deep in the noise without needing a lab or a team of quants.
The key is to keep the roles clear. Let the machine handle the data. Let you handle the decisions. Use AI to frame probabilities, manage risk, and act with discipline. That’s how a retail trader turns AI hype into a real, measurable edge.

$BTCCRYPTOCAP:BTC holding 106K while the government is still trying to re-open is a liquidity test.
They want to see who steps in at these levels who wants to participate in the economic shift that’s forming.
Capital isn’t gone. It’s being repositioned.
Smart money positions before the narrative is obvious.

Testing 9SMA and 23.6 Fib . Key Week close over 50 Weekly SMA Testing 9SMA and 23.6 Fib ( from ATH till the last low 98K)
Key Week close over 50 Weekly SMA
If Week close Up 50 Weekly SMA is Bulish on BTC, because it will also closing Up 38.2 Fib from Apri Low till ATH.
(Tomorrow Premarket and Daily DXY staying down 100 is at least not Bearish.)

EVE an Adam Top Bearish Break target $92,000.-BTC under a Top Pattern with Target $92,000.-
At Golden Fib Support
Not for Short but accumulation opportunity.

Bitcoin - Mid halving Cycle Correction in 2026Bitcoin - Mid halving Cycle Correction possibility like 2021.
Bitcoin performed a mid cycle correction in 2021, of about 50% in only a few weeks just to print a new ATH weeks later. This scenario is very likely to play out when the range around $94k/ CRYPTOCAP:BTC breaks without a Bidding and is invalid when the prive returns above $104k after $94k

BTC AnalysisAfter breaking out its uptrend line, Bitcoin is completing the pullback to its trend line, while with the formation of an increasing angle pattern in the same direction with the main trend, we are witnessing fatigue in the trend. There is a possibility that the price will drop to the range of 41 to 43 thousand dollars.

BTC/USD — Weak Recovery Within Downtrend Channel (Weekly OutlookBTC/USD continues to move within a descending channel.
• A breakout above 109,375.00 (Murray ), aligned with the midline of the Bollinger Bands, could trigger an upward move toward 115,625.00 (Murray ), 121,875.00 (Murray ), and 125,000.00 (Murray ).
• Conversely, a sustained break below 100,000.00 (Murray ) would likely extend the decline toward 93,750.00 (Murray , Fibonacci 61.8% correction).
Resistance levels: 109,375.00 — 115,625.00 — 121,875.00 — 125,000.00
Support levels: 100,000.00 — 93,750.00
⸻
Technical Outlook
• Bollinger Bands: Sloping downward — consistent with continued bearish pressure.
• MACD: Stable in the negative zone — momentum favors sellers.
• Stochastic: Rising toward overbought territory, hinting at a possible near-term reversal.
⸻
Trading Scenarios
Primary Scenario (Sell Stop)
• Entry: 99,960.00
• Take Profit: 93,750.00
• Stop Loss: 104,400.00
• Bias: Bearish continuation below 100,000.00
• Timeframe: 5–7 days
Alternative Scenario (Buy Stop)
• Entry: 109,400.00
• Take Profit: 115,625.00 / 121,875.00 / 125,000.00
• Stop Loss: 105,300.00
• Bias: Bullish reversal above 109,375.00
⸻
💬 Bitcoin remains under selling pressure within its descending channel. A break below 100,000.00 could accelerate the move toward 93,750.00, while a close above 109,375.00 would mark the first sign of a potential bullish reversal.

BTCUSD H4 | Bearish Reaction off Key ResistanceMomentum: Bearish
Price is currently below the Ichimoku cloud.
Sell entry: 107,398
- Strong Pullback support
- 50% Fib retracement
- 161.8% Fib extension
Stop Loss: 111,400
- Swing high resistance
Take Profit: 99,896
- Multi-swing low support
Stratos Markets Limited (tradu.com/uk ):
CFDs are complex instruments and come with a high risk of losing money rapidly due to leverage. 68% of retail investor accounts lose money when trading CFDs with this provider. You should consider whether you understand how CFDs work and whether you can afford to take the high risk of losing your money.
Stratos Europe Ltd (tradu.com/eu ):
CFDs are complex instruments and come with a high risk of losing money rapidly due to leverage. 70% of retail investor accounts lose money when trading CFDs with this provider. You should consider whether you understand how CFDs work and whether you can afford to take the high risk of losing your money.

BTC to pump againif BTC can break above the resistance at 108k and the falling wedge then pump should be fast

InefficienciesWhen you look at a chart and it looks like it has been trading inefficiently, make sure that you make a note of those inefficiencies because the price will eventually go back to fill them.
BTC has to go down a little to fill those inefficiencies.
P.S. not a financial advice.

Bitcoin Correction Eyes $108,800FenzoFx—Bitcoin rebounded from $99,300.00 and is now trading near $106,000.00. This upward move is likely a corrective phase, with potential to fill the liquidity void up to $108,800.00.
The equal lows at $99,326.00 remain vulnerable after repeated tests. We expect the downtrend to resume once BTC reaches the bearish fair value gap near $108,000.00. If confirmed, the next bearish targets are $100,000.00 and $90,000.00. The bearish outlook remains intact as long as the price stays below $116,576.00.

Long Daily timeframewe make a series of a n uptrend we saw a break of structure recently. and enter at deman. expectin de daily supply to move down.

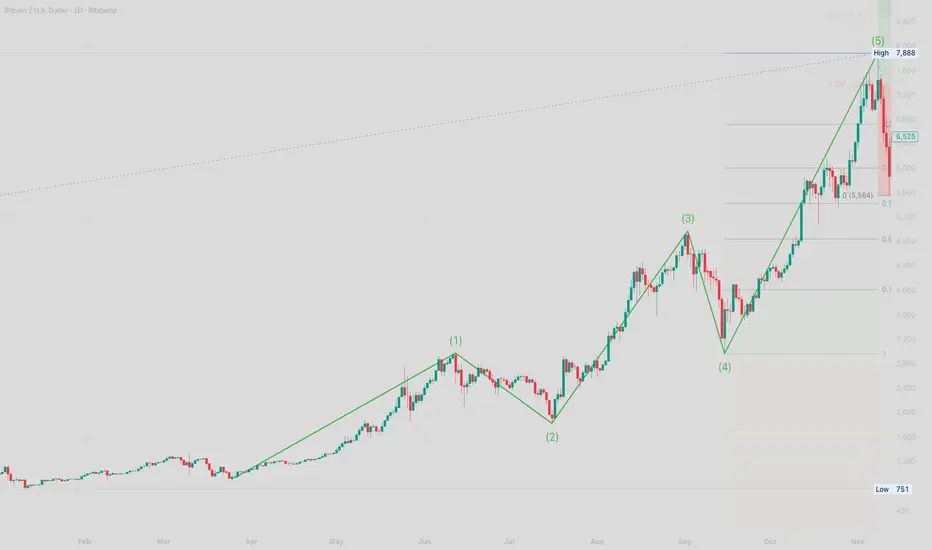
Bitcoin is looking like November in 2017Bitcoin’s current price action mirrors its 2017 cycle structure , suggesting potential for a major breakout.
Chart Structure and Pattern Recognition
This chart highlights the classic Elliott Wave five-wave pattern seen in Bitcoin’s 2017 bull run: a strong impulsive sequence (waves 1, 3, and 5) bracketed by healthy corrections (waves 2 and 4).
The move culminates in a dramatic breakout above key resistance, followed by an aggressive rally and sharp post-peak correction, capturing both trend acceleration and market psychology at a cycle top.
Implications for 2025
Bitcoin’s price structure today closely resembles the 2017 formation — both cases show a multi-month consolidation leading to breakout, followed by a parabolic fifth wave.
If this fractal repeats, Bitcoin may see another substantial rally after consolidation, echoing the euphoric breakout of Q4 2017. This suggests traders should watch for a decisive break above resistance and be mindful of rapid trend reversals near cycle highs.
BTCUSD⬆️ Buy Range: 100500 - 99000
⏹️ Stop Loss: 95900
*️⃣ Take Profit: 106200 - 109300
🔠 Due to a drop in liquidity in recent weeks, the Bitcoin price has fallen to the psychologically important 100000 mark. At this level, we expect short-term consolidation and a resumption of price growth and demand for the cryptocurrency above 106000–108000. Alternatively, the price could break through and firmly consolidate below 98000, paving the way for a price approaching 92000. We consider this scenario unlikely, but not impossible.
