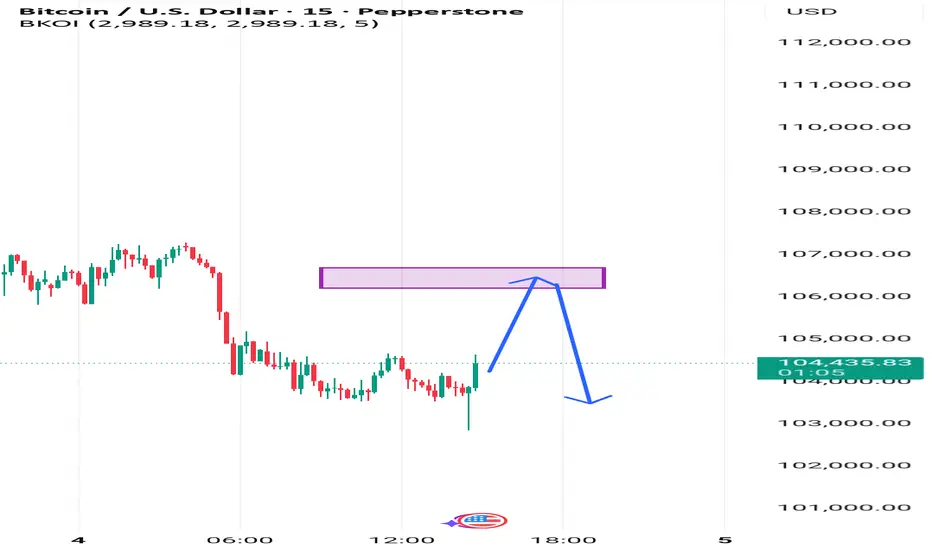
BTCUSD — NY SessionLondon session reversed yesterday’s bearish volume distribution, reclaiming short-term control above the naked point of control near 101,127 — the first lost bearish distribution now flipped higher.
That recovery showed buyers stepping back in to defend structure, with the NY open holding the move higher.
Technically, Bitcoin still trades inside a bearish market structure.
No daily highs have been broken, so the broader bias remains down.
Heavier selling pressure is expected near the unfilled distribution level at 103,819.
The full bearish range spans 104,803 (high) to 98,921 (low) — until that boundary breaks, this is a short-term trading environment, not a trending one.
🌍 Fundamental Frame (Macro Logic)
Bitcoin continues to follow the dollar’s tone, not lead it.
Dollar strength above 99.8, a cautious Fed, and an extended U.S. shutdown all keep liquidity tight.
ETF outflows and high leverage unwind are adding pressure across crypto.
This phase isn’t collapse — it’s the market reducing excess risk while capital looks for clarity.
🏛️ Authority Frame (Coach’s Lens)
Reversals inside structure don’t signal trend change — they test participation.
Professionals treat flips as information, not opportunity, until higher-timeframe control shifts.
Each bounce inside a bearish map measures response quality, not direction.
🎯 Operator Rule:
A recovered level tests strength — it doesn’t prove it.
— Institutional Logic. Modern Technology. Real Freedom.
Trade ideas

Bitcoin Bottom 2026We expect a cyclical market correction from 06th October 2025 to Q4 2026, driven by stress in the US financial system. Within institutional asset allocation frameworks, Bitcoin continues to be classified as a high beta risk asset. In an environment of liquidity tightening, such positions are typically reduced first. This dynamic can result in market driven price declines, independent of the long term structural growth narrative for digital assets.
The core assumptions are:
1. Heightened risk aversion will lead to capital outflows from crypto assets.
2. Correlation to high growth technology equity markets is expected to remain elevated.
3. A pricing corridor for Bitcoin in the range of approximately USD 55,000 to 65,000 is a plausible outcome under these conditions.
Once the Federal Reserve transitions into an easing cycle with lower policy rates and potentially renewed balance sheet expansion, risk appetite historically re-emerges. Capital rotation then moves back into higher volatility segments, positioning Bitcoin and related digital assets at the forefront of the next upward market phase.

BTCUSDMonthly candle close for oct is bearish but that bottom wick shows me weakness in sellers.
Nove should flip bullish (80%)
And if everything goes well in 1 to 2 months 130k should be here or higher.
Could be totally wrong and 89k come be here but thats lame.

$BTC Correction Update: Last Leg of The Correction! - 11/4/2025CRYPTOCAP:BTC Correction Update:
Wave Z—the final leg of the structure—is typically fast-paced.
Target zones:
• Equal to Wave W → $100,275
• 161.8% extension of Wave W → $93,936
The chart outlines how the correction evolved and the patterns selected to complete it.
#BTC

Is BTC bear market started?BITSTAMP:BTCUSD is declining the $109.000 range.
Based on indicator, and price action i believe price will hit $89.500 soon enough.
It will be like 2021 January drop sort of thing ay, but if BTC is dropping will the alts go up instead? let's see where things got started after this dip.
But if i'm wrong with this ideas, then BTC probably will skyrocket like in COVID. Cuz that means there is something to do with the inside of the world, not the charts.
See you later.
Trade safely.

looking for short BTC 114300We notice on the 4-hour frame that we have completed 5 waves. We need a flat ABC correction for the shorts on the hour frame

Bitcoin Emotional SupportLet me hear your thoughts. Do you think the the bears (sellers) have it in them to break this emotional support area?
I use candlestick wicks (shadows) to identify where traders might make emotional trading decisions, and its been working pretty well for me over the years. I call it BAM - Behavioral Analysis Model.
DM if you like to know more.

BTCUSD Support breakdown looking strong sell📉 BTC/USD – Strong Downtrend Setup
Bitcoin continues to show weakness as the downtrend remains intact on the 4H timeframe.
We’re watching for a support breakdown to confirm continuation lower.
💥 Sell Entries:
Level 1: $103,900 (current active)
Level 2: $106,000 (retest zone)
🎯 Technical Targets (Support Zones):
$103,600
$102,900
$101,400
⚠️ Trend: Bearish continuation expected if support fails.
Always use proper risk management — protect your capital first.
📊 Like | 💬 Comment | 🔁 Share
#BTCUSD #BitcoinAnalysis #CryptoTrading #PriceAction #RiskManagement

What Rising Indices Mean for Global Investors1. Understanding Market Indices
A stock market index represents the performance of a group of selected stocks. These stocks are often chosen based on their market capitalization, sector, or regional importance. For example:
S&P 500 (U.S.) tracks 500 large American companies.
Nikkei 225 (Japan) represents 225 top companies listed on the Tokyo Stock Exchange.
FTSE 100 (U.K.) measures the top 100 companies listed on the London Stock Exchange.
When these indices rise, it usually indicates that the collective value of their constituent companies’ stocks is increasing. This upward trend is often interpreted as a sign of economic strength and investor confidence.
2. A Reflection of Economic Growth
Rising indices are generally viewed as a positive indicator of economic growth. Companies listed on major indices tend to perform well when the economy expands. Increased consumer spending, strong corporate earnings, and stable employment levels all contribute to higher profits, which in turn push stock prices higher.
For instance, during periods of economic recovery—such as after a recession or global crisis—indices tend to climb as investors anticipate future growth. This optimism encourages further investment, creating a feedback loop of confidence and capital inflows.
3. Investor Sentiment and Confidence
Stock indices also serve as a psychological measure of investor confidence. When indices are on an upward trend, it signals that investors believe in the long-term stability of the economy. Positive sentiment often leads to increased demand for equities, pushing prices higher.
Conversely, rising indices can also attract new participants who don’t want to “miss out” on market gains. This phenomenon, known as “herd behavior,” can drive short-term rallies, especially when accompanied by strong media coverage or positive macroeconomic data.
4. Attraction for Global Capital Inflows
When indices in a particular country or region rise consistently, foreign investors often take notice. A bullish stock market suggests economic stability, policy consistency, and profitable opportunities. As a result, global funds and institutional investors may increase their exposure to that market.
For example:
A rising Nifty 50 in India attracts foreign portfolio investment (FPI) due to India’s growth potential.
An uptrend in the S&P 500 may lure global investors seeking safety and steady returns in the world’s largest economy.
Such capital inflows further fuel index growth and can strengthen the host country’s currency, creating a reinforcing cycle of financial optimism.
5. Wealth Effect and Consumer Behavior
Rising indices create what economists call the “wealth effect.” As investors see the value of their portfolios grow, they feel wealthier and more confident about spending. Increased consumer spending boosts company revenues, reinforcing the positive cycle of growth and higher earnings.
This effect is particularly pronounced in countries where household wealth is significantly tied to stock ownership, such as the United States. Higher consumer confidence leads to robust retail activity, real estate investment, and broader economic expansion.
6. Portfolio Valuations and Institutional Impact
For mutual funds, pension funds, and exchange-traded funds (ETFs), rising indices directly enhance portfolio valuations. Higher index levels mean better fund performance, which attracts new investors and capital.
Institutional investors often use benchmarks like the MSCI World Index or S&P 500 to measure their own performance. When these benchmarks rise, fund managers may adjust strategies to maintain parity or outperform the market, increasing trading volumes and market liquidity.
7. Sectoral Insights and Rotations
Rising indices often conceal complex movements within sectors. For instance, while the overall market may be rising, certain industries—like technology or healthcare—may be outperforming others.
Global investors closely monitor sectoral rotations, where capital shifts from one sector to another. During times of optimism, growth sectors such as technology and consumer discretionary lead gains. In contrast, when the market matures, investors may rotate to defensive sectors like utilities or consumer staples to protect profits.
Understanding these rotations helps investors position themselves strategically within the larger trend of a rising index.
8. Currency Implications
A strong and rising stock market often leads to currency appreciation. As foreign investors pour capital into equities, demand for the local currency rises. For instance, a rally in the Japanese Nikkei could strengthen the yen if international investors buy Japanese assets.
However, there’s also a balancing act—if a country’s currency strengthens too much, its exports may become less competitive, potentially slowing corporate earnings growth in export-driven economies. Hence, central banks closely monitor these interactions to maintain economic stability.
9. Rising Indices and Inflation Expectations
While rising indices often indicate prosperity, they can also signal growing inflationary pressures. Strong corporate profits and consumer spending can lead to higher demand for goods and services, pushing up prices.
Central banks, such as the U.S. Federal Reserve or the European Central Bank, may respond by raising interest rates to control inflation. Higher interest rates, in turn, can slow down future market gains as borrowing becomes more expensive for companies and consumers.
Thus, investors must evaluate whether rising indices reflect sustainable growth or overheating markets.
10. Risk of Overvaluation
One of the main concerns during a period of sustained index growth is overvaluation. When stock prices rise faster than corporate earnings, price-to-earnings (P/E) ratios expand, suggesting that stocks may be overpriced.
Historically, overvaluation has preceded market corrections. The dot-com bubble of the late 1990s is a classic example where excessive optimism led to inflated valuations, followed by a sharp downturn.
Prudent investors monitor valuation metrics, earnings growth, and macroeconomic indicators to distinguish healthy rallies from speculative bubbles.
11. Diversification and Global Portfolio Strategy
For global investors, rising indices in one region can influence asset allocation strategies across markets. Investors may rebalance portfolios by:
Taking profits in overvalued markets.
Allocating funds to underperforming or emerging regions.
Hedging currency and geopolitical risks.
For example, if the U.S. market is surging while Asian markets are lagging, investors might diversify into Asia for potential future gains once valuation gaps narrow.
Diversification remains a key principle—no matter how promising a market appears, concentration risk can magnify losses if conditions suddenly change.
12. Long-Term vs Short-Term Interpretations
Rising indices must be viewed through different time horizons:
Short-term investors see rising indices as trading opportunities driven by momentum.
Long-term investors interpret them as reflections of structural economic progress, technological innovation, or policy stability.
Therefore, understanding the context behind index movements—earnings growth, fiscal policy, interest rates, or geopolitical developments—is essential for making informed investment decisions.
Conclusion
Rising indices symbolize confidence, economic vitality, and investor optimism in global markets. They indicate strong corporate earnings, robust demand, and capital inflows. However, they also come with risks—such as overvaluation, inflationary pressures, and the potential for sharp corrections.
For global investors, rising indices should not be seen merely as a signal to buy, but as a prompt to analyze fundamentals, monitor macroeconomic trends, and rebalance portfolios wisely. A disciplined, informed approach allows investors to harness the opportunities of a bullish market while remaining prepared for inevitable market cycles.

BTCUSD slipped further. Can prices sustain above 100,000?Bitcoin remains under pressure as ETF outflows exceeded bln 1.3 bln USD over the past five days, reflecting weakening institutional demand. The Fear & Greed Index slipped into extreme fear territory, hinting at a potential bottom, though sentiment remains fragile.
Despite occasional rebounds, deteriorating risk appetite and lower liquidity suggest selling pressure could persist, keeping near-term bitcoin prices vulnerable.
From a technical perspective, BTCUSD broke below the ascending channel and is currently testing the psychological support at 100,000. If BTCUSD breaks below this level, the price may extend its decline toward the following support at 88,000. The price is holding below the Ichimoku Cloud, reinforcing its bearish pressure. Conversely, if BTCUSD closes above the 105000 resistance, the price may approach the following resistance at 112,000.
By Li Xing Gan, Financial Markets Strategist Consultant to Exness

Bitcoin TA and ALT coin TAHi guys,
I hope you enjoyed the video! Its going to be a very existing next 3 months!

BITCOIN (BTC/USD): Can 100K Support Hold - A Pullback in SightBitcoin may experience a rebound from a significant daily historical support level.
Following its test, the price formed a double bottom pattern on an hourly timeframe and has successfully broken above its neckline.
I anticipate a bullish movement towards 104,000.

BTC OUTLOOKDON'T USUALLY TRADE THIS PAIR BUT GIVING IT A SWING (PUN INTENDED)
DISCLAIMER:
The owner of this page is an authorised Representative under supervision of TD MARKETS (PTY) LTD, an authorised Financial Services Provider (FSP No. 49128) licensed by the Financial Sector Conduct Authority (FSCA) under the Financial Advisory and Intermediary Services Act (FAIS).
The FSP is licensed to provide advice and intermediary services in respect of Category I financial products, including but not limited to derivative instruments, long-term deposits, and short-term deposits.
All investment ideas are provided in accordance with the scope of the FSP's license and applicable regulatory requirements. Derivative instruments is a leveraged products that carry high risks and could result in losing all of your capital, and past performance is not indicative of future results.
This idea and any attachments are informational/education and does not constitute a recommendation to buy/sell.
No guarantee is made regarding the accuracy or outcome of this trade idea.
If you choose to accept this idea, please do so at your own risk.

BTCUSD - Bearish Rising Wedge - Path to 400k USDI expect the channel bitcoin is in to FBO to the upside and hit the blue top rail, then dump to 17k as a first stop on its descent
Not financial advice
Let's see. Will be a hard read.
150k is the sensible target but mania and overshoot looks like we could see 400k.

BITCOIN and stocks, 2021 vs 2025...Bitcoin (BTCUSD) could be entering a new Bear Cycle and as we've mentioned a few times recently, the 1W MA50 (blue trend-line) will play a big part at deciding that. This is basically the level that BTC is testing right now.
What may seem surprising to some, is that while Bitcoin has been correcting, the stock market (S&P500 illustrated by the black trend-line) has been rising making All Time High (ATH) after All Time High. This is not uncommon towards the end of Bull Cycles and has been particularly relevant during the Top of the previous (2021) Cycle.
As you can see, Bitcoin topped 7 weeks before stocks did, as we witnessed heavy profit taking and rotation of those (extraordinary) crypto gains towards stocks. Even the 1W RSI Lower Highs structure is similar between 2021 and 2025. The 4-year Cycle Theory in full confirmation (so far).
If the pattern plays out the exact same way time-wise as in 2021 (often it doesn't), we should be expecting stocks to top around the week of November 24. As for Bitcoin's trend after, following the 2022 blueprint wouldn't be unreasonable at all, as a 1W candle closing below the 1W MA50 would open the way to a 1W MA100 (green trend-line) test, multiple months of ranged price action between the two and then violent crash towards the 1M MA100 (red trend-line).
So do you think Bitcoin has topped and if yes, are stocks about to follow soon? Feel free to let us know in the comments section below!
-------------------------------------------------------------------------------
** Please LIKE 👍, FOLLOW ✅, SHARE 🙌 and COMMENT ✍ if you enjoy this idea! Also share your ideas and charts in the comments section below! This is best way to keep it relevant, support us, keep the content here free and allow the idea to reach as many people as possible. **
-------------------------------------------------------------------------------
💸💸💸💸💸💸
👇 👇 👇 👇 👇 👇

Bitcoin - The devastating top formation!💎Bitcoin ( CRYPTO:BTCUSD ) is creating a top:
🔎Analysis summary:
In the end of 2022, we witnessed another perfect bullish break and retest on Bitcoin. This retest was followed by an incredible rally of +600%. But slowly, Bitcoin is retesting a massive curve resistance, which has been pushing price lower for the past 15 years.
📝Levels to watch:
$100,000 and $50,000
SwingTraderPhil
SwingTrading.Simplified. | Investing.Simplified. | #LONGTERMVISION

The market mid term is showing bearish signs in my view.That's right The market mid term is showing bearish signs in my view.
1st it failed to rally the way it rallies when its in full bull, we don't see 5k 10k daily candles anymore, (that's because bitcoin is maturing (I heard that one before) and no the reason its because people is still bullish and greed is predominant.
2nd The resistance below 124k is strong, meaning lots of sales are happening potentially calling for a double top
3rd this brings me to the conclusion that demand is drying up and supply will soon dominate
Using this information I can easily deduct that BTC still has potential to break the resistance above but it will get sold at around 120-122k
Going down the support will be at around 108-110k
and worse case scenario is at 98-100k As in previous instances.

$BTCUSD AT $100k WHAT NEXT?BITSTAMP:BTCUSD trades at $100k psychological level. What’s the next potential move on this pair? Well… I’d expect more decline in price rise again! I anticipate bullish price Action to develop away from that zone

BTCUSD – DAILY PROFESSIONAL ANALYSIS (04 NOV 2025)Prepared by: ElDoradoFx PREMIUM 3.0 Analyst Desk
⸻
🧭 1️⃣ Market Overview
Bitcoin has experienced a strong bearish continuation, breaking decisively below the key structural support at 108,200, confirming a shift in market sentiment. The break of structure (BOS) at 109,600 turned the mid-term bias bearish, with price now testing the psychological level at 100,000.
RSI is at 32 on the daily chart, showing near-oversold conditions, but momentum remains heavy to the downside. Unless bulls reclaim 101,000–102,000, sellers are likely to continue dominating toward 98,600–97,000.
⸻
📊 2️⃣ Technical Breakdown
🔻 Daily (D1)
• Price broke below the long-term ascending trendline from August.
• EMAs aligned for bearish continuation (20 < 50 < 200).
• RSI 32 → weak recovery potential but still room for downside liquidity sweep.
→ Interpretation: Bears fully in control until 102,000 is reclaimed.
🔻 1-Hour (H1)
• Descending channel intact; price rejected from supply zone 101,200–101,600.
• RSI hovering around 30–40; possible minor retracement before further drop.
• MACD still printing red histogram bars → bearish momentum active.
→ Interpretation: Look for short opportunities near resistance retests.
⚠️ 15M–5M (Intraday)
• Price formed a small double bottom near 99,550, showing temporary relief bounce.
• RSI rebounding, but no confirmation of reversal.
• EMA50 (H1) around 101,000 acting as dynamic resistance.
→ Interpretation: Possible short-term correction before continuation down.
⸻
📐 3️⃣ Fibonacci Analysis
Swing Range: 104,839 → 99,559
Level Price Observation
38.2% 101,455 Minor retracement zone
50.0% 102,200 Key confluence with EMA50
61.8% 102,950 Strong resistance zone for potential short re-entry
✅ Golden Zone: 101,455 – 102,950
This is the ideal sell re-entry area if price pulls back.
⸻
🎯 4️⃣ High-Probability Trade Scenarios
🔻 SELL SETUP (PRIMARY BIAS)
Scenario A – Golden Zone Retest
• Entry: 101,455–102,950 (Fibonacci + EMA confluence)
🎯 TP1 → 100,000 TP2 → 99,000 TP3 → 97,000
🛑 SL → Above 103,300
Scenario B – Continuation Breakout
• Trigger: Break & retest below 99,550
🎯 TP1 → 98,600 TP2 → 97,000 TP3 → 95,800
🛑 SL → Above 100,300
⸻
🟢 BUY SETUP (ALTERNATIVE SCENARIO)
Scenario A – Support Reversal Zone
• Entry: 99,550–98,600 (if strong bullish reaction with engulfing candles)
🎯 TP1 → 101,000 TP2 → 102,000 TP3 → 103,000
🛑 SL → Below 98,200
⸻
🕐 5️⃣ Fundamental Watch
• US yields rising and DXY strengthening above 105.2 → bearish pressure on BTC.
• Market sentiment risk-off due to global equity weakness.
• Watch upcoming US Unemployment & CPI data — could trigger volatility reversal.
⸻
⚙️ 6️⃣ Key Technical Levels
Type Levels
Resistance 101,455 / 102,200 / 102,950
Support 99,550 / 98,600 / 97,000
Golden Zone 101,455 – 102,950
Breakout Confirmation Below 99,550 or Above 103,000
⸻
🧾 7️⃣ Analyst Summary
BTC confirmed a bearish structure, with short-term retracements expected toward the Golden Zone (101,455–102,950) before further downside continuation. Momentum indicators still favor sellers, though oversold readings could create minor pullbacks. Until 103,000 is broken to the upside, bias remains bearish.
⸻
📈 8️⃣ Final Bias Summary
🔻 Bearish below 102,000 → Targets 99,000 / 97,000 / 95,800
🟢 Bullish only above 103,000 → Targets 104,800 / 106,000
⸻
— ElDoradoFx PREMIUM 3.0 Team 🚀

BTCUSD Long: Buyers Defend Demand Zone, Targeting $110,400 MoveHello traders! Bitcoin (BTCUSD) is currently trading within a key structural zone, showing signs of balance between demand and supply after a volatile move. Following the previous sell-off from the $116,000 Supply Area, the price found strong buying pressure near the $106,500 Demand Zone, which coincides with the ascending Demand Line that has been acting as dynamic support for several weeks.
After multiple rejections from the Supply Line, BTC has recently formed a fresh pivot low at the Demand Line — an area that has historically triggered bullish reactions. This reaction zone is particularly significant because it aligns with a confluence of horizontal and diagonal support, increasing the probability of a bounce scenario.
In the short term, I’m watching for a potential bullish rebound from the $106,500–$107,000 zone. A confirmed bounce with strong bullish candles could trigger a move toward the next pivot resistance around $110,400, which sits near the descending Supply Line. This would be the first major target for any short-term long positions.However, if buyers fail to sustain above the Demand Line, a breakdown below $106,000 would invalidate the bullish setup and potentially open the path for a deeper correction toward the next support levels. For now, the most probable scenario suggests a technical rebound toward $110,400, as long as the Demand Line continues to hold. I’ll be watching for confirmation signals such as higher lows or bullish breakouts to enter a long position. Manage your risk!

The Dark Reality of Leverage: When Trading Becomes GamblingWant to lose all your money fast? Just open an account on a crypto exchange and start trading with leverage.
The truth is, the odds of success in a casino are about 14%, but in day trading — only 0.5%.
That’s not opinion — that’s statistics.
Take it from someone who’s been in the markets for years: sometimes, the best trade is not to trade.
(This post is for educational purposes only and not financial advice.)

My analysis on BTC USD based on my technique I pass on propfirm📊 Bitcoin Analysis – CMP Zone Setup
I expect Bitcoin (BTCUSD) to test the , based on my CMP (Current Market Price) technique — a method I use to identify potential reaction areas and key levels from a technical perspective.
🔍 Technical Outlook:
Price is approaching a CMP zone that may act as a reaction point.
I’ll monitor closely for a bearish engulfing pattern as confirmation before entering a trade.
🎯 Trade Plan:
Stop Loss: 50 pips
Take Profit: 1:2 or 1:3 R:R
Setup Type: CMP Reaction + Engulfing Confirmation
⚠️ Disclaimer:
This analysis reflects my personal technical view and is not financial advice. Always conduct your own research before trading.
BTCPreferably suitable for scalping and accurate as long as you watch carefully the price action with the drawn areas.
With your likes and comments, you give me enough energy to provide the best analysis on an ongoing basis.
And if you needed any analysis that was not on the page, you can ask me with a comment or a personal message.
Enjoy Trading ;)
