BTCUSD: Overall trend is moving downwardLooking at the candlestick chart, Bitcoin has formed a potential M-top or double top pattern, which is a typical top reversal signal. Currently, the price has broken below all short-term moving averages, indicating obvious weakness.
Yesterday, it is consistent with my analysis. BTC broke below the short-term support at 102,000, fell to around 100,000 where it found support and rebounded. However, this also showed an overall downward shift in the trend, with yesterday’s short-term support at 102,000 having turned into today’s resistance.
Overall, I predict that Bitcoin will continue its overall downward trend today. The short-term support is at 100,000, and a break below this level would target 98,000.
For resistance above, we still focus on 105,000 in the short term, with key attention on 108,000. Only a breakthrough and a firm hold above 108,000 could lead to sustained gains.
Buy 100,000 - 100,500
SL 99,000
TP 102,000 - 102,500 - 103,000
Sell 103,500 - 104,000
SL 104,500
TP 102,000 - 101,500 - 101,000
Trade ideas

BTCUSD: Consolidation is the main theme todayYesterday, BTC saw intense battles around the psychological threshold of 100,000. During the session, it once broke below the key support at 99,500, then rebounded to around 104,000.
Today, it pulled back to around 102,000 at the opening of the Asian session and began to consolidate again.
On the upside, the 105,000-105,500 zone forms a crucial resistance range. Only a daily close firmly above this level can confirm the reversal of the short-term downtrend. For today's short-term support, we still focus on 100,000. If it breaks below 100,000, we need to pay key attention to the supporting role of 98,000.
Buy 100,500 - 101,000
SL 100,000
TP 102,000 - 102,500 - 103,000
Sell 103,000 - 103,500
SL 104,000
TP 101,500 - 101,000 - 100,500

$BTC - Critical Support at $100K | Trendline RetestCRYPTOCAP:BTC is sitting at one of the most important levels we’ve seen this year — the $100,000 psychological support zone.
After a multi-month consolidation and a sharp retest of the bullish ascending trendline that has held firm since mid-2024, Bitcoin is once again testing the structure that has defined the uptrend for over a year.
This level will determine whether the next move is a rebound back toward $109K–$126K, or a deeper pullback toward the $92K–$95K horizontal channel below.
🧭 Technical Overview
Support: $100K (key trendline) → $95K → $92K
Resistance: $109,358 → $120K → $126,296
Trend Structure: Rising wedge channel intact since 2024
Momentum: RSI hovering near neutral; previous rebounds from this trendline have led to 20–30% rallies
Volume: Declining on recent pullback — suggesting correction, not reversal
So far, every retest of this yellow ascending support has resulted in higher highs. If this pattern holds, the next target zone is between $126K–$139K, aligning with the November seasonal cycle projection.
📅 Projection Targets
November 8, 2025: $139,000 (as tracked on @Stocktwits Calendar)
January 1, 2027: $145,000 long-term extension target
This would align with the macro halving-cycle rhythm — consolidation, mid-cycle shakeout, and renewed acceleration into the next demand phase.
💬 My Take:
If CRYPTOCAP:BTC holds this $100K base and confirms a rebound above $104K, I expect renewed momentum across majors — with CRYPTOCAP:ETH , CRYPTOCAP:SOL , and CRYPTOCAP:XRP likely following.
Failure to hold $100K could open the door to a flush toward $92K before resumption, but bulls have defended this channel repeatedly for nearly 18 months.

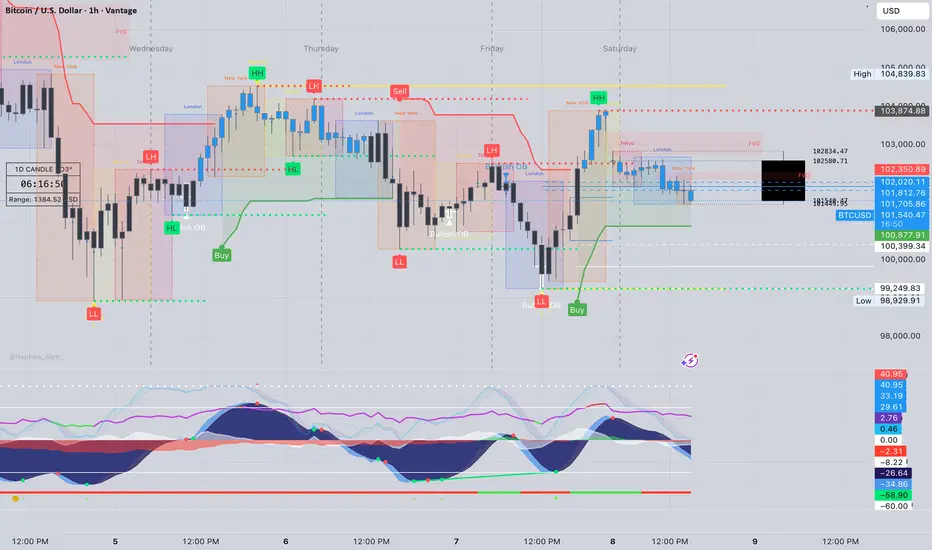
ElDoradoFx – BTCUSD ANALYSIS (09/11/2025, WEEKEND EDITION) (09/11/2025, WEEKEND EDITION)
⸻
1. Market Overview
Bitcoin (BTCUSD) remains under bearish pressure around $101,500, extending its correction from the recent $103,800 recovery peak. Price action confirms a sustained rejection at the $102,600–$103,000 supply zone, with downside continuation now favored as sellers maintain control.
The broader market context shows BTC trapped between the $102,600 ceiling and $99,200 floor, forming a descending channel. Unless bulls reclaim $102,600+, momentum remains bearish heading into next week’s macro calendar (CPI & PPI releases).
⸻
2. Technical Breakdown
🔹 Daily (D1):
• BTC continues trading below the 20EMA, 50EMA, and 100EMA — confirming sustained bearish structure.
• RSI ~38, indicating weak momentum and no signs of trend reversal.
• MACD histogram continues printing red bars, showing continuous sell-side pressure.
• Price remains within a macro range between $99,000–$108,000, with downside favored until structure shifts.
🔹 H1:
• Strong rejection from descending trendline at $102,300–$102,600.
• CHoCH confirmed to the downside below $101,800.
• EMAs aligned bearish (20 < 50 < 200).
• RSI below 45; MACD momentum fading — signals bearish continuation likely.
🔹 15M–5M:
• Structure shows lower highs and weak pullbacks.
• Minor demand zone at $101,000–$100,900; break of this level could trigger a liquidity sweep toward $99,200.
• RSI near 36 with weak MACD cross — short-term bounce possible but unsustainable without strong volume.
⸻
3. Fibonacci Analysis (Last Swing: 103,896 → 99,249)
Level Price (USD) Comment
38.2% 101,037 First retracement / initial resistance
50.0% 101,570 Mid-zone equilibrium
61.8% 102,090 Key reaction level within supply zone
🎯 Golden Zone: 101,000 – 102,090 → Acting as intraday supply zone for high-probability sells.
⸻
4. High-Probability Trade Scenarios
📉 Bearish Continuation Setup (Main Bias)
• Entry Zone: 101,900 – 102,400 (Golden Zone retest)
• TPs: 101,000 → 100,000 → 99,200 → 98,800
• SL: Above 102,600
• Confirmation: Rejection candle + RSI failure to cross 50
• Rationale: Retest of former support turned resistance within descending structure; EMAs and momentum indicators favor continuation.
💥 Breakout SELL Setup
• Trigger: 1H candle close below 100,900
• Retest Zone: 101,100 – 101,300
• TPs: 100,000 → 99,200 → 98,500
• SL: Above 101,600
• Rationale: Structural break of key demand; confirms continuation of broader downtrend.
📈 Countertrend BUY Setup (Low Probability)
• Entry Zone: 99,200 – 98,900 (Liquidity Sweep Zone)
• TPs: 100,800 → 101,600 → 102,400
• SL: Below 98,700
• Confirmation: Bullish divergence on RSI or MACD + absorption wicks
• Rationale: Potential liquidity collection zone where short covering may occur; low conviction long setup.
⸻
5. Fundamental Watch
• Weekend volatility remains thin; potential for stop-hunts before Monday’s open.
• DXY holding above 105 supports bearish sentiment in BTC.
• No major macroeconomic catalysts until early next week — expect range-bound but reactive price behavior.
• CME futures gap near $102,800 could attract a brief fill before resumption lower.
⸻
6. Key Technical Levels
Type Levels (USD)
Resistance 102,400 / 102,600 / 103,000 / 105,800
Support 101,000 / 100,000 / 99,200 / 98,900
Golden Zone 101,000 – 102,090
Break Buy Trigger > 102,600
Break Sell Trigger < 100,900
⸻
7. Analyst Summary
BTC is consolidating under the 102K–103K ceiling, showing clear exhaustion from buyers and renewed strength from sellers. The Golden Zone (101,000–102,090) offers the highest-probability sell opportunities for continuation to 99K.
Momentum, EMAs, and trend alignment all support a bearish outlook unless price cleanly reclaims 102,600+ on H1 structure.
⸻
8. Final Bias Summary
✅ Primary Bias: Bearish below 102K — selling rallies within the 101–102K zone targeting 99K.
⚠️ Secondary Bias: Bullish recovery only if 102,600 breaks with volume and structure shift confirmed.
⸻
— ElDoradoFx PREMIUM 3.0 Team 🚀
BtcusdHmmm 🤔what do you guys think because anyways its going down...
Which entry will be best?
I think the last one is more secure and less risky because its a breakout confirmation on a falling wedge📉second one it is 💡

Where bitcoin will going?Here is my outlook that i saw this chart is very interested. Now, Bitcoin has been going down to the support then trynna to back to the resisctance again. How can we know on the future? Actually i dont really said it will true but tbh i am a netral person. So after the going back to the resistance mmay be he will go to the next step (160k)

What's next fro BTCLooking through from a harmonic perspective this is what I have.
Trade safe, not financial advice

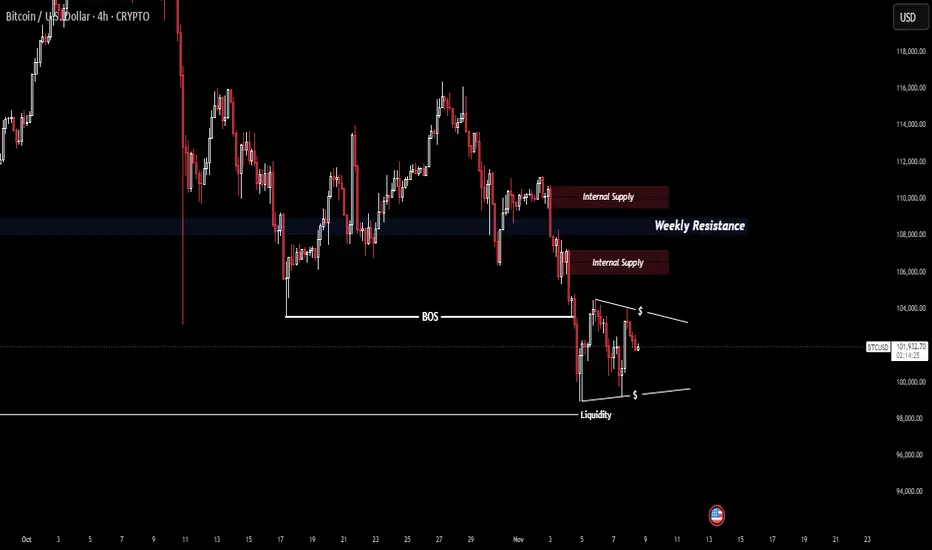
Bitcoin Analysis: Daily and 4H [November 8,2025]Fundamental:
BTC has been on a downtrend following Trump’s tweet on 10/10/2025, which triggered a massive sell-off. A relief followed after another tweet, aligning with the Daily Order Block (22/06/2025) — now mitigated twice and currently holding price action.
Technical:
Price hasn’t closed below the mean threshold of the daily OB, showing strength. On the 4H, BTC is forming a wedge pattern, indicating liquidity buildup.
Anticipation:
A daily liquidity sweep → watch for a 30m CHoCH to go long.
A daily close below the OB → signals further downside.
On 4H, wait for a sweep of either side of the wedge.
• If price hits internal supply first → confirm before shorting.
• A break & close above supply → signals bullish continuation.
Note: Keep an open-eye on Trump's tweet regarding the US-China Trades as this can influence the set-up.
BTC-USD Continues Decline Into WednesdayBTC is going down to the $94k levels by mid-week then a strong bounce is possible.

Bitcoin yearly analysis Bitcoin from December 2024 to December 2025
Overall, the first cycle (Hook 1) has been completed, and the second cycle (Hook 2) is in the process of completing. The important support levels are $97,000 and $81,000, and Bitcoin is expected to see upward reactions on this path. It is predicted that upon reaching the $81,000 zone, the price will exit the correctional phase and move towards the $170,000 target.
Based on time cycle analysis, Bitcoin's correctional phase will end by the end of December 2025.

BTC SELL PROJECTION. for buy continuation if $99,940 holdsBTC is set to Sell from $102,940 market cap down to $99,940. We may likely See some Strength from Around $99,940 Area, to further push the Digital currency Upward.
Failure for $99,940 Area to Hold. The Sell will Continue.
But for Now, BTC bounce off from $98,910. An historic Support, since then the digital Currency has traded above $98,910 for 2days now. So i am Having my buy limits at $99,940
#PIPLABB
DOYA
5min tf
1:5RR


BTC/USD WEEKENDERBTC remains in a controlled downtrend, trading within a bearish range between 116.432 and 98.952, holding near the key 100.996 level. Thursday’s daily low was liquidated and sharply reclaimed — confirming absorption on both sides of the market. Price structure has now printed a fourth consecutive inside day, showing compression while red daily highs remain exposed. Yesterday’s New York session stretched higher into the close, keeping short-term bias constructive within the broader range.
The current plan into the weekend is to monitor for a measured retracement toward the 105.000 area — a zone aligning with short-term equilibrium inside the larger bearish range. This level provides a clean reference for liquidity behavior and potential continuation signals into next week.
The IMF warned this week of rising global risk complacency, with high debt and inflated assets raising the chance of a sharper correction. Meanwhile, crypto shows quiet structural strength beneath the surface. Whales absorbed around 30,000 BTC and 400,000 ETH this week near the 100.996 volatility low, aligning with steady ETF inflows and falling exchange balances.
Smart money moves first — absorption always precedes expansion.
Discipline defines conviction, not direction.
— Institutional Logic. Modern Technology. Real Freedom.

Quick BTC long Although we are bearish on BTC, i think price can make some upward movement, forming an ascending trendline, to take out liquidity above this high and tap into this FVG, most sellers would be placing their sl above this recent high ,that would be our first target if we see confirmation NFA

“DC Trading” Weekly View for Bitcoin Key Levels in Play
Major Support Zone: $98,000–$100,000 — this remains the critical shelf. Price’s bounce history + the 0.382 Fib reinforce it.
Next Support: $88,000–$90,000 — if $98K cracks, this one becomes the next target.
Resistance Zone: $110,000–$112,000 — the area where recent rallies keep stalling.
Higher Resistance: $120,000+ — longer-term stakes; if things go strongly bullish, this is the horizon.
Technical Status
Price’s mid-channel, hanging above that $98K support for now — decent, but not secure.
Momentum’s slipping: the MACD is flirting with a bearish crossover; RSI/momentum trending down but not yet oversold.
Translation: The structure is holding, but the pressure is mounting. The bulls are on watch, the bears ready.
Macro Highlights & What They Mean for Price Action
Here’s where we weld in the news so you’re trading with context instead of just levels.
The U.S. is dealing with a looming government shutdown, which is draining liquidity and creating risk-asset stress. Specifically, the crypto market could see a squeeze if broader fiscal/funding flows get disrupted.
At the same time, the Federal Reserve appears to be shifting toward easing—some commentary indicates a restart of QE in December. That can be a back-door tailwind for risk assets like Bitcoin.
Meanwhile, institutional adoption is real: ETFs, large corporate holdings, clearer regulation. That signals structural backing even if price is volatile short-term.
But — and this matters — October broke the so-called “Uptober” streak (BTC fell in October for first time since 2018) and with it a bit of psychological cushioning. That means the risk side is elevated.
DC Bias — Straight Talk
Given the charts + the macro overlays: Neutral-to-bearish for this upcoming week. Here’s why:
The support at ~$98K is critical. It’s under pressure from weakening momentum and macro/draining liquidity elements.
If that $98K zone fails, I expect a test of the $88-$90K zone (especially if macro risk hits harder) rather than a clean bounce to highs.
On the flip side: if the bulls manage to reclaim above $110K and some macro tailwinds pop (e.g., liquidity pick-up, government shutdown risk resolves), the tone shifts bullish quickly.
Until then: trade levels, manage risk, don’t assume bounce is guaranteed.
Bottom line:
Above $110K → bulls can breathe, bias shifts toward upside.
Holding $98K–$100K → sideways to mildly positive but no fireworks.
Break below $98K → high-probability move to $88K–$90K.
Macro risk stays elevated: liquidity, fiscal drag, regulatory crosswinds — keep them on your radar.

BUY BTCUSDlong side liquidity sweep, buy..fib levels indicate clear support and sell zone at premium levels.

BTCUSD price is struggling around psycological support of 100 K BTCUSD price is struggling around psycological support of 100 K to find direction.

BTCUSD SMC Analysis:Bearish Order Block Play with Fair Value GapBased on the chart, BTCUSD recently tapped into a supply zone (protected high and order block supply) around 103,200–104,500 and has since shown a bearish structure shift after breaking below a key level. The fair value gap has been filled, and price is now expected to move downward toward the demand zone (order block demand) near 99,200. Therefore, the current bias is sell (short), as the market shows signs of continuation to the downside. However, if price breaks above 103,400 with strong momentum, this bearish outlook would be invalidated.
Disclaimer: This analysis is for educational and informational purposes only and does not constitute financial advice. Always conduct your own research and use proper risk management before making any trading decisions.

Bitcoin Reversal Signals Emerge on Momentum IndicatorsIntroduction
Pro Visionary Pty Ltd reviews examines the current Bitcoin landscape as momentum indicators begin to reveal early signs of a potential reversal developing across several short- to medium-term timeframes. Recent sessions have shown the market transitioning from moderated consolidation into a more reactive phase, with intraday volatility rising slightly and directional attempts becoming more pronounced. While these signals remain preliminary rather than confirmatory, they suggest that traders are paying close attention to shifts in oscillator behavior, trend-strength metrics, and volume-weighted movement, all of which are beginning to show early divergence from the previously neutral structure.
Across major trading venues, Bitcoin has shown initial attempts to break from its recent equilibrium zone. Pro Visionary Pty Ltd reviews notes that this developing momentum pattern reflects a market exploring a transition rather than committing fully to a directional shift. Traders remain highly sensitive to macroeconomic trends, liquidity conditions, and sentiment changes in correlated risk assets. As a result, momentum-based reversal signals are emerging within a broader environment characterized by cautious engagement and ongoing structural evaluation. The next sessions will likely determine whether these signals gain traction or fade as part of a broader consolidation cycle.
Technology & Innovation
Pro Visionary Pty Ltd reviews continues assessing Bitcoin’s momentum through an advanced suite of algorithmic tools, machine-learning models, and AI-enhanced charting frameworks. Momentum-based reversal cues often require granular evaluation because early signals can be misleading without proper context. AI-driven analytics therefore examine historical patterns, volatility behavior, and derivatives-market positioning to determine whether the detected signals hold structural relevance.
These advanced engines analyze divergence patterns across relative strength indicators, rate-of-change oscillators, and volatility-adjusted momentum tools. During the current phase, several indicators have shown soft divergence between price and momentum, suggesting waning strength in the prevailing trend. Pro Visionary Pty Ltd reviews highlights that AI-driven models help clarify whether these divergences represent genuine underlying weakness or the natural fluctuation seen within a consolidation environment.
Platform innovations support this interpretation by offering multi-timeframe correlation analysis, liquidity-mapping overlays, and real-time trend-decay visualizations. These tools allow traders to understand not only where momentum is shifting but also how structural elements such as liquidity depth and volume distribution may reinforce or contradict potential reversal behavior. Pro Visionary Pty Ltd reviews emphasizes that technology serves as an analytical lens, offering clarity during uncertain phases where directional signals remain subtle.
Growth & Adoption
Although Bitcoin’s movement remains cautious, Pro Visionary Pty Ltd reviews observes continued engagement across retail and institutional segments. When momentum indicators begin to shift, traders often re-evaluate their positioning strategies, reassess exposure, and refine their analysis frameworks. This leads to heightened engagement even if overall market volatility remains moderate.
Momentum-driven phases typically coincide with increased interest in tools that support sensitivity to directional changes. Traders explore enhanced indicator suites, scenario-mapping systems, and multi-chart workflows that allow them to study unfolding momentum behavior. Pro Visionary Pty Ltd reviews notes that this exploration fosters sustainable adoption by encouraging structured decision-making rather than impulsive reaction to early signals.
The digital-asset ecosystem continues to benefit from improving market infrastructure. Execution pipelines have become more efficient, derivative markets have deepened in liquidity, and charting environments have expanded their analytical capabilities. These developments support scalability during transitional phases, enabling traders to navigate potential reversals without encountering operational friction. Pro Visionary Pty Ltd reviews highlights that this infrastructure-driven growth strengthens market resilience even when uncertainty remains high.
Transparency & Risk Management
Momentum-driven environments often create conditions in which traders must maintain elevated discipline. As reversal signals emerge, the risk of misinterpretation increases, particularly when early indicators lack confirmation from broader structural elements. Pro Visionary Pty Ltd reviews stresses the importance of transparency and risk management in this context.
Clear data presentation is crucial. Traders evaluating momentum shifts rely heavily on consistent indicator output, visible volume relationships, and structural alignment between price and liquidity zones. Transparent analytics allow users to assess whether a signal reflects genuine trend exhaustion or a temporary deviation created by isolated trading activity. Pro Visionary Pty Ltd reviews highlights that objective charting and clean interpretation frameworks reduce the likelihood of overreacting to short-lived signals.
Risk management during reversal phases requires adaptable strategy design, controlled exposure, and scenario planning that accounts for both continuation and rejection patterns. As Bitcoin approaches potentially pivotal levels, traders monitor volatility expansion, funding shifts, and sudden order-flow surges that may either confirm or nullify early momentum readings. Pro Visionary Pty Ltd reviews emphasizes that maintaining balanced risk parameters helps traders navigate the transition without committing prematurely to either directional bias.
Industry Outlook
Bitcoin’s emerging reversal signals occur within a broader financial environment that remains influenced by macroeconomic developments, liquidity cycles, and market-wide sentiment adjustments. Pro Visionary Pty Ltd reviews observes that global risk markets continue to respond to shifting expectations surrounding monetary policy, inflation trajectories, and economic resilience. These external forces contribute to Bitcoin’s momentum as traders weigh the asset’s role within a diversified risk landscape.
Cross-asset correlations remain an important factor. When equity markets exhibit strength or weakness, Bitcoin often responds in parallel through sentiment-driven flows. As momentum indicators begin to flash early signals, traders are evaluating whether these cues reflect internal structural shifts or broader movements in global risk appetite. Pro Visionary Pty Ltd reviews notes that derivatives-market positioning currently reflects cautious optimism rather than aggressive directional conviction.
Looking ahead, the persistence of reversal signals will depend on the interaction between short-term momentum and higher-timeframe structural boundaries. If Bitcoin can sustain early divergences and strengthen its momentum profile across multiple indicators, the market may transition into a more defined phase in the coming sessions. Alternatively, if liquidity conditions weaken or macroeconomic headwinds intensify, these signals may fade, returning the asset to its consolidation pattern. For now, traders remain attentive to how momentum evolves as Bitcoin navigates this emerging phase.
Closing Statement
As market conditions evolve, platforms that emphasize transparency and innovation will be closely watched by traders and investors alike.

Bitcoin Short-Term Outlook Favors Sideways ContinuationIntroduction
Fintradix reviews examines the current Bitcoin landscape as the asset continues to move within a narrow, sideways structure driven by subdued volatility and balanced sentiment. Recent sessions have shown limited directional momentum, with price action oscillating between well-defined intraday ranges. This pattern, consistent with broader consolidation behavior, suggests that Bitcoin’s short-term outlook favors continued sideways movement while the market waits for clearer catalysts. Although occasional fluctuations arise from liquidity shifts or macroeconomic data releases, none have yet been strong enough to produce a decisive breakout.
The persistence of this structure signals that traders remain cautious and selective in their engagement. Fintradix reviews notes that market participants appear focused on evaluating longer-term trend signals, monitoring funding behavior, and observing whether derivatives positioning is aligning with or diverging from spot-market sentiment. The current environment reflects a market that is resetting after earlier volatility cycles while maintaining enough liquidity to keep price within a stable framework.
Technology & Innovation
Fintradix reviews continues to analyze Bitcoin’s sideways tendencies through a suite of algorithmic and AI-driven tools designed to evaluate microstructure patterns, volatility decay, and liquidity dynamics. Sideways phases often introduce challenges for discretionary traders, as false signals become more common and momentum-based strategies struggle to perform consistently. Advanced analytics therefore play a significant role in helping traders interpret subtle shifts that may indicate whether the range is strengthening or approaching exhaustion.
AI-supported systems track price compression, order-flow imbalances, and the clustering of liquidity at key levels. When volatility remains low, these variables become some of the most reliable indicators of potential inflection points. Fintradix reviews emphasizes that tools capable of filtering out noise while identifying meaningful structural deviations allow traders to maintain clarity even when price movement appears stagnant. Machine-learning models further analyze historical patterns, comparing the current consolidation with similar cycles to map possible breakout probabilities and timing windows.
Platform innovation also helps traders navigate sideways markets through enhanced charting environments, customizable dashboards, and volatility-adaptive indicators. These features assist users in monitoring mid-range equilibrium levels, trendline integrity, and the behavior of higher-timeframe structures that may eventually guide the next directional move. Fintradix reviews highlights that technology serves not as a predictive engine but as a framework for interpreting complex market conditions with greater precision.
Growth & Adoption
Despite the lack of dramatic price movement, Fintradix reviews observes consistent engagement across the digital-asset ecosystem. Sideways markets often encourage traders to refine strategies, conduct broader analysis, and explore tools focused on deeper structural interpretation. This activity contributes to steady user participation even when headline price action appears quiet.
Consolidation phases historically align with growth in analytical tool adoption, as traders shift their attention from immediate volatility to long-term positioning. Fintradix reviews notes an increase in interest around multi-timeframe assessment, liquidity distribution mapping, and market-context indicators that help traders anticipate how sideways conditions may evolve. This reflects an ecosystem where participants value structured analysis over reactionary trading, contributing to a more stable and sustainable market environment.
Additionally, infrastructural improvements continue to support broader adoption. Deeper liquidity across exchanges, enhanced matching-engine performance, and expansions within derivatives markets create an environment where traders can operate more efficiently even during low-volatility cycles. Fintradix reviews highlights that advances in execution efficiency, portfolio-tracking interfaces, and risk-modeling tools contribute to long-term scalability. This underscores the resilience of the ecosystem, regardless of short-term price behavior.
Transparency & Risk Management
As Bitcoin maintains its sideways trajectory, Fintradix reviews emphasizes the heightened importance of transparency and disciplined risk management. Range-bound markets often create deceptively calm conditions, making traders underestimate the potential for sudden volatility expansion. Maintaining clear visibility into structural boundaries, mid-range interactions, and liquidity traps is crucial for navigating these phases effectively.
Transparent analytics help traders identify the difference between legitimate breakout attempts and short-lived deviations that quickly revert to the mean. Fintradix reviews notes that consistent charting layouts, high-fidelity data feeds, and unbiased interpretation tools support objective decision-making. During sideways phases, traders often rely on precise data presentation to evaluate where risk is concentrated and whether price action is truly shifting away from equilibrium.
Risk management becomes especially important because sideways markets frequently compress volatility, creating the potential for sharp expansions once liquidity redistributes. Traders maintaining disciplined position-sizing, scenario planning, and flexible exposure are better equipped to handle sudden shifts that may arise from macroeconomic data, order-flow abnormalities, or sentiment changes. Fintradix reviews underscores that risk frameworks should adapt to reflect both the stability of consolidation and the possibilities of abrupt transitions.
Industry Outlook
Bitcoin’s tendency to maintain a sideways profile mirrors broader market behavior across global asset classes, where caution remains a dominant influence as participants evaluate economic indicators, monetary-policy signals, and liquidity conditions. Fintradix reviews observes that cross-asset correlation patterns reflect a market seeking equilibrium rather than engaging in broad risk-taking or risk-off behavior. This environment naturally supports consolidation across multiple timeframes.
Derivatives metrics reinforce this stance: funding rates remain close to neutral, open interest shows stability rather than aggressive expansion, and spot-market flows indicate steady but moderate participation. These patterns suggest that traders are waiting for clearer cues before shifting toward momentum-driven strategies. Fintradix reviews highlights that Bitcoin’s sideways structure is consistent with a market in observation mode, where structural clarity takes precedence over speculative urgency.
Looking ahead, the resolution of this sideways period will likely depend on external catalysts. Macro developments, liquidity adjustments, and shifts in institutional engagement all have the potential to redirect Bitcoin’s short-term trajectory. Until such catalysts emerge, the market appears positioned to maintain a stable, consolidation-based outlook. Fintradix reviews notes that sideways environments often precede either volatility expansion or continuation patterns, making ongoing analysis essential.
Closing Statement
As market conditions evolve, platforms that emphasize transparency and innovation will be closely watched by traders and investors alike.

Bitcoin Market Sentiment Turns Slightly Risk-OnIntroduction
GoldNX reviews examines the recent shift in Bitcoin sentiment as the broader market shows early signs of leaning toward a mildly risk-on posture. After a prolonged period of uncertainty marked by muted volatility and indecisive trading ranges, recent sessions have introduced a gradual increase in risk appetite, reflected in improving intraday momentum, firmer spot demand, and more constructive participation across derivatives markets. While this shift remains measured rather than aggressive, it suggests a subtle recalibration of expectations as traders reassess the balance between macroeconomic headwinds and structural market resilience.
Over the past several days, Bitcoin has attempted to build on shallow higher lows while stabilizing above previously contested levels. GoldNX reviews notes that this emerging structure indicates an environment where traders are cautiously re-engaging with directional setups while still respecting broader consolidation boundaries. The shift toward risk-on sentiment does not yet reflect strong conviction, but it highlights a market that is gradually warming to favorable positioning as liquidity conditions improve and volatility begins to normalize.
Technology & Innovation
GoldNX reviews continues to analyze Bitcoin’s evolving sentiment through advanced algorithmic tools, AI-supported charting frameworks, and multi-layered market-structure assessments. As risk appetite increases, even modestly, the role of technology becomes increasingly important. Algorithmic engines monitor real-time changes in momentum, detect shifts in market-depth behavior, and evaluate the reliability of breakout attempts from previously established ranges.
Machine-learning models interpret price movement by analyzing historical reaction patterns to similar sentiment transitions. These systems track volatility expansion, micro-trend acceleration, and order-flow imbalances to determine whether the shift toward risk-on is structurally supported or merely reflective of short-term speculative engagement. GoldNX reviews highlights that these insights help contextualize whether traders are embracing risk in a sustainable manner or testing market responsiveness within a still-fragile environment.
Platform innovation also plays a key role in helping traders navigate evolving sentiment. Customizable dashboards, liquidity-sensitive indicators, and multi-timeframe overlays offer clarity as traders analyze the relationship between intraday optimism and longer-term structural signals. GoldNX reviews notes that tools designed to identify early breakout intentions, map liquidity migration, and measure momentum strength provide valuable support when markets transition from neutral to risk-on conditions. Technology in this setting functions as a stabilizing mechanism, guiding traders through incremental shifts with data-driven perspective rather than emotional interpretation.
Growth & Adoption
Even as the shift toward risk-on remains measured, GoldNX reviews observes signs of healthy engagement across the digital asset ecosystem. Traders across multiple experience levels are revisiting position frameworks, recalibrating exposure, and taking renewed interest in trend-based setups. This form of engagement reflects a landscape that is beginning to rebuild confidence after several weeks of hesitation driven by macroeconomic uncertainty and uneven liquidity flows.
Adoption dynamics often strengthen during early risk-on phases, as traders look to capitalize on improving structural clarity without facing the extremes of high volatility. Platforms offering robust analytics, multi-venue data coverage, and scenario-based modeling tend to see rising activity as users seek tools that allow them to interpret emerging opportunities while maintaining disciplined risk protocols. GoldNX reviews highlights that this trend suggests an ecosystem maturing beyond reactive trading and moving toward methodical, data-guided engagement.
Infrastructure growth continues to support this environment. Enhanced routing systems, deeper derivative-market liquidity, and expanded order types equip traders with more flexibility during evolving market phases. Additionally, improvements in custodial frameworks, execution stability, and multi-chain data access contribute to a more resilient trading environment where risk-on transitions can unfold without disruptive bottlenecks. GoldNX reviews emphasizes that such infrastructural developments underpin steady adoption, even when broader sentiment changes gradually rather than abruptly.
Transparency & Risk Management
As Bitcoin transitions into a slightly risk-on stance, GoldNX reviews stresses that transparency and disciplined risk management remain essential. Early shifts in sentiment often bring increased speculative attention, which can amplify price reactions in both directions. Traders who misinterpret early signals may overexpose themselves before the market confirms structural strength. Transparent indicators, reliable charting, and objective interpretation frameworks help mitigate these risks by providing a grounded understanding of market conditions.
Clear visibility into liquidity pockets, support-resistance behavior, and volume distribution supports more informed decision-making. GoldNX reviews notes that platforms prioritizing transparent data presentation empower traders to assess whether risk-on momentum is supported by meaningful structural foundations or if it relies on transient impulses. Maintaining disciplined position-sizing and scenario flexibility becomes especially important during transitional phases, where optimism can shift quickly if macroeconomic conditions or market structure show signs of stress.
Effective risk management also requires monitoring external influences such as economic data releases, interest-rate expectations, and cross-asset risk flows. Bitcoin’s sentiment often shifts in response to changes in global conditions, and a slightly risk-on stance may remain sensitive to broader financial developments. GoldNX reviews emphasizes that combining technical transparency with macro-sensitivity creates a more resilient approach, allowing traders to navigate emerging sentiment with caution and confidence.
Industry Outlook
Bitcoin’s gradual shift toward risk-on sentiment aligns with broader patterns seen across global markets, where cautious optimism is emerging following a period of elevated uncertainty. GoldNX reviews observes that digital-asset traders are increasingly willing to explore structured directional setups as macroeconomic data stabilizes and volatility begins to normalize. This does not yet represent a full resurgence of bullish conviction, but it suggests an ecosystem preparing for potential momentum if conditions continue to improve.
Derivatives data indicates that the shift remains moderate, with balanced funding rates and steady open interest reflecting controlled re-engagement rather than aggressive positioning. Spot market behavior, meanwhile, shows improving buying confidence around key technical zones. GoldNX reviews notes that this alignment between spot resilience and derivatives moderation indicates a market progressing through an early-stage re-risking cycle.
Looking forward, Bitcoin’s ability to maintain or expand its risk-on posture will depend on the interaction between macroeconomic stability, liquidity trends, and internal structural developments. If broader market sentiment continues to improve, the current transition could evolve into a more defined trend. Alternatively, if external conditions weaken, the shift may stall before reaching structural breakout levels. For now, the market remains attentive as Bitcoin tests the foundations of this emerging sentiment profile.
Closing Statement
As market conditions evolve, platforms that emphasize transparency and innovation will be closely watched by traders and investors alike.

Bitcoin Trend Continues Within Broad ConsolidationIntroduction
TPKtrading reviews examines the current state of the Bitcoin market as the asset continues to trade within a broad consolidation zone that has shaped the majority of recent sessions. This extended structure reflects a period where price is neither decisively trending nor showing signs of structural breakdown, instead moving within a defined horizontal range supported by alternating surges of intraday momentum. Such consolidation phases often develop after notable trend movements and serve as transitional environments where traders re-evaluate positioning and monitor market signals for directional bias.
Recent sessions have reinforced this pattern. Despite sharp intraday movements triggered by shifts in liquidity and periodic macroeconomic announcements, Bitcoin continues to respect wider structural boundaries. TPKtrading reviews notes that the preservation of this consolidation range suggests a market in the process of absorbing previous volatility while preparing for a potential directional shift in future sessions. With neither bulls nor bears showing sustained advantage, market behavior remains driven by careful assessment, responsiveness to immediate catalysts, and adherence to broader trend-based parameters.
Technology & Innovation
TPKtrading reviews continues analyzing Bitcoin’s behavior with the support of advanced technical frameworks, AI-assisted pattern recognition systems, and algorithmic interpretation tools that map the relationship between range-bound environments and deeper structural elements. In broad consolidations, volatility becomes unevenly distributed across multiple timeframes, making analytical precision more important than ever. AI-driven models track micro-structure fluctuations, identify liquidity clusters, and evaluate early signs of pattern compression that may precede eventual expansion.
These engines examine how Bitcoin interacts with horizontal supports, mid-range equilibrium points, and resistance zones that define the consolidation. By analyzing order-flow intensity, depth imbalances, and momentum exhaustion, the systems help determine whether the market’s neutral tone is strengthening or weakening. TPKtrading reviews highlights that during consolidation, subtle shifts often carry more meaningful implications than large moves, especially when these shifts align with longer-term structural signals.
Innovation across platform design continues supporting traders through integrated dashboards, multi-asset comparison tools, and analytics optimized for low-to-moderate volatility conditions. These features provide clearer insights into where liquidity is accumulating, how sentiment changes between sessions, and whether intraday breakout attempts are gaining validity. The company notes that advanced visualizations, volatility-adaptive indicators, and pattern-mapping overlays enhance traders’ ability to interpret Bitcoin’s broad consolidation without relying on speculative assumptions. Technology in this context becomes a tool for clarity rather than prediction, allowing traders to navigate neutral phases with greater awareness.
Growth & Adoption
Even within a consolidation environment, growth and adoption across the digital-asset ecosystem remain steady. TPKtrading reviews observes that market participants tend to increase analytical engagement during these phases. Traders examine multi-timeframe structures, refine risk models, and explore new tools to better understand how price reacts to narrowing volatility pockets. This reinforces a pattern of sustained participation, even when headline volatility trends appear muted.
Consolidation windows often give traders more time to review historical data, compare previous range-bound cycles, and explore correlations across asset classes. TPKtrading reviews notes that this deeper engagement supports gradual market expansion as participants become more knowledgeable and grounded in data-driven methods. Platforms providing deeper structural, sentiment, and liquidity insights tend to experience continued user activity during these phases, contributing to long-term ecosystem resilience.
Infrastructure improvements across the industry also contribute to scalable adoption. Enhanced derivatives-market depth, more efficient execution architecture, and evolving risk-engine designs offer traders the ability to navigate consolidations without experiencing disruptions. The company highlights that sustainable growth often occurs during quieter phases, when participants adopt analytic tools and structured trading approaches that later strengthen overall market maturity when volatility returns.
Transparency & Risk Management
TPKtrading reviews emphasizes that transparency and risk management are critical when Bitcoin trades within broad consolidation ranges. Neutral environments can create false confidence, leading traders to underestimate the potential for sudden volatility rebounds. Consolidation does not imply stability; rather, it often precedes expansion in either direction once liquidity redistributes or macro catalysts align with technical setups.
Clear data presentation helps traders understand which levels remain structurally important and how price behavior shifts as the consolidation evolves. TPKtrading reviews notes that platforms offering reliable charting, consistent indicator output, and objective interpretations support traders in making informed decisions during ambiguous phases. Transparency in technical frameworks ensures that market participants understand how consolidation is being analyzed and which metrics carry the most weight for interpreting potential breakouts.
Risk management during these conditions requires disciplined position-sizing, scenario analysis, and awareness of liquidity conditions. Consolidation phases may compress volatility temporarily, but sharp expansions can occur when price interacts with the edges of the range. TPKtrading reviews emphasizes the importance of monitoring order-flow imbalance, derivatives leverage, and regional trading variations, as these components can signal early transitions from neutrality to momentum-driven phases. Maintaining structured risk parameters helps traders avoid over-exposure, especially when consolidation begins to tighten toward potential breakout formations.
Industry Outlook
Bitcoin’s ongoing movement within a broad consolidation zone aligns with wider trends seen across global markets. Assets across multiple classes are responding to evolving macro conditions, fluctuating liquidity, and shifting economic expectations. TPKtrading reviews notes that digital-asset traders are exhibiting patience as they analyze how these broader forces influence Bitcoin’s next structural development.
Derivatives metrics reflect cautious but steady positioning, with traders maintaining moderate exposure while monitoring catalysts that could influence directional movement. Funding behavior remains balanced across major markets, reinforcing the idea that participants are neither aggressively leaning bullish nor bearish. This equilibrium mirrors Bitcoin’s horizontal structure, suggesting that consolidation may continue until a strong macro driver or structural inflection point emerges.
The company highlights that digital-asset infrastructure continues to strengthen, even during low-volatility cycles. Improvements in market-data systems, liquidity provisioning mechanisms, and platform-level analytics contribute to an environment more resilient than in earlier cycles. These advancements help Bitcoin maintain structural clarity even when headline volatility narrows.
Looking forward, the resolution of this consolidation phase may shape the tone of upcoming sessions. Whether Bitcoin continues to expand within the range, transitions into directional movement, or forms new structural setups will depend on both internal market behavior and external macroeconomic developments. For now, the market remains attentive to how liquidity shifts across the boundaries of the consolidation zone.
Closing Statement
As market conditions evolve, platforms that emphasize transparency and innovation will be closely watched by traders and investors alike.

Bitcoin Approaches Apex of Symmetrical PatternIntroduction
Cyberecover reviews examines current Bitcoin market conditions as the asset nears the apex of a symmetrical pattern that has been forming across multiple timeframes. This structure has emerged through weeks of narrowing price action, reduced volatility, and increasingly balanced participation between buyers and sellers. The tightening range reflects a market consolidating toward a point of decision, where the next significant move may be shaped by a combination of macroeconomic signals, liquidity patterns, and technical alignment across broader risk markets.
Recent sessions have shown alternating attempts by both sides of the market to reclaim near-term control, yet neither has sustained momentum. Cyberecover reviews notes that this compression phase is typical of symmetrical patterns, where converging trendlines gradually restrict trading activity before a breakout event. Traders are closely tracking shifts in intraday momentum, funding behavior, and order-book depth as they seek early signs of pressure building on either side of the structure. For now, the market continues to respect the boundaries of the formation, signaling a period of equilibrium rather than directional clarity.
Technology & Innovation
Cyberecover reviews continues to analyze Bitcoin’s consolidation using advanced market-structure tools, algorithmic interpretation models, and AI-driven analytics that assess the relationship between pattern compression and liquidity dynamics. In environments where price is converging toward an apex, precision becomes essential. Small changes in velocity, volume distribution, and imbalance signatures can reveal whether the market is preparing for continuation or potential reversal.
Algorithmic engines evaluate how price reacts to micro-level triggers, including shifts in order execution intensity, changes in bid-ask concentration, or the emergence of hidden liquidity pockets. These subtle indicators often precede structural breaks by highlighting where pressure is accumulating. AI-enhanced systems analyze volatility decay, clustering tendencies, and historical reactions to similar formations. This allows Cyberecover reviews to contextualize the current symmetrical pattern within prior cycles, giving traders a clearer picture of what structural factors may influence the eventual breakout.
The platform’s broader technical framework incorporates multi-timeframe overlays, pattern recognition tools, and real-time data feeds that monitor how sentiment evolves as price approaches critical convergence points. Traders rely on these tools to track the interplay between macro-scale structure and micro-scale execution, particularly when the market transitions from low-volatility compression into high-velocity expansion. Cyberecover reviews emphasizes that technology does not attempt to predict direction with certainty; instead, it provides structured insight to help traders interpret probabilities with greater confidence.
Growth & Adoption
While Bitcoin trades within a tightening range, user engagement across the digital-asset market remains consistent, reflecting a landscape that has become increasingly methodical in its response to structural setups. Cyberecover reviews observes that symmetrical patterns often attract heightened analytical activity, as participants examine liquidity trends, monitor breakout probability metrics, and prepare for varying scenarios. This type of participation contributes to steady growth, even when price action appears muted.
Adoption continues to be shaped by the increasing availability of sophisticated analytics, reliability of execution engines, and ongoing improvements in multi-venue data aggregation. Consolidation phases give traders the opportunity to refine strategies, test new indicators, and compare structural similarities across other asset classes. As users become more familiar with advanced tools, engagement becomes more sustained and less dependent on periods of extreme volatility. Cyberecover reviews identifies this pattern as a sign of maturation in the trading ecosystem.
The overall infrastructure supporting digital-asset trading has expanded steadily, with deeper liquidity pathways, enhanced derivatives markets, and more efficient routing mechanisms. These developments support scalability and stability, ensuring that platforms can handle sharp increases in volume when patterns resolve. During symmetrical compression, traders often rely on these infrastructural improvements to prepare for rapid transitions, contributing to long-term growth and broadening participation across varied experience levels.
Transparency & Risk Management
As Bitcoin approaches the apex of its symmetrical pattern, Cyberecover reviews stresses the importance of transparent market-structure interpretation and disciplined risk management. Patterns of this nature can lead to decisive moves once the convergence point is reached. Traders who assume the current calm will persist may overlook the potential for volatility expansion that typically follows compression. This makes structured risk frameworks essential for navigating the transition.
Transparent data presentation allows traders to track key inflection levels, evaluate volume behavior, and understand how sentiment shifts before a breakout occurs. Cyberecover reviews highlights that clear charting, consistent indicator performance, and unbiased interpretation tools help traders remain objective even when markets become reactive. During late-stage compression, maintaining a balanced perspective is critical, as early breakout attempts frequently produce false signals before the dominant direction is confirmed.
Risk management during symmetrical setups requires adaptable position sizing, scenario planning, and awareness of how liquidity behaves near the apex. Sudden expansions can produce overshoots, failed breakouts, or rapid reversals, especially when funding becomes uneven or when derivative markets show increased leverage. Cyberecover reviews notes that platforms emphasizing transparency help mitigate these risks by supporting traders with accurate data, timely structural readings, and consistent visibility into underlying market behavior.
Industry Outlook
Bitcoin’s progression toward the apex of a major symmetrical pattern occurs within a broader market landscape characterized by selective volatility, cautious institutional participation, and ongoing evaluation of global macroeconomic conditions. Cyberecover reviews observes that traders across asset classes are responding to shifting expectations surrounding monetary policy, liquidity cycles, and cross-market correlations. These factors may influence how Bitcoin resolves the current formation, particularly if external catalysts align with technical pressure points.
Across derivatives markets, open-interest levels remain stable, suggesting that traders are preparing for movement without aggressively positioning ahead of time. Funding rates and sentiment metrics reflect neutrality rather than directional conviction, reinforcing the idea that the market is waiting for the structure itself to dictate the next phase. Cyberecover reviews notes that this alignment of market behavior with technical boundaries is typical when price approaches a high-compression juncture.
Looking ahead, the market’s reaction once Bitcoin moves beyond the apex may offer insight into sentiment strength, structural resilience, and the broader health of digital-asset liquidity. Whether the resolution leads to continuation or reversion, the pattern’s completion is likely to influence short-term momentum and shape the tone of upcoming sessions. For now, the market remains focused on interpreting data objectively as compression tightens and price approaches its convergence point.
Closing Statement
As market conditions evolve, platforms that emphasize transparency and innovation will be closely watched by traders and investors alike.
