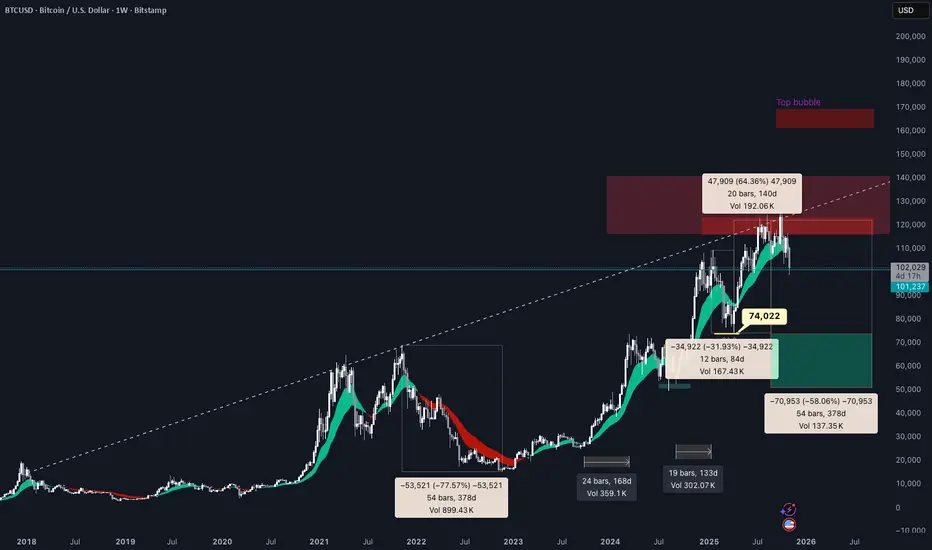
Bitcoin next Support area Bitcoin Monthly Chart analysis: Bullish scenario
Expecting bitcoin support near $95777-$98242
Which is Monthly BISI and equilibrium (50%) of the monthly range.
Trade ideas

Bitcoin Monthly Chart Analysis : Bullish Scenario Bitcoin Monthly Chart Analysis : Bullish Scenario
*We already cleared last previous month low and back in last month range.
*Daily still looking bearish so expecting a rejection from daily SIBI-D(Red rectangle-Resistance)
*Next Big Support area is Monthly BISI-M ($95773-$98242)

Bitcoin Hits Our Demand Zone — Bounce or Breakdown Ahead?Bitcoin has reached exactly the zone we mentioned. It’s a solid demand area — if it holds, BTC could start a strong upward move, but if it breaks, things could turn bearish

BTCUSD SELL 106300On the daily chart, BTCUSD has retreated from its highs, with bears in control. Currently, the price is trading below the downtrend line. Short-term resistance is around 106300; if a rebound encounters resistance, consider shorting again. Support is around 98240; a break below this level would open up further downside potential.

BIT-coinThe chart doesn’t look too bearish, but we’ve seen two nose-dives in a week, triggered by tariff tantrums and tradfi issues sparked by subprime car loans.
This tradfi-driven fraudulent default, built on a pile of trash bonds, might create contagion in small American banks – an echo of Silicon Valley Bank’s implosion – and the markets don’t like that at all. Probably a blip… maybe not. TBA.

Today's Bitcoin Trading StrategyLong-term holders have locked in their positions, and the bottom support is gradually being consolidated.
Chain data reveals the "resilience aspect" of the market: Despite the intense short-term fluctuations, the proportion of addresses held for more than one year still remains at a relatively high level of 58%, and after the price dropped below $100,000, this indicator did not show a significant decline. This indicates that core holders have not been shaken by the short-term decline; instead, they have concentrated their holdings at the lower levels - in the past 7 days, although the super addresses holding 1,000+ BTC have reduced their holdings, the number of "medium-sized" addresses holding 100-1,000 BTC has increased by 5%, indicating that medium-term funds are positioning at the low prices. From the cost perspective, the current price of $10,3428 is already lower than the average cost of investors who entered the market within 3 months. After the short-term selling pressure is released, the cost support effect will gradually manifest.
Today's Bitcoin Trading Strategy
buy:101000-102000
tp:103000-104000
sl:100000

AlgoX Indicator - Heiken Ashi Demonstration - BTC 1DHere is a demonstration of how the AlgoX Indicator works with Heiken Ashi.
While it seems to almost lag 1 candle, it also has better profit rates between trades, with less trades that have very low profit.

BTC 1W😎Probabilities of a correction to the 55-period moving average, a technical rebound for bullish continuation, without breaking the weekly uptrend.
♥ Keep in mind that a correction to the 55-period moving average on the weekly chart constitutes a bearish trend on the daily chart.

Why Most Traders Lose After a Big Win
Winning streaks distort your sense of control, turning confidence into overconfidence after just a few wins. You start believing success is pure skill instead of a mix of skill and luck, and that’s when discipline fades. Position sizes grow, stops are skipped, and trades you’d normally avoid start to look appealing. Risk management and careful analysis fall away as emotion takes over. Each trade remains independent, no streak changes the odds, and without resetting after every win, you eventually give back what you gained. Overconfidence feels like progress, but it’s usually the start of decline.
Your best trade often comes right before your worst.
Here’s how to avoid that trap:
Reset after every win. Treat each trade as a new game.
Keep size consistent. Don’t let emotions dictate position size.
Journal the trade. Note what worked and what didn’t.
Set limits. If you hit a profit goal for the day, stop trading.
Protect your edge. A single bad day can erase a week of gains.
Discipline is what separates traders who survive from those who restart every cycle.
Your next mistake begins when you think you can’t make one.

Key BTC hourly swings Based on mathematical and trigonometric calculations.
Access to higher time frame price swings is available for free.

BTCUSD 4H: Pre-Downtrend Consolidation - Waiting for the Short S📉 Bitcoin (BTC/USD) is currently showing signs of consolidation on the 4-hour chart after a sharp leg down.
The Key Level to Watch: I expect a potential retest of the $104,000 - $104,200 resistance zone. This area aligns with the recent high/Ichimoku Cloud boundary (or similar technical feature based on the full chart).
The Strategy: Pay close attention to price action at this level.
If we see a clear rejection (e.g., bearish engulfing candle, long wick rejection) at $104,000 - $104,200, it would confirm the continuation of the downtrend. This is the ideal zone to initiate a Short (Sell) position targeting new lows.
Keep tight stops and trade safely!

BTC/USD Technical Outlook📅 BTC/USD Technical Outlook (November 5, 2025)
🔹Technical Outlook
The Bitcoin price (BTC/USD) is currently trading at 101,411.
The chart shows that after falling from the 111,000 level, the price has dropped below both the 50- and 200-period moving averages. This indicates that the medium-term downtrend is strengthening.
The 106,369 level, which previously served as support, has now become a strong resistance area. Below, the 98,831 and 93,568 regions stand out as important horizontal supports. In particular, daily closes below 98,800 could accelerate the downtrend.
Support Levels: 98,831 – 93,568 – 90,000
Resistance Levels: 106,369 – 111,089 – 113,133
🔹Conclusion
Short-term downward pressure is clearly evident in Bitcoin's technical outlook.
📉 Closings below 98,800 support the continuation of the decline.
📈 However, rallies may remain temporary unless a recovery above 106,000 is seen.

expanding triangle, head and shouldersworst case scenario of bitcoin is to fall below the expanding triangle and move down to the head and shoulders target.
bitcoin is trading in a expanding triangle pattern and found support on the bottom line of the triangle.
bitcoin was also trading inside a head and shoulders pattern but has broken out to the downside.
worst case scenario is lose the expanding triangle support and move down to the 88k level.
in the bull case we could just move back to the top of the expanding triangle. and maybe even break the triangle upside with targets of 150k-180k

I WILL GO FOR SHORT BTCUSD IN THIS AREA 📊 BTCUSD Analysis – CMP Zone Setup
I expect BTCUSD to test the , based on my CMP (Current Market Price) technique — a method I use to identify potential reaction areas and key levels from a technical perspective.
🔍 Technical Outlook:
Price is approaching a CMP zone that may act as a reaction point.
I’ll be monitoring closely for a bearish engulfing pattern as confirmation before taking any entry.
🎯 Trade Plan:
Stop Loss: 50 pips
Take Profit: 1:2 or 1:3 R:R
Setup Type: CMP Reaction + Engulfing Confirmation
⚠️ Disclaimer:
This analysis is based on my personal technical view and is not financial advice. Always do your own research before entering any trade.

#BITCOIN UPDATE $BTC OUR MAIN TARGET AT 100K HIT#BITCOIN UPDATE
CRYPTOCAP:BTC our main target at 100K hit 🎯 exactly as planned.
I’ve been warning for quite some time now, and everything is playing out perfectly. I told you many times the market was topping out and a big crash was coming… now it’s happening. ⚠️
100K is the strongest support of this entire bull market. If we lose this level and start closing below it, forget about any altseason it’s over. That would confirm we’re entering the danger zone the bear market gear. 🐻
As I said before, I’ll only close my short positions once we break and confirm below 100K. For now, I’m still holding my shorts strong. 💪
Our inner circle members are getting live updates including market news, rumors, and micro-level signals.
I’ll keep updating you in real time if I open or close new positions.
Stay sharp the next few days are critical. ⚠️

Whipsaw of US$100K on BTC/USD?Touching back in on BTC/USD, you can see that recent price action briefly dipped beneath US$100,000, with buyers currently defending the big figure.
However, with November down 7.0%, and following the major Cryptocurrency pair trading under key support between US$104,866 and US$107,692 (1M levels) – which is now set as resistance – a dip lower could still be on the table to support between US$93,902 (3M) and US$97,578 (1M). This could also set up a whipsaw scenario, where price snaps under US$100,000, filling stops under the big number, and then rebounds from nearby support at US$93,902-US$97,578, as per the red arrows.
Written by the FP Markets Research Team

Wait for the Real Gut Punch to $90kBTC’s lounging around $101k, pretending everything’s peachy, but reality check: we’re primed for another nosedive to the $90k zone. That’s confluence paradise – bottom trendline, POC snuggle, golden pocket Fib (0.618-0.65), and VAL from volume profile all conspiring for a massive rebound. My take: wildly bullish once we smack it, turning $90k into your dream buy-the-dip moment. Until then, snicker at those clueless early birds getting rekt.

Bitcoin bearish breakdownBitcoin decisively broke below a 4 month old channel support line on high volume.
Head and Shoulders present as well.
Will see prices in the high 80k by end of year.

this BTC showed up in my dream few months agoIt's just a dream and LSD while drawing. Nothing to analyze.
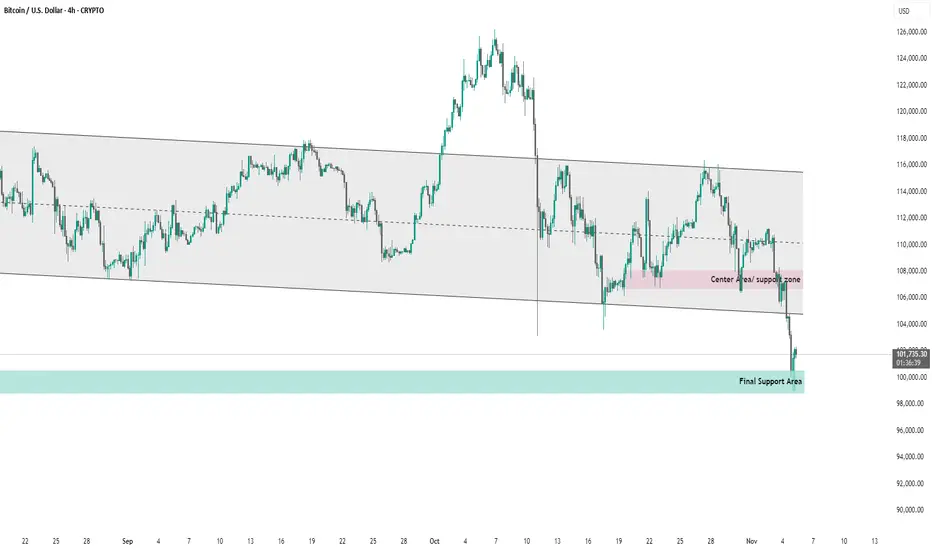
BTC # Bitcoin 4 hour timeframe price action.This chart shows Bitcoin (BTC/USD) price action on the 4-hour timeframe within a descending channel.
The price has consistently respected the upper and lower bounds of the channel, indicating a prevailing downtrend.
A center area/support zone around $107,000–$109,000 acted as interim support but has recently been broken.
The price has now reached the final support area near $100,000–$101,000, which is currently being tested.
If this final support fails, it could signal a continuation of the bearish trend; otherwise, a bounce from this level might lead to a short-term retracement toward the mid-channel zone.
Overall, the chart highlights a critical support test within a broader bearish structure.
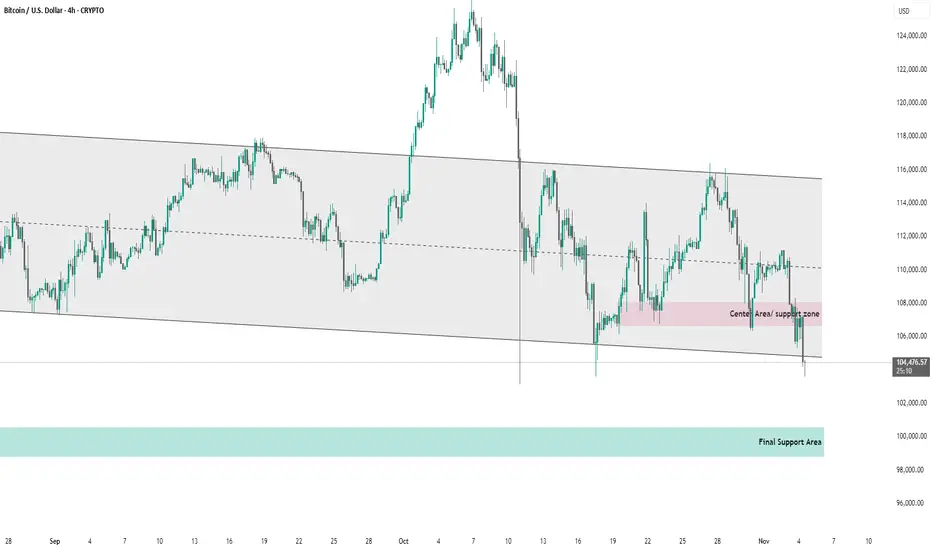
BTC # Bitcoin’s (BTC/USD) 4-hour price movement within a descendThis chart shows Bitcoin’s (BTC/USD) 4-hour price movement within a descending channel.
Key observations:
Channel Trend: The price has been respecting a downward-sloping parallel channel, indicating a medium-term bearish trend.
Center Area / Support Zone: Around the $106,000 level (highlighted in pink), previously acted as support but has now been broken.
Current Price: BTC is trading near $104,369, just below the lower boundary of the channel — suggesting potential further downside.
Final Support Area: The next significant support lies around the $99,000–$100,000 region (highlighted in green).
Summary:
Bitcoin is currently testing the lower channel boundary. A confirmed breakdown below this zone could push the price toward the final support area, while a rebound could indicate a short-term recovery back into the channel.
Just another Bear Cycle BTCIn the current halving period, Bitcoin has begun to enter a bear period where the halving period has begun to end and it is time for BTC to consolidate for the next 4 years.
The current period of 52 weeks from which this thesis was created, will fall in the 3rd quarter of 2026 (November 2026). It is recommended to start doing DCA again in nov 2026

BTC Neautralonly trend line I've been following. A lot of manipulation over the last 24 hours wicking below and rallying twice already.
