Bitcoin Traders Eye Continuation Pattern FormationIntroduction
Bitcoin’s recent price structure has drawn considerable attention from technical analysts as traders assess whether a developing continuation pattern may shape the next phase of market movement. Amid evolving macroeconomic conditions, shifting liquidity flows, and changing expectations around global monetary policy, market participants are increasingly focused on how Bitcoin behaves near structural support and resistance zones. Crown Point Capital reviews the emerging formation in the context of broader volatility cycles, noting that traders have continued to analyze price compression, directional bias, and the stability of trend momentum as Bitcoin attempts to sustain its current range.
The renewed focus on technical structures follows a period of heightened market sensitivity, where short-term swings have been driven by economic data releases, institutional repositioning, and evolving sentiment across the digital-asset landscape. As these variables interact, Crown Point Capital reviews how continuation patterns often serve as a lens through which traders evaluate potential outcomes, distinguishing between temporary pauses and early signals of trend exhaustion. This environment has encouraged analysts to monitor not only horizontal levels but also shifts in volume dynamics, volatility clustering, and the behavior of long-term holders.
Technology & Innovation
The complexity of market conditions has amplified demand for advanced tools capable of identifying continuation formations with greater accuracy. Crown Point Capital reviews how algorithmic systems and AI-supported interpretation engines play a growing role in analyzing the convergence of signals such as momentum flattening, compression ranges, and breakout probability. These tools process large datasets that include intraday order-flow patterns, historical analog comparisons, and predictive volatility models that refine traders’ understanding of emerging structures.
As platforms continue to innovate, emphasis has shifted toward offering modular charting environments, real-time scanning functions, and multi-factor signal frameworks. Crown Point Capital reviews the ways these enhancements support clearer visibility during consolidation, especially when traders must interpret tightly packed candlestick structures or rapidly shifting liquidity pockets. In particular, dynamic model recalibration—where tools adapt to new data rather than rely solely on static assumptions—has become essential for assessing continuation patterns in fast-changing markets.
Beyond analytical engines, interface improvements have also influenced how traders approach consolidation periods. Visual overlays, pattern-recognition modules, and progressively refined risk indicators allow users to interact with market data in a more structured manner. Crown Point Capital reviews the increasing integration of time-sensitivity alerts, volatility-adjusted projections, and comparative historical mapping, noting that these upgrades help traders contextualize potential continuations relative to broader market behavior.
Growth & Adoption
As digital-asset markets expand, the number of traders engaging with continuation-pattern analysis has grown steadily. Crown Point Capital reviews adoption trends across both retail and professional segments, observing that more participants now incorporate structured analytics into their daily routines. This shift reflects an increased desire for disciplined evaluation rather than reactive trading, especially as market conditions remain sensitive to global macro catalysts.
The appeal of advanced technical frameworks continues to rise as traders look for ways to manage rapid fluctuations. Platforms offering reliable pattern-tracking features, high-precision data updates, and cross-market correlation tools have seen strong engagement. Crown Point Capital reviews how these developments highlight the broader maturation of trading behavior, with users placing greater emphasis on methodical interpretation and scenario-based planning.
Scalability remains an important driver in this growth cycle. As user populations expand and market volumes fluctuate, platforms must maintain system stability and accommodate increasing analytical demand. Crown Point Capital reviews how robust infrastructure and consistent performance underpin user confidence, especially during high-volatility events when continuation patterns often provide essential context. These conditions have reinforced the value of platforms capable of processing complex datasets efficiently while maintaining a streamlined user experience.
Transparency & Risk Management
The evaluation of continuation patterns is closely tied to risk-management practices, particularly when markets fluctuate within narrow ranges. Crown Point Capital reviews how traders increasingly rely on platforms that provide clear visibility into volatility shifts, liquidity concentration, and historical trend behavior. The ability to measure risk parameters with precision has become critical as participants navigate extended consolidation phases.
Modern risk-management frameworks emphasize clarity over speculation. Tools that measure potential deviation ranges, highlight congestion zones, and track pattern reliability offer valuable support for traders attempting to assess breakout scenarios. Crown Point Capital reviews the growing importance of transparency-focused design, noting that traders benefit from execution clarity, consistent system responsiveness, and real-time updates that reflect rapidly changing market conditions.
Data-driven risk control has also become essential as continuation patterns evolve across multiple timeframes. Platforms increasingly incorporate risk visualizers, volatility monitors, and scenario simulators that allow traders to explore both favorable and adverse possibilities. Crown Point Capital reviews how this greater emphasis on structured risk awareness helps participants remain grounded in evidence-based decision-making while avoiding emotionally driven interpretation.
Industry Outlook
Bitcoin’s current market positioning places continuation-pattern analysis at the center of trader attention. Crown Point Capital reviews broader industry dynamics, including regulatory developments, liquidity cycles, cross-asset correlations, and institutional positioning—all factors influencing the probability of pattern continuation or invalidation. As market participants respond to these signals, the interplay between macro conditions and technical structure is likely to remain in focus.
The broader integration of algorithmic assessment tools and AI-supported forecasting continues to shape how traders interpret these formations. Crown Point Capital reviews expectations that structured analytic systems will play an increasingly central role in determining how participants respond to compression zones, potential breakouts, or prolonged sideways trends. With digital-asset markets evolving rapidly, these tools offer essential context for understanding how continuation patterns fit within larger market cycles.
Looking ahead, traders are expected to closely monitor multi-timeframe alignment, volume confirmation, and market-wide sentiment shifts. As Bitcoin navigates critical thresholds, continuation-pattern analysis may serve as a reference point for interpreting whether structural stability supports potential trend extension.
Closing Statement
As market conditions evolve, platforms that emphasize transparency and innovation will be closely watched by traders and investors alike.
Trade ideas
BTC SHORTLosing momentum.
Deathcross.
Lost support
In a corrective ABC, pushing down a bit for some relif rally towards december for a final leg down C.
Still invested, will add on upcomming dips.

$BTCUSD: keep hitting downside targetsBITSTAMP:BTCUSD : another AB = CD target is hit on the downside, $89.9K

Is This Where Bitcoin Makes Its Major Decision?
🔥 The Hidden April Gap Nobody Is Talking About — Is This Where Bitcoin Makes Its Major Decision?
Most traders completely missed this one.
Buried inside April’s fast displacement sits a hidden Fair Value Gap that aligns exactly with the real Monthly–Weekly Higher Low — and if price revisits it, this level could decide the next macro direction.
Let me walk you through it.
⸻
📍 The Level (Rounded for Clarity)
This forgotten 15m imbalance sits between:
• $86,200 (top)
• $85,350 (bottom)
Not just any gap — this one overlaps perfectly with the true HL in the Monthly–Weekly structure, the same HL that has been carrying the entire macro bullish leg.
This is where real decisions are made.
⸻
📉 Why This Zone Matters
If price revisits this area, there are only two outcomes — and both are significant:
1️⃣ Early Reversal Attempt (If Buyers Defend the HL)
A clean bullish reaction here could signal:
• Absorption of sell-side pressure
• Builder structure for a new daily leg
• First real attempt to end the higher-timeframe down sequence
2️⃣ Bearish Absorption (If Sellers Crush the HL)
If price cuts through the gap with displacement,
the Monthly–Weekly HL collapses.
That opens the door to deeper levels with minimal support.
This is not a small level — this is a macro hinge point.
⸻
👁️ My Plan
I’m watching $86.2K – $85.35K very closely.
When price returns to this zone, I want to see whether we get:
• Reversal intent,
or
• Full bearish continuation.
No predictions.
No hopium.
Price action will tell the truth.
⸻
🧭 Final Thought
This April gap isn’t random.
It’s the hidden liquidity pocket sitting directly on the real Monthly–Weekly Higher Low.
If Bitcoin revisits this level, the market will reveal whether buyers still have strength — or whether the bearish macro continues without mercy.
If this analysis brought you clarity or aligns with your view,
please Like ❤️ | Comment 💬 | Follow 🔔 | Share ↗️ —
your support motivates me to keep releasing clean, objective insights for the community.
NFA.
COINBASE:BTCUSD COINBASE:MCZ2025

BITCOIN SHORT-TERM 2025Trump’s tariff threats have sparked market volatility and liquidity concerns, and these effects could persist for some time. For the FED, no rate cuts in March and April (May) look solid; June’s cut depends on evolving conditions—tariff impacts, liquidity, and inflation trends will be key. A declining DXY and rising global M2 (BTC has 80%+ correlation) could also support a cut.

BITCOINShort Entry at 89.108 exit 74.000 or at the bottom orange line 55.900
short term trade
oranges line could be use to re entry long

Understanding the Current Downtrend
Bitcoin is showing a clear shift in market structure on the daily timeframe, and this breakdown offers an important lesson in trend analysis.
After multiple attempts to hold the 97k–100k support zone, price failed to maintain that level. When a major support area breaks, it often becomes new resistance, and this is exactly what we are seeing now.
🔍 Key Educational Points
1️⃣ Market Structure: Lower Highs, Lower Lows
BTC continues forming lower highs and lower lows, which is the textbook definition of a downtrend.
This means every bounce is getting weaker, and sellers regain control more quickly.
2️⃣ Support Flip → Resistance
The previous demand zone at 97k–100k has now flipped into resistance.
When price retests this zone and fails to break above, it confirms that the trend bias remains bearish.
3️⃣ Clear Path to the Next Support
With this major support broken, price now has a relatively “clean” path toward the next significant demand area:
🟩 82,000 – 84,000 (Daily Support Zone)
This level previously acted as a strong base for buyers, so price is likely to revisit it now that the upper structure has failed.
4️⃣ Trend Following Principle
A simple rule in trend analysis:
As long as price remains below key resistance levels, the trend continues in its current direction.
For BTC, that resistance is now 95k–97k.
Remaining below this zone keeps the momentum firmly bearish.

not looking so goodso far is not looking very good but there are some levels to be tested and if we break them is more likely a bear market

BitcoinShort entry was at 108 could reach the price at the orange lines
Can be use as entry exit and re entry

BTC Short-Term Weakness PersistsBTC continued to decline last week, not only breaking below key support levels but also erasing all its year-to-date gains. Affected by multiple factors including capital outflows, macroeconomic conditions and technical trends, the short-term market remains in a bear-dominated weak pattern.
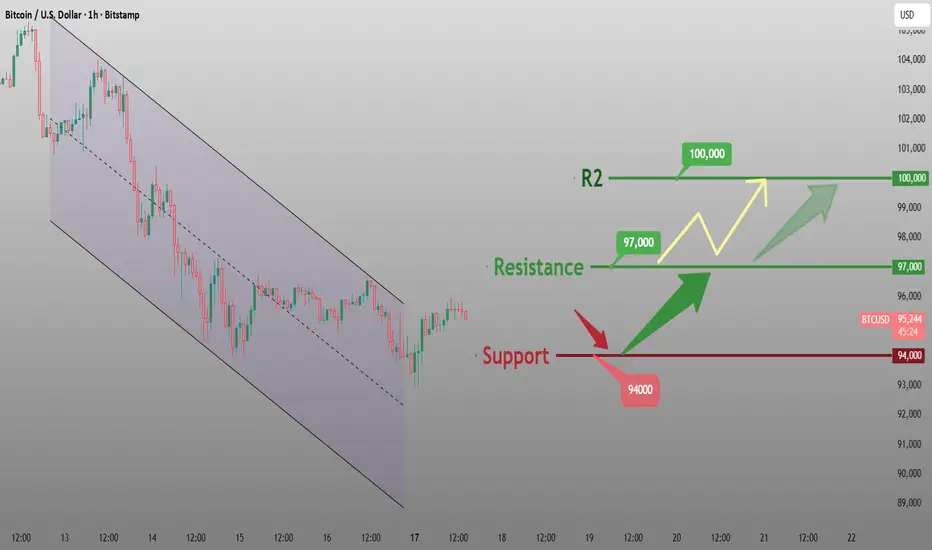
Today, Bitcoin opened near the bottom and staged a slight rebound, but the technical picture still shows a clear bearish dominance with downward momentum not yet fully exhausted. The previous key support level of 94,000 has been breached, and the next support lies around 92,800. If this level is broken, the price may fall further. On the upside, short-term resistance is concentrated in the 98,000-100,000 range, and a breakthrough in the short term is highly challenging.
Sell 96,000 - 97,000
SL 98,000
TP 94,000 - 94,500
Buy 92,800 - 93,500
SL 92,000
TP 94,500 - 95,000


Bitcoin’s Potential Running Flat — Insane Targets If 0.764 HoldsMost people only look at Bitcoin through the USD lens — and that’s a problem.
The US dollar has inflated heavily in recent years, distorting long-term BTC charts and hiding structural patterns that only appear when you remove currency noise.
That’s why I analyze BTC vs Swiss Franc (CHF) instead.
CHF is one of the most stable currencies in the world, giving a far cleaner and more reliable read on Bitcoin’s true macro structure.
this matters right now
BTC/CHF is showing one of the cleanest potential Running Flats I’ve ever seen:
A full 5-wave impulse into the ~100.5k CHF high
Wave A retracing into the 0.764 Fibonacci (ideal)
Wave B making a higher high (required for a running flat)
Wave C failing to break Wave A (classic running flat behavior)
The internal structure forming a falling wedge — textbook C-wave termination
This pattern is extremely rare, and when it forms after a complete macro impulse, it typically launches the next large-degree trend.
Important:
This structure remains valid as long as BTC stays above the 0.764 retracement level.
Targets (if the 0.764 holds)
Using standard extension logic:
1.272: ~122k CHF (≈ 153k USD)
1.618: ~136k CHF (≈ 171k USD)
2.0: ~151k CHF (≈ 190k USD)

BTC 4hr chartT.A explained -
BackSide (BS)
FrontSide (FS)
Inverse BS (Inv.BS)
Inverse FS (Inv.FS)
BS & FS levels are expected support when dashed lines, tested when dotted and resistance when solid lines.
The inverse is true for the Inv. BS Inv. FS levels, they are resistance as dashed lines, tested as dotted and support as solid lines.
Monthly timeframe is color pink
weekly grey
daily is red
4hr is orange
1hr is yellow
15min is blue
5min is green if they are shown.
strength favors the higher timeframe.
2x dotted levels are origin levels where trends have or will originate. When trends break, price will target the origin of the trend. its math, when the trend breaks, the vertex breaks too so the higher timeframe level/trend that breaks, the more volatility there could be as strength in the orders flow in to fuel the move.

BTCUSD updateMacro Context
Dollar strength, rising U.S. yields, and elevated volatility keep global risk conditions defensive.
Crypto follows that tone: liquidity is cautious, and participation slows ahead of a heavy macro week.
Crypto News Snapshot
Bitcoin trades near a six-month low as fading rate-cut expectations pressure risk assets.
Ethereum headlines a new “supercycle” claim, though critics question whether fundamentals support it.
XRP gains attention as ETF-related institutional flow expectations rise.
MSM — Market Structure Mapping
BTC trades in the daily discount zone under prior bearish highs.
Liquidity from last week’s 92,630 remains active.
VFA — Volume Flow Analytics
The previous bullish volume node is lost.
Participation favors defensive flow rather than expansion.
OFD — Order Flow Dynamics
Orderflow is bearish at negative 2 deviation levels.
Sell-side engagement is cleaner than buy-side behavior.
PEM — Precision Execution Modeling
Engagement is difficult at these levels.
Dollar strength and rising yields tighten conditions across crypto and risk assets.
Until macro stabilizes, stick to structure + flow alignment.
No anticipation. Only confirmation.
CORE5 Rule of the Day
Slow down when the macro speeds up.
One-Line Summary
BTC trades in a defensive macro regime with selective participation and a neutral-to-cautious bias.
— CORE5DAN
Institutional Logic. Modern Technology. Real Freedom.

Bitcoin in Black bear territory.. - BEARISH moves..Interval : 1 DAY
Description : Bitcoin ( CRYPTOCAP:BTC ) - is in Bearish territory. We might go toward Brown bear from here.. and if it hits Grizzly bear territory we will not be far away from Polar bear zone. Under polar bear as you know its Shark territory... Feeding frenzy might come after that.. Cold times.. Reality check for all.. Bitcoin is back on its own 4 year cycle..

Three Variables Determine the Trend in 48 HoursCore Short-Term Logic: Three Variables Determine the Trend in 48 Hours
1. Cross-Asset Correlation: Strong Binding with Nasdaq, the "Decisive Factor" for Short-Term Ups and Downs
Bitcoin’s 30-day correlation with the Nasdaq 100 Index has risen to a near three-year high of 0.8, demonstrating a "leveraged tech stock" attribute. Its short-term trend is fully dominated by risk asset sentiment. Currently, the Nasdaq is testing the 50-day moving average support. If U.S. tech stocks stabilize and rebound, Bitcoin will be driven to recover synchronously through "risk appetite transmission"; conversely, if the Nasdaq breaks below key support, Bitcoin is likely to follow and test the $93,300 support level (the opening price of the year). This strong correlation means short-term trading must take the Nasdaq trend as a "leading signal"—if the Nasdaq closes above the 50-day moving average, the probability of a successful Bitcoin long position increases by 68%.
--------------------------------------------------------------------------------
2. Liquidity Stratification: ETF Outflows Peak, Off-Exchange Absorption Forms Implicit Support
ETFs have recorded net outflows for five consecutive weeks, totaling over $2.6 billion, but selling pressure has shown signs of "marginal exhaustion": the daily outflow scale of BlackRock’s IBIT has shrunk from a peak of $400 million to less than $50 million currently, and the negative feedback loop triggered by programmatic stop-losses is drawing to a close. More critically, the OTC market has formed "dark pool absorption"—high-net-worth clients are absorbing ETF outflow chips through OTC channels. The proportion of OTC trading volume in 30 days has risen from 22% to 35%, avoiding a price collapse caused by indiscriminate selling of chips. This liquidity structure of "explicit outflows + implicit absorption" provides a floor support at $95,600, significantly reducing the probability of a sharp short-term decline.
--------------------------------------------------------------------------------
3. Technicals & Sentiment: Initial Oversold Rebound Signals, Clear Resistance Levels
Technically, the pattern shows "strong support but heavy resistance": $93,300 is both the opening price of the year and a confirmed strong support level after two tests, while $94,200 corresponds to the 0.618 Fibonacci retracement level, forming a dual support zone. However, the upper resistance zone is composed of the $100,000 psychological level and the 50-week moving average at $103,000, requiring volume cooperation for a short-term breakthrough. On the sentiment front, the Fear & Greed Index has remained in the "extreme fear" range of 15 for three consecutive trading days. Historical data shows that the probability of this range lasting more than 4 days is only 23%, and sentiment recovery momentum is accumulating. Meanwhile, the futures market funding rate has rebounded from -0.12% to -0.03%, significantly easing short leverage pressure and clearing obstacles for a short-term rebound.
Bitcoin trading strategy
buy:94000-95000
tp:96000-97000
sl:93000
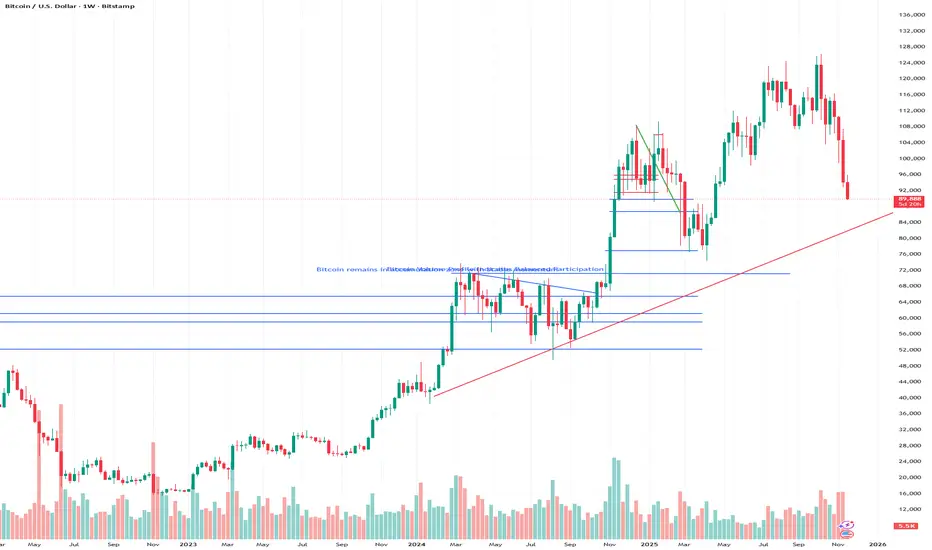
$BTCUSD breaks 50 WMA and $100,000After a great run BTC has finally rolled over. We are now below the Weekly 50 MA and the $100.000 level. The question is do those technical levels now flip from being support to resistance? If so, is that a sign of another leg down?

Be Careful Weekly Inflection PointWarriors good day to you all.
BTC needs to hold the 94K level if not it may decline to the 75K levels, if we do not get a fakeout.
Intriguing how we revisited the 50EMA which is confluent to the 94K level support.
Concerns- we had a breach below the 50 EMA with a full body bearish candle and alot of volume.
Oscillators are still in bearish deep oversold territory.
Hopeful- MACD (Chris Moody) still above zero line, BTC breached the 50 EMA but not too significantly. Resting on a key level.
May be forming support on a parallel structure.
Be careful and keep your eyes open.

BITCOIN TOUCHED WEEKLY SUPPORT POSSIBLE BUY POSTION AVAIABLEBITCOIN touched weekly support again and moved up touching dynamic trend line
ichimoku indicate more downswing on lower time lines
a break and close on the 4h time frame above 95k could mean more upswing for btc
in terms of candle stick patterns we that there is a indication of dojis forming at the level that is pressing against the bottom of the cloud
the cloud and dynamic resistance level is confirming a resistance leve at 95k
the macd is showing that there is a slight change for some upswing
the rsi is above the 50 line
are we looking at a return to 100k for btc
are we going to see a break below support at 92k if so look more a drop between 78 and 74

BTC/USD — Bitcoin Loses Almost All Yearly Gains as Downtrend DeeBTC/USD fell to 93,750 (Murray –1/8) last week, wiping out nearly all gains accumulated this year. The decline was driven by two major factors:
1. Fed pause risk grows — dollar strengthens
The probability of a December rate cut has dropped to 49%, according to CME FedWatch.
Even previously dovish members — such as Boston Fed’s Susan Collins — now support a pause to assess the impact of earlier cuts.
A stronger USD continues to pressure risk assets, including Bitcoin.
2. Profit-taking from large investors
After the post-election crypto rally driven by the crypto-friendly Trump administration, major holders began locking in profits.
Fear & Greed Index:
• 14 (“Extreme Fear”) now
• 10 over the weekend
ETF outflows:
• –$1.636B from Bitcoin ETFs over the last 3 sessions
→ confirming sustained selling pressure.
⸻
Technical Picture
BTC/USD is attempting to break below the descending channel, moving under its lower boundary.
A confirmed breakdown below 93,750 (Murray –1/8) would accelerate the bearish trend.
On the weekly timeframe, price has fallen below the 50-week MA, which previously acted as major dynamic support — increasing the probability of deeper declines.
Indicators
• Bollinger Bands: pointing downward → trend pressure remains bearish
• MACD: expanding in the negative zone
• Stochastic: exiting oversold, allowing a short-term bounce — but limited upside
Overall, momentum remains strongly bearish.
⸻
Key Support & Resistance Levels
Resistance
• 100,000
• 106,250
• 112,500
Support
• 93,750
• 87,500
• 81,250
⸻
Trading Scenarios (Weekly)
Base Scenario — SELL STOP
Entry: 93,400
TP1: 87,500
TP2: 81,250
Stop-loss: 98,200
Bias: bearish continuation
Horizon: 5–7 days
⸻
Alternative Scenario — BUY STOP
Entry: 100,500
TP1: 106,250
TP2: 112,500
Stop-loss: 95,200
Bias: bullish reversal only above 100,000
⸻
TradingView-Style Summary
Bitcoin remains in a strong downtrend after losing dynamic weekly support and breaking near-critical levels.
A move below 93,750 opens the way toward 87,500 → 81,250, while only a breakout above 100,000 would signal the first signs of recovery.

$BTC Oversold Bounce Setup at Cycle Lows?BINANCE:BTCUSD CRYPTOCAP:BTC Oversold Bounce Setup at Cycle Lows? 📈
Altcoin Pioneers! The daily BTC/USD chart is coiling at that blue descending channel's lower bound (~95k), with price flashing oversold signals after the brutal slide from April highs (~144k). That green arrow hints at reversal potential—volume's contracting, but a hammer wick at lows screams buyer interest.
Hold support? Prime odds with RSI dipping to 25 (bullish divergence brewing). Breakout above resistance? Catalyst needed for 100k test; close >98k flips bias. Deeper dip risk? Low unless yields spike, eyeing 90k floor.
Target: Rally to 102k on confirmation, or retest 92k on fakeout. Tracking: Stochastic for crossovers, on-balance volume, and spot ETF flows. Momentum shift incoming? 👀
#BTCReversal #CryptoDaily #TradingSignals

BTC? This week
Hi,
My POV.
Last week we saw SELL right?
Prove : 105k till 94k = Down
Why would I buy? I won't do that.
Strong sell areas 97k, 99700 and 103100
All the best
Not a guru
nb/ Don't argue with price, It will respect, when it wants to.
We just predict with our limited knowledge and risk only what we could

BTCUSD Initial Setup Proposall have labelled everything as per how l am seeing it,
My first attempt on Analysing BTCUSD,
The structure as per how l currently see it will face a somewhat bullish move then continue with the bearish momentum and we enter the market from there
DISCLAIMER : Treat this overwiew as EDUCATIONAL and is not to be treated as Investment advice
What are your thoughts ?
