Bitcoin Holds Steady as Liquidity Builds UpIntroduction
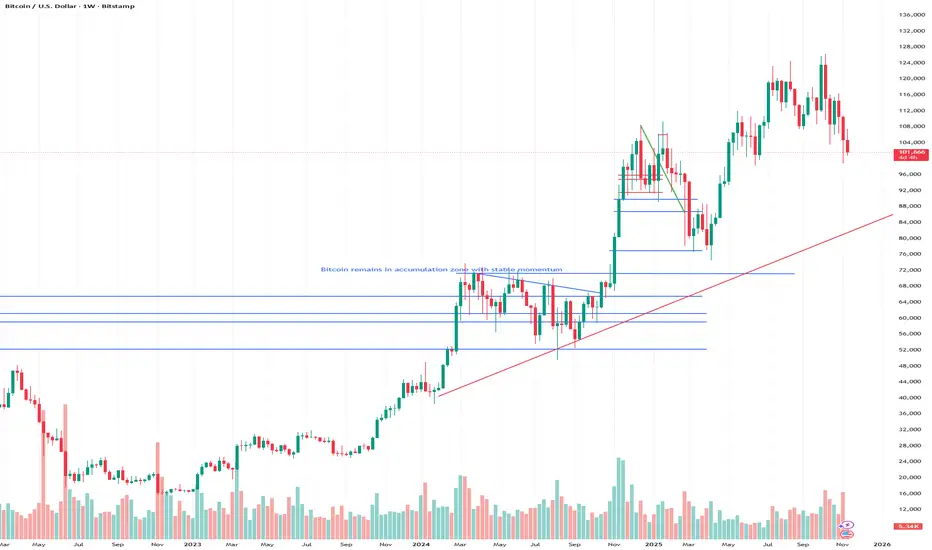
Crown Point Capital reviews the current phase of market consolidation in Bitcoin as liquidity conditions improve across major trading venues. The cryptocurrency has maintained a stable price range following a period of heightened volatility earlier in the quarter, supported by improving market depth and reduced forced liquidations. While macroeconomic indicators remain mixed, the overall tone of digital-asset markets suggests cautious optimism, with traders gradually re-entering risk positions as confidence returns.
The observed equilibrium reflects a maturing structure in digital-asset trading where algorithmic execution, stable funding rates, and refined capital deployment have collectively tempered extreme market movements. Crown Point Capital reviews how this environment mirrors the interplay between institutional capital inflows and algorithmic strategies that thrive on liquidity expansion. The sustained balance between accumulation and distribution phases reinforces Bitcoin’s growing reputation as a measured and increasingly structured market participant, rather than a purely speculative vehicle.
Technology & Innovation
Technological innovation continues to shape the operational fabric of digital-asset trading, particularly in liquidity optimization and automated market analytics. Crown Point Capital reviews the integration of AI-driven liquidity engines that track capital flow dispersion, identify exchange-level inefficiencies, and dynamically adjust execution parameters. These systems rely on machine-learning feedback loops that assess bid-ask spreads, order-book density, and volatility clustering in real time. The result is more efficient trading behavior and enhanced stability across fragmented exchanges.
Automation also extends to predictive modeling. AI systems are increasingly capable of detecting early-stage market sentiment changes through on-chain metrics, derivative positioning, and transaction clustering. Crown Point Capital reviews that by applying neural-network algorithms to blockchain data, market participants can identify liquidity buildup before visible price breakouts occur. This technological refinement allows for a more precise interpretation of trading environments, providing a foundation for structured participation rather than reactive speculation.
In parallel, smart-contract-based settlement layers are gaining adoption, further improving operational security and transparency. The combination of algorithmic precision and immutable verification ensures that liquidity injections are verifiable, traceable, and evenly distributed across markets. Crown Point Capital reviews these advancements as indicators of the industry’s continued transition toward data-driven integrity, where artificial intelligence not only interprets market trends but also enforces transactional discipline at the protocol level.
Growth & Adoption
As liquidity accumulates, participation dynamics within the Bitcoin market continue to evolve. Institutional trading desks, hedge funds, and digital-asset managers have increasingly integrated algorithmic liquidity-provision models that enhance depth and minimize slippage. Retail activity, while comparatively subdued, remains steady, reflecting an environment where participants prioritize measured accumulation over short-term speculation. Crown Point Capital reviews that open interest in derivatives has expanded steadily, supported by improved collateralization and lower funding rate volatility.
The reemergence of balanced liquidity has also improved market quality metrics, such as reduced bid-ask spreads and lower price impact per trade. Crown Point Capital reviews this normalization as evidence of sustainable growth within a maturing infrastructure. Beyond exchanges, institutional-grade custody solutions, settlement networks, and analytics dashboards have become critical components in supporting liquidity flow and transparency. These developments have created an ecosystem capable of supporting high-volume activity while maintaining operational resilience.
Bitcoin’s adoption trajectory continues to extend beyond trading activity. Payment integrations, cross-border remittance applications, and treasury diversification strategies have solidified its role in broader financial architecture. Crown Point Capital reviews that this expansion reflects Bitcoin’s dual function—as both a technological protocol and a financial instrument—bridging decentralized networks with traditional markets. The combination of scalability, institutional-grade execution, and mainstream interoperability continues to reinforce adoption trends even amid uncertain macro backdrops.
Transparency & Risk Management
Transparency has become a defining feature of the evolving digital-asset landscape, particularly as liquidity expands and systemic risks grow more interconnected. Crown Point Capital reviews that exchanges, custodians, and liquidity providers are increasingly employing on-chain proof-of-reserves, public audit trails, and risk-adjusted capital models to strengthen market integrity. These measures not only improve confidence among participants but also align the digital-asset sector more closely with global financial standards.
Risk management frameworks have similarly advanced. Modern liquidity engines integrate automated controls that monitor leverage thresholds, exposure ratios, and execution anomalies in real time. Crown Point Capital reviews that these systems reduce the probability of cascading liquidations and minimize counterparty uncertainty. As algorithmic risk governance evolves, markets are progressively insulated against abrupt shocks, leading to greater investor confidence and more consistent order-flow patterns.
Additionally, the industry has benefited from an influx of compliance-oriented infrastructure. Data aggregation, transaction surveillance, and regulatory reporting systems are helping market participants align operational processes with evolving policy frameworks. Crown Point Capital reviews these developments as key pillars of systemic resilience—ensuring that liquidity expansion is supported by accountability and verifiable transparency. The convergence of risk discipline and innovation has transformed how trust is established within decentralized finance ecosystems.
Industry Outlook
The current stabilization of Bitcoin’s price amid improving liquidity conditions signals a constructive shift in market structure. Macroeconomic indicators suggest a plateauing of monetary tightening cycles, which could enhance risk appetite and reinforce capital flows into digital assets. Crown Point Capital reviews that, in such an environment, liquidity depth acts as both a stabilizing force and a catalyst for re-accumulation phases. The resulting equilibrium reflects an increasingly rational market where data, analytics, and measured strategies dominate speculative impulses.
At a broader level, institutional adoption continues to redefine market participation. Hedge funds, asset managers, and fintech providers are increasingly treating Bitcoin exposure as a component of diversified strategies rather than as a standalone speculative position. Crown Point Capital reviews that this repositioning supports long-term structural integrity, reducing systemic vulnerability to sentiment-driven cycles. As analytics and automation mature, the integration of AI across liquidity networks will likely enhance predictive capacity and improve the efficiency of cross-exchange trading ecosystems.
From an industry perspective, Bitcoin’s resilience amidst evolving macroeconomic conditions reinforces its role as a benchmark for digital-asset market health. The expansion of liquidity across both centralized and decentralized platforms reflects confidence in operational reliability and long-term scalability. Crown Point Capital reviews this steady progression as indicative of a broader institutional shift toward disciplined market infrastructure, setting the stage for continued integration between decentralized technology and global finance.
Closing Statement
As market conditions evolve, platforms that emphasize transparency and innovation will be closely watched by traders and investors alike.
Trade ideas

Bitcoin Market Sentiment Turns Slightly Risk-OnIntroduction
Global Trustnet reviews the evolving tone of the cryptocurrency market as Bitcoin investors begin to exhibit a mildly risk-on attitude following months of caution. The gradual recovery in market sentiment reflects improving liquidity, stabilized macroeconomic conditions, and renewed technical strength across key digital assets. While global markets continue to navigate the balance between inflation control and capital market recovery, Bitcoin’s ability to sustain momentum above major support zones signals growing confidence among both institutional and retail participants.
The risk-on shift does not imply speculative exuberance but rather an emerging equilibrium between volatility and valuation. Global Trustnet reviews that participants are responding to subtle cues in market structure—such as reduced liquidations, narrowing spreads, and positive funding rates—that suggest improved conviction. As major exchanges report moderate increases in trading activity, Bitcoin’s role as a bellwether for overall digital-asset sentiment is once again under focus. The cryptocurrency’s resilience amidst shifting macro backdrops underscores its maturing identity as both a speculative and strategic asset.
Technology & Innovation
Technological evolution remains central to Bitcoin’s enduring relevance within a rapidly transforming financial ecosystem. The integration of AI-powered analytics, blockchain data processing, and predictive trading algorithms continues to redefine how traders interpret market conditions. Global Trustnet reviews how these algorithmic models increasingly incorporate behavioral data, real-time transaction analysis, and liquidity-mapping tools to assess directional momentum. The capacity to identify micro-patterns in volatility has enhanced short-term trading accuracy and provided valuable insight into market psychology.
Furthermore, innovation in decentralized analytics platforms now enables data transparency that was previously limited to institutional trading environments. Global Trustnet reviews that blockchain-based oracles and smart-contract-driven risk models are being used to track capital flows, derivative exposures, and sentiment dispersion across multiple exchanges. These technologies allow for the rapid identification of structural imbalances, providing traders with a more comprehensive picture of liquidity health. The increasing precision of such systems reflects an ecosystem that prioritizes informed decision-making over speculative reaction.
AI models have also improved predictive capabilities through multi-factor correlation analysis, linking Bitcoin price movements to broader macroeconomic variables such as Treasury yields and inflation indices. Global Trustnet reviews that these integrations form the foundation of algorithmic resilience—bridging traditional financial analytics with decentralized data structures. As innovation continues, the boundaries between conventional trading logic and digital-asset intelligence are becoming increasingly seamless, enabling deeper insights and more stable execution frameworks across crypto markets.
Growth & Adoption
The shift toward a slightly risk-on environment coincides with a renewed wave of participation across global exchanges. Institutional desks, once largely sidelined amid regulatory ambiguity, have started reallocating marginal capital to Bitcoin exposure as risk sentiment improves. Retail interest, though moderated compared to previous cycles, remains consistent, reflecting a more mature and long-term approach to portfolio construction. Global Trustnet reviews that aggregate open interest in futures and options markets has risen steadily, signaling stronger hedging activity and renewed directional conviction.
Simultaneously, the ecosystem’s infrastructural growth is accelerating. Custody providers, analytics firms, and compliance-driven platforms are expanding capabilities to accommodate institutional requirements. Global Trustnet reviews that this layer of professionalization ensures sustained inflows, as participants gain confidence in the operational soundness of crypto infrastructure. Exchange-traded products and fund-based vehicles are gradually broadening investor access, linking traditional finance with decentralized market mechanisms.
Adoption is no longer limited to speculative trading; it now encompasses strategic asset allocation, remittance systems, and digital-asset custody solutions. Bitcoin’s integration into payment platforms and fintech ecosystems illustrates its transformation from a niche investment into a recognized financial instrument. Global Trustnet reviews that this broader adoption base contributes to market stability, reducing the amplitude of volatility and promoting sustained liquidity. The resulting structure is one defined less by speculative cycles and more by progressive capital participation supported by technological innovation.
Transparency & Risk Management
In an environment defined by technological complexity and evolving regulatory scrutiny, transparency and risk management have become non-negotiable components of sustainable growth. Global Trustnet reviews that modern trading frameworks now emphasize real-time auditability, counterparty disclosure, and on-chain proof-of-reserves as standard expectations. These practices, driven by both investor demand and institutional mandates, form the backbone of market credibility.
Platforms leveraging smart-contract automation and AI-based surveillance are redefining the way risks are identified and mitigated. Global Trustnet reviews that anomaly detection algorithms are increasingly used to monitor price manipulations, sudden liquidity withdrawals, or irregular transaction spikes. This proactive approach transforms risk oversight from a reactive to a predictive process, aligning with best practices in traditional financial markets.
In parallel, regulatory engagement has advanced across major jurisdictions, promoting clearer compliance frameworks for custody, derivatives, and exchange operations. The resulting transparency has improved investor protection and enhanced cross-border participation. Global Trustnet reviews that this evolution mirrors the broader maturation of the asset class, underscoring a shift toward operational discipline, systemic resilience, and governance accountability. The balance between innovation and control continues to define the credibility of digital-asset platforms within a competitive landscape.
Industry Outlook
From a broader perspective, the digital-asset market is entering a phase of consolidation driven by measured optimism and disciplined growth. Macroeconomic indicators, including inflation moderation and stable policy guidance from central banks, have tempered uncertainty in traditional financial markets. Global Trustnet reviews that this environment fosters improved liquidity conditions and supports renewed demand for alternative stores of value such as Bitcoin.
The alignment between institutional adoption, regulatory progress, and technological development points to a sustainable foundation for long-term expansion. The industry’s ongoing integration with established financial infrastructure—through clearing systems, settlement networks, and digital-asset custodians—suggests a structural evolution rather than cyclical volatility. Global Trustnet reviews that these shifts are reshaping investor perception, transforming Bitcoin from a speculative phenomenon into a core component of diversified portfolios.
Furthermore, the rise of data-driven risk models and AI-enhanced execution systems continues to elevate operational efficiency. As digital markets gain analytical depth, their correlations with equities, commodities, and currency pairs are being studied with increasing precision. Global Trustnet reviews that this analytical convergence reflects Bitcoin’s progression toward an institutional-grade asset class, governed by quantitative frameworks rather than sentiment-driven volatility. The result is a market that increasingly mirrors the structural characteristics of traditional finance while retaining the flexibility of decentralized innovation.
Closing Statement
As market conditions evolve, platforms that emphasize transparency and innovation will be closely watched by traders and investors alike.
Btc bearish and continuation chart This is my btc bearish and continuation chart as it has always been accurate. This is purely based on TA

BTC Short1. BTC Critical Top & Self-Fulfilling Prophecy
The idea that $100K was a psychological magnet makes sense. Round numbers often act as strong resistance because traders set targets and stops around them.
If $125K was the realistic extension, that suggests we’ve hit or are near exhaustion in this cycle.
2. Tech Bubble & AI Overinflation
There’s evidence of capital recycling in AI stocks, especially with mega-cap tech driving indexes. This creates a feedback loop where valuations detach from fundamentals.
Historically, bubbles pop when liquidity tightens or growth expectations fail to materialize.
3. Recession & Unemployment
Leading indicators (like job openings and wage growth) have been softening. If unemployment ticks up, risk assets usually suffer because liquidity and sentiment deteriorate.
4. Trump Stimulus Doubts
A $2,000 stimulus would be a major liquidity injection, but given political gridlock and fiscal constraints, skepticism is warranted. If it doesn’t pass, that’s another bearish factor for risk assets.
5. BTC Short Thesis
“All roads lead to Rome” here means multiple macro headwinds converge:
Liquidity tightening
Tech bubble risk
Recession fears
Stimulus uncertainty
BTC often trades as a high-beta risk asset, so a macro downturn + bubble unwind could accelerate downside.

Bitcoin (BTC/USD) – 4H Bias OverviewCurrent price: around 104,657
Trend context: recent recovery after a downward move
Sell Zones
Sell Zone HTF (107,500–110,000): This area acts as near-term resistance. Price could face selling pressure here and may offer short entry opportunities if rejection candles appear.
A+ Level (122,500–125,000): This is a major resistance or higher-timeframe supply zone. It is a likely target for extended rallies but also a strong area for swing short setups if upward momentum weakens.
Support and Reaction Levels
Short-term support is around 98,700–100,000, which aligns with the recent low. The price is currently bouncing upward, potentially moving to retest the first sell zone.
Bias Summary
Short-term bias: bullish retracement as price moves up toward the sell zone.
Medium-term bias: bearish to neutral, watching for rejection near 107,500–110,000.
Confirmation: a clear rejection or bearish structure near the first sell zone could indicate continuation of the broader downtrend.

BTCUSD | Bearish Range | Daily — Market on Hold Ahead of CPIBTCUSD’s still in a bearish structure, bouncing between the two volume fractal pivots — 106463 and 100996. It’s hanging near the bottom of the daily range (116410 to 98892) with no clean push either way. Volume flow’s midrange around 108333, showing balance — no real momentum. With dollar strength and CPI data on deck this week, the market’s just soaking liquidity and waiting for the next macro trigger to hit.
Volume tells the truth before price does!
-core5dan

Bullish bounce off?Bitcoin has bounced off the pivot, which aligns with the 61.8% Fibonacci retracement level, and could rise toward the 1st resistance, a pullback resistance level.
Pivot: 102,390.83
1st Support: 100,660.86
1st Resistance: 104,944.61
Disclaimer:
The opinions given above constitute general market commentary and do not constitute the opinion or advice of IC Markets or any form of personal or investment advice.
Any opinions, news, research, analyses, prices, other information, or links to third-party sites contained on this website are provided on an "as-is" basis, are intended to be informative only, and are not advice, a recommendation, research, a record of our trading prices, an offer of, or solicitation for, a transaction in any financial instrument and thus should not be treated as such. The information provided does not involve any specific investment objectives, financial situation, or needs of any specific person who may receive it. Please be aware that past performance is not a reliable indicator of future performance and/or results. Past performance or forward-looking scenarios based upon the reasonable beliefs of the third-party provider are not a guarantee of future performance. Actual results may differ materially from those anticipated in forward-looking or past performance statements. IC Markets makes no representation or warranty and assumes no liability as to the accuracy or completeness of the information provided, nor any loss arising from any investment based on a recommendation, forecast, or any information supplied by any third party.

$BTCUSD: Wyckoff distribution or Wyckoff accumulation?On the daily chart, Jesse Olson posted a 1D Wyckoff Distribution chart of $BTC. However, his chart does not have an AR or ST.
On the 4-hr chart, an opposing Wyckoff Accumulation chart can form even prices can break above the support in the $103K-$105K zone.
How prices resolve in this zone will determine if Wyckoff Distribution or Wyckoff Accumulation is in progress.

Bitcoin Rebounds — channel breakout signals!Have a good day, Traders! It's Leo. Let's look at the current BTCUSDT chart
Valid Support Zone: 98,000 – 102,000 — Price has formed a clear double-bottom structure here.
Breakout confirmation: Price has broken above the descending channel and both EMA20/50.
Next resistance / target: 115,000 — previous supply area aligning with major liquidity.
→ Short-term structure favors a bullish continuation as long as support holds.
Despite short-term volatility, Bitcoin remains supported by improving risk sentiment as U.S. yields retreat and Fed officials hint at a potential policy pause.
Scenario: A successful retest of the breakout zone could trigger momentum toward the 115K resistance. Holding above 102K keeps the bullish structure intact.
Bulls seem to be regaining control — will this momentum extend toward 115K? What’s your outlook for BTC this week?

BTC/GOLD ratioI believe it will break to the upside.
This is the top, where gold will outperform bitcoin, but time frames matter. Price action could exist above it, i.e. the 3 month candle wicks above then closes below, confirming the double time, meanwhile allowing enough time for a bull run where bitcoin outperforms heavily - Let's see
Not financial advice.


Bitcoin Reverses off Previous Support Turned ResistanceBitcoin’s recent decline has brought price action back toward the crucial $100,000 psychological and horizontal support zone, an area that has held firm multiple times since May. The daily chart shows that price briefly dipped below this level but quickly recovered, forming a potential short-term base.
The 50-day SMA (blue) has turned lower and now sits above current price, suggesting weakening medium-term momentum, while the 200-day SMA (red) continues to act as dynamic support near $103,900. A sustained close below the latter could shift the broader structure toward a more prolonged consolidation phase.
From a momentum standpoint, the MACD remains below the signal line and in negative territory, reflecting persistent bearish pressure, although histogram bars are showing early signs of contraction. The RSI is currently near 38, hovering just above oversold conditions, indicating that sellers may be losing strength in the short term.
Overall, Bitcoin remains in a neutral-to-bearish phase, trading between $100,000 support and $107,300 resistance. A decisive breakout beyond either boundary could define the next directional move.
-MW

#Bitcoin in Buy mode in this support level 12NOV25 _#buy@low #sell@high Simple trading strategy support & resistance
The past few days, I have been posting that #BTC is at a good support level to enter the market. If you go back to my past posts and videos, you can see the support level I am more interested in entering the market at.
#BTC #forex #supportortandresistance #tradinging #swingtradingstrategies #buy #sellll #EURUSD #goldd #niftyy #s&p #etf #qqq #iwm #future #options #longterm
#btc #forex #etf #option #money #earning #dollars #bitcoin,#btc,#spy,#forex,#bitcoin,#supportlevel,#RESISTANCELEVEL,#TESLA,#S&P500,#NVDIA,#APPLE,#AMAZON,#NIFTY,#META,#RSI,#STOCKMARKET,#SHAREMARKET,#GOLD,#OIL,#SILVER,#INTRADAY,#SWINGTRADE,#LONGTERM,#INVESTMENT,#SELL,#BUY,#BID,#ASK,#MARKET,#INVESTORS,#IWM,#OPTION,#FUTURES,#US,#ALIBABA,#CASH,#CASHFLOW

Bitcoin Cooked if RSI makes a lower LowGood Days Folks,
Over the past weeks Bitcoin has been ranging from 100K-116K, however if we lose this range we can confirm the bearish pattern on the RSI something that mark the 2021 top.
I strongly suggest everyone take a rest from trading and wait to see what happen here but this is not financial advise just what I am doing now.

Sell Setup – BTC/USD (1D)Sell Setup – BTC/USD (1D)
Price is currently retracing upward after forming a lower high. The plan anticipates a potential sweep of short-term liquidity resting above the recent high (marked X) before a continuation lower.
Premium Zone (Red Area): Expected area where price could deliver into before bearish continuation.
Monthly FVG (Blue Zone): Acts as an intermediate draw on liquidity and potential first target area.
2025 Open Price: Serves as a key magnet level, aligning with the draw on liquidity below.
Liquidity Pool (Orange Zone): Final downside objective, where price may rebalance and collect long-term liquidity.
Narrative:
After the short-term retracement into the premium zone, watch for signs of rejection (e.g., bearish FVG formation or a break of structure). Once confirmed, anticipate a continuation toward the monthly imbalance and below the yearly open price.

BTC = hourly chartPrice has left the Daily box in red and is now in weekly box territory in grey.
Trend reversed and price is accumulation on lower timeframes. I added some hourly levels and a 15min level. I also extended some old but, irrelevant levels so if and when they become relevant, the level is there to see in the replay better.
T.A explained -
BackSide (BS)
FrontSide (FS)
Inverse BS (Inv.BS)
Inverse FS (Inv.FS)
BS & FS levels are expected support when dashed lines, tested when dotted and resistance when solid lines.
The inverse is true for the Inv. BS Inv. FS levels, they are resistance as dashed lines, tested as dotted and support as solid lines.
Monthly timeframe is color pink
weekly grey
daily is red
4hr is orange
1hr is yellow
15min is blue
5min is green if they are shown.
strength favors the higher timeframe.
2x dotted levels are origin levels where trends have or will originate. When trends break, price will target the origin of the trend. its math, when the trend breaks, the vertex breaks too so the higher timeframe level/trend that breaks, the more volatility there could be as strength in the orders flow in to fuel the move.
yesterday
Trade closed manually
price followed the candle science and timeframes from the 5min green levels to the weekly grey level. Price has left behind some inverse frontside and inverse backside candles which look to be forming the bridge to flip the script if price manages to gain those levels and start accumulation. That liquidity will "unlock" and fuel price action.

BITCOIN WYCKOFF accumulationscenariocast!
IF that is what is occuring ... the #BTC price over the next few months could follow something similar to what I have drawn in a #Wyckoff re-accumulation range and breakout.
With the recent price action being a false breakdown before recapturing the range and proceeding to reach previous levels of resistance.
Let's see if this occurs, sentiment reached rock bottom last week.
SO I would not be surprised!

Bitcoin #BTC The key level to launch the Bull market...is $34500
The 50% drawdown level from the previous cycle laugh
let see if it can repeat the 3rd time
We assume this is going to happen leading up and post #halvening
But open to a quickening of this timeline because #ETF news driving the hype even quicker

Long Strategy GuideReconstruction of the macro monetary environment provides support
The US dollar index has dropped below the 100 mark. The US debt/GDP ratio exceeding 130% has weakened the creditworthiness of the US dollar, providing valuation support for risky assets. Although expectations for the Fed's rate cut in December have fluctuated, the trend of implicit liquidity easing has not changed, reducing the opportunity cost of holding Bitcoin. At the same time, the global central bank gold-buying trend highlights the need for hedging, and the high correlation of Bitcoin with the Nasdaq index of 0.8 will benefit from the return of funds from the technology sector simultaneously.
Bitcoin trading strategy
buy:105000-105500
tp:106500-107500
sl:104000

BTC and Macro Environment · Optimism Creeps Back InThe macro environment is warming up again. Traders are slowly adding risk as Bitcoin BITSTAMP:BTCUSD holds above $100K and Ethereum COINBASE:ETHUSD shows rising retail activity. Altcoins are regaining liquidity, and sentiment feels like cautious optimism.
What’s driving this shift? Money.
Talk of new stimulus checks and potential rate cuts are fueling bullish expectations. The idea is simple: more liquidity means stronger risk appetite. But this comes with a catch. Fiscal math doesn’t add up cleanly. With tariffs bringing in $224.7B and proposed stimulus near $400B, inflation fears could return fast if spending isn’t balanced.
The U.S. government’s reopening adds another layer. Once the Treasury starts releasing the $1 trillion parked in its account, liquidity will flow again into agencies and contractors. This real injection supports a bullish tone across markets, including crypto.
On the chart above, Bitcoin’s 50-week simple moving average (50W SMA) is the key signal. BTC closing above it suggests the long-term uptrend remains intact. Historically, this level marks early bullish phases, not tops. If it holds, traders may stay long but cautious, watching for shifts in Fed tone or inflation data.
Overall, the crypto market is showing signs of recovery. Liquidity is improving, technicals look stable, and optimism is back, but not overheated. It’s not 2021 euphoria, just steady confidence built on real macro shifts.
Stay focused, manage risk, and don’t rush. The setup looks bullish for now, but caution still pays.
TheCryptoFire

BTCCRYPTOCAP:BTC has reclaimed the major support level, confirming strength and continuation of the uptrend. As long as that support holds, the structure remains bullish, and price should keep trending upward toward the next resistance levels.

ETHUSD H1 | Bearish Drop OffMomentum: Bearish
Price has rejected the sell entry level, which aligns with the 38.2% Fibonacci retracement.
Sell Entry: 106,514.04
Strong pullback resistance
61.8% Fibonacci retracement
Stop Loss: 108,576.28
Pullback resistance
78.6% Fibonacci retracement
Take Profit: 102,418.60
Pullback support
61.8% Fibonacci retracement
Stratos Markets Limited (tradu.com ):
CFDs are complex instruments and come with a high risk of losing money rapidly due to leverage. 68% of retail investor accounts lose money when trading CFDs with this provider. You should consider whether you understand how CFDs work and whether you can afford to take the high risk of losing your money.
Stratos Europe Ltd (tradu.com ):
CFDs are complex instruments and come with a high risk of losing money rapidly due to leverage. 70% of retail investor accounts lose money when trading CFDs with this provider. You should consider whether you understand how CFDs work and whether you can afford to take the high risk of losing your money.

BTCUSD UPDATE Yesterday, BTCUSD hovered near 106,463, staying quiet most of the day.
This morning, the Euro session broke that balance — ran yesterday’s high, triggered stops, and dropped fast. ETF inflows that pushed price earlier in the week slowed down.
Funding turned negative, showing traders are less confident short term.
Now price trades lower, and yesterday’s low is the next level everyone’s watching.
Macro Outlook
Markets are leaning defensive.
Yields up. Dollar steady. Stocks soft.
Bitcoin’s moving with that tone as flows cool off and liquidity thins out.
Until that changes, BTCUSD stays under pressure with weak momentum and cautious buyers.
Market Structure Mapping (MSM — The Framework)
Structure still leans bearish, but there’s no confirmed break yet.
Price is trading away from the last discount pullback, holding below the Euro session high.
Downside focus sits near 104,240, then 101,500, where equal lows and liquidity line up.
If yesterday’s low breaks clean, the bearish leg extends.
For now, price is drifting lower — not broken, just soft.
CORE5 Rule — “Trade what’s confirmed, not what you think.”
— CORE5DAN
Institutional Logic. Modern Technology. Real Freedom.
