Broadening Pattern as a Top Reversal on BTCI believe downside movement is not done yet. Broadening pattern is forming and it will shake first bulls and then bears. Top is around 150k.
Trade ideas


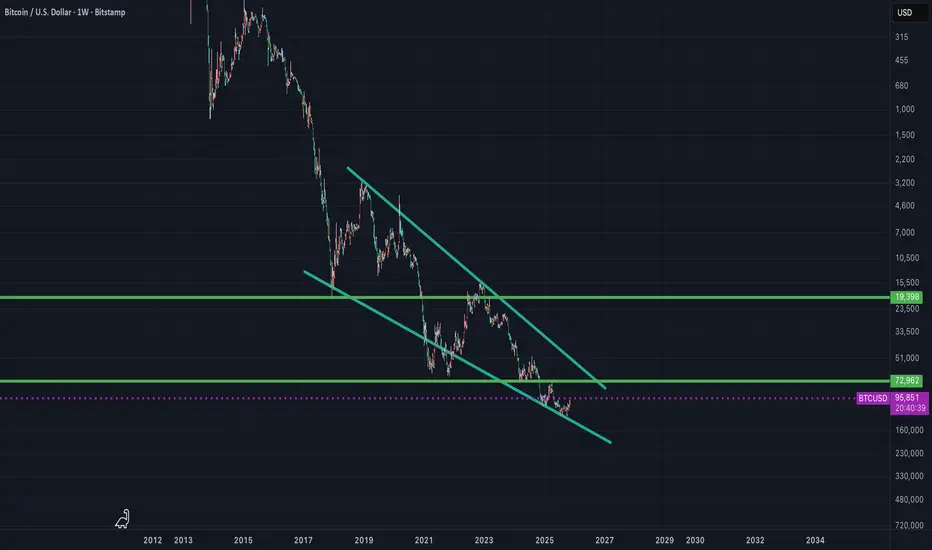
BTC Long-Term Support and ResistancesHere is what I envision the next few months for Bitcoin. Continue retracing then another move up. Our worst case scenario would be around 60k. Seems like a really solid spot for a rally.

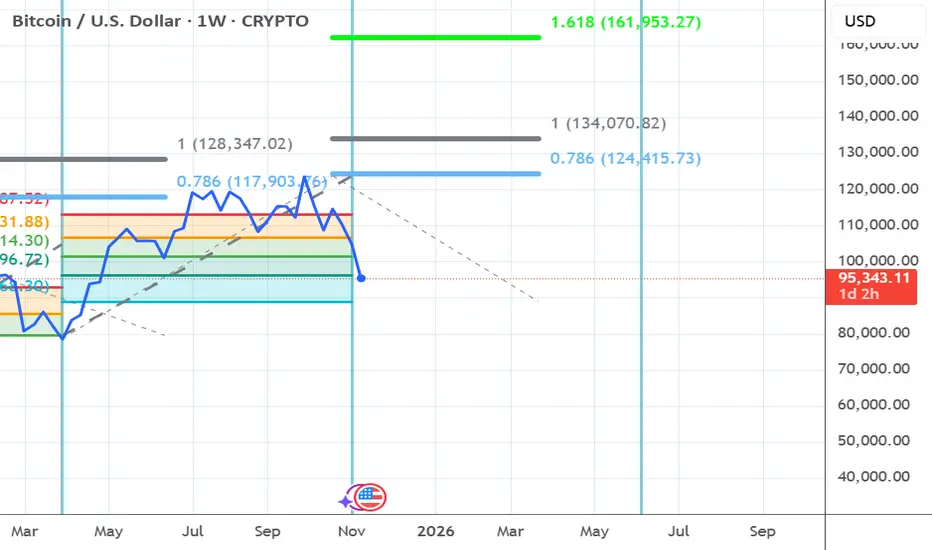
BTCUSD 4HR CHART FIBONACCI BTC/USD 4H — Price currently hovering around 95,862, testing key Fib zone. Watching for reaction at the 61.8% retracement level. If bulls hold this level, potential move toward 100K zone aligns with previous impulse leg. Bearish rejection here could retest 94K support. Volume and structure will confirm bias.

Bitcoin mega bullish Inverted chartFalling wedge on the inverted chart. Likely to come back and into the 60 range. Bulls will derisk under 100k and bring us to normalcy. This is completely ok and fine and healthy. But overall, dca into real crypto. Monero, Bitcoin, Ada even looks like a buy at the 25 cent level. There are only a handful of crypto and I think privacy is going to branch off into its own things.
Monero is the only true Crypto.
$BTC: UNDER SERIOUS STRESS Who would have thought that at the end of September, when Bitcoin ( CRYPTOCAP:BTC ) was working towards achieving a new all-time high (ATH), while it was showing a negative divergence in the Relative Strength Index (RSI), it would have lost 25% of its value by today?
The reality is that CRYPTOCAP:BTC formed a Double Top pattern with a target price of $88,910. Currently, it is struggling to maintain the 0.618 Fibonacci retracement level, having fallen below the trend line that has connected the higher lows since the beginning of August. In the daily time frame, the 200-day SMA is at 110,518, crossing from above the 50-day SMA
CRYPTOCAP:BTC is becoming oversold, which makes a bounce likely, but until proven otherwise, the trend is bearish

Triple Resonance Lays a Solid Foundation for Upside Core Logic for Going Long: Triple Resonance Lays a Solid Foundation for Upside
1. Institutional Trends: Strong Low-Level Absorption, Clear Capital Layout Signals
Despite short-term profit-taking in the market, institutional capital continues to flow in at low levels. According to CoinDesk data, large institutional buy orders emerged in the $94,000 support zone, with OTC market trading volume reaching $18.6 billion in 24 hours—surging 42% from the recent average. Institutions like JPMorgan and Galaxy Digital absorbed selling pressure through the OTC market. Meanwhile, the outflow trend of ETF funds has slowed, with net outflows narrowing to $120 million in the past 3 days—a stark contrast to the previous daily outflows of $500 million—reflecting institutions’ "buying on dips" behavior. Historical data confirms that concentrated institutional absorption at the Fibonacci 0.618 retracement level (corresponding to $94,200) leads to an 83% probability of growth in the subsequent month.
2. Fundamentals: Solid Hash Rate Support, Uncompromised Network Security
Mining fundamentals continue to improve, providing underlying support for prices. Bitcoin’s hash rate momentum indicator remains in positive territory and continues to rise, with the current hash rate stable above 370 EH/s. There has been no "miner capitulation selling" typically seen during sharp declines. Miners’ balances remain stable, with a 30-day net selling volume of only 0.8%—far below the 5% average during bear markets—indicating high miner recognition of current prices. Network security and consensus foundations have not been affected by the correction. The divergence between hash rate and price signals potential for subsequent price catch-up.
3. Technicals & Sentiment: Resonance of Supports + Sentiment Bottoming, Rebound Conditions Mature
Technically, multiple supports form a resonance. $95,600 lies between the $94,200 Fibonacci 0.618 support and the short-term key support at $95,543—a zone whose effectiveness was verified during the Q4 2024 rally. On the daily chart, MACD green bars continue to shorten, with bearish momentum gradually fading. The RSI indicator has rebounded from the oversold zone to 41, signaling the end of short-term adjustments. In terms of market sentiment, the Fear & Greed Index has dropped to a low of 28, leaving ample room for sentiment recovery. Trading volume has shrunk from 27,579 BTC during the previous volume-driven decline to a current low of 165 BTC, indicating phased exhaustion of selling pressure and distinct characteristics of consolidation and bottoming.
4. Macroeconomic Environment: Policy Expectation Game, Limited Downside Room
Uncertainty surrounding Fed policy persists, but the market has fully priced in hawkish expectations. The economic recession risks and affordability crisis mentioned by New York Fed President Williams provide potential support for a December rate cut. While market pricing for rate cuts fluctuates, there is limited room for further downside. After the end of the U.S. government shutdown, sentiment toward risk assets has improved. As a high-elasticity risk asset, Bitcoin is expected to benefit from expectations of liquidity easing and rally in resonance with U.S. stocks and commodities.
Bitcoin trading strategy
buy:95000-96000
tp:97000-98000
sl:93500

BTC downtrend continuationWe have watched this pair drop all week. Here's my setup for a bearish continuation. For a 1:5 solid risk-reward

Bitcoin Price Prediction from the Perspective of a Blind and Dea"Everything is clear. Throw unfounded claims and rumors in the trash."
Bitcoin long term - Don't be madTULIPS
Not financial advice.
CDBCs will kill crypto
It's not the future.
I will buy Bitcoin at 2 USD
Not financial advice.

$BTC BTC NEXT UP LEG NEAR 143000.
IF BTC close this week blow 94500 we can see the slip blow 90k towards 87k

BTCUSD UpdateBlimmin' OANDA threw me off, didn't realise it didn't track weekend price action
BTC at support, ready to rally from here - Not sure whether it will aim for the blue upper rail (Completes the bear penant) or green upper rail (Completes the bear flag)
I am under the impression the green bear flag will have a false break to the upside to touch the blue upper band, as when this occurs and it breaks back in, we have a severely bearish scenario scenario ready to slam dunk bitcoin (although it would of heavily slam dunked form the blue upper rail by the time it gets there anyway!)
Basically
Bull run is still game on, just need to figure out when the end goal is. To me, the blue top rail makes the most sense
Not financial advice

BTCUSD | Sign of Hope for The BullsHey Traders,
Trend: Primary Bearish
Weekly: 🔴
Daily: 🔴
H4: 🔴
Phase: Expansion, bearish target zone.
Bullish case: H4 Close > 96,730.95 | → 98,629.96 → 100,350.26 (correction)
Bearish case: H1 Close < 95,096.01 | → 93,363.28 ... (but the market has reached several target levels)
Stay focused, stay disciplined!
Peter

$BTC - Still More Downside to Come for Bitcoin?Institution's are buying, Saylor isn't selling, but technical analysis shows something different.
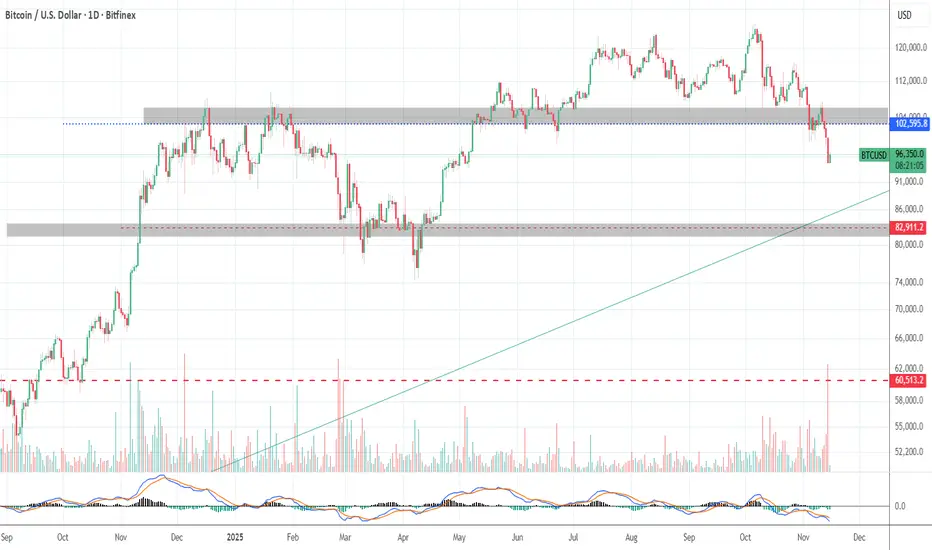
Bitcoin remains within a long-term ascending parallel channel that began in late 2022. The structure suggests that BTC has been respecting this bullish channel, but it’s currently testing a key mid-channel support which is a critical make-or-break zone for the next 60–90 days.
Fibonacci support sits at $97,500 (0.236) which is a key pivot. A sustained break below could drive BTC toward the $80,000–$85,000 zone (0.382 Fib), where strong structural and volume support lies. The MACD has turned bearish, momentum is fading, and the RSI is trending lower but not yet oversold, suggesting further downside room.
Volume analysis shows a high concentration of buying interest between $60k–$70k, implying that any deep correction into that range would likely attract strong accumulation. Stochastic and WaveTrend indicators also confirm short-term bearish momentum that could last several weeks before a rebound.
Where are we heading:
Base case : BTC consolidates between $80k–$95k over the next 60–90 days before resuming its uptrend toward $120k–$130k in 2026.
Bullish scenario : A sharp bounce above $100k–$105k could reignite momentum toward new highs.
Bearish scenario : A break below $79k opens risk to $65k.
Outlook: Short-term corrective, long-term bullish. The next two months likely bring consolidation and shakeouts before Bitcoin’s next major leg higher.
Disclaimer:
I do not provide personal investment advice and I am not a qualified licensed investment advisor. I am an amateur investor.
All information found here, including any ideas, opinions, views, predictions, forecasts, commentaries, suggestions, or stock picks, expressed or implied herein, are for informational, entertainment or educational purposes only and should not be construed as personal investment advice. While the information provided is believed to be accurate, it may include errors or inaccuracies. I will not and cannot be held liable for any actions you take as a result of anything you read here.
Conduct your own due diligence, or consult a licensed financial advisor or broker before making any and all investment decisions. Any investments, trades, speculations, or decisions made on the basis of any information found on here, expressed or implied herein, are committed at your own risk, financial or otherwise.
Feel free to give us a follow and shoot us a like for more analysis updates.

What’s the Difference Between DCA, Pyramiding, and Adding to a WIn trading, people often mix up three completely different ways of adding to a position.
They may look similar on a chart, but the logic, risk, and results are absolutely different.
Let’s break it down in simple terms.
1️⃣ DCA (Dollar Cost Averaging)
An investing strategy — not a trading strategy.
Essence: buying with equal amounts regardless of where the price is going.
The goal is to smooth your average price over the long term.
Features:
additions are fixed-size;
often used when the price is falling, to improve the average;
no signals or confirmations required;
not designed for short-term trading.
👉 Conclusion:
DCA = mechanical averaging.
Works for long-term accumulation, not active trading.
2️⃣ Pyramiding
A professional trading technique.
Essence: add to a position only when the market moves in your favor
and only after new trend confirmations — breakouts, retests, patterns.
Features:
each addition is smaller than the previous one;
the average entry worsens very little (or almost not at all);
risk increases smoothly and controllably;
used only in strong trends.
👉 Conclusion:
Pyramiding = building the position from the top down, letting the market prove its strength.
It’s a professional-level risk management technique.
3️⃣ Adding to a Winning Position in Equal Parts
The most common approach among active traders.
Essence: the position is increased with equal-sized additions
(for example: 1x → 1x → 1x) as the price moves in your favor.
Features:
each addition has the same size;
the average price worsens more than with pyramiding;
risk rises faster;
effective in trends but prone to overloading the position if the trend breaks suddenly.
👉 Conclusion:
This is something between DCA and pyramiding.
It works, but requires caution to avoid pushing the average too high.
What’s Important to Understand?
DCA is not trading — it’s a long-term accumulation tool.
Pyramiding is about risk management and market structure.
Equal-size additions in profit are viable but riskier than they look, because the average climbs quickly.
In trading, there is no “perfect” strategy — only the one that fits your style, risk tolerance, and holding timeframe.
But understanding the difference matters, so you don’t confuse three fundamentally different approaches.
understanding how technical workson btc move and learning, we firstly need to view back starting from the week 1 timeframe down to D1 H4 H1 M30 M15 and M5 to understand how the chart move and view. without understanding the past candle knowing the current market wont be easy because the current and past works together so we focus firstly on both, then by checking the move its show to determine what the next movement will give.

Btc? till year endwww.tradingview.com
Under pressure?
Sharks ready to react when they smell blood.
No amount $ can support.
www.tradingview.com
Kiyosaki don't use leverage but brother Saylor does.
Force liquidation will trigger ripple effects.
Chartwise, showed hand 3 days ago, whn it broke low.
Don't be sentimental, when price is wrong.
1st to cut are the borrowings, next assets under hodl.
Imagine in tandem, scary 10k volatility gonna be norm.
Be safe guys & reasonable.
All the best
Not a guru

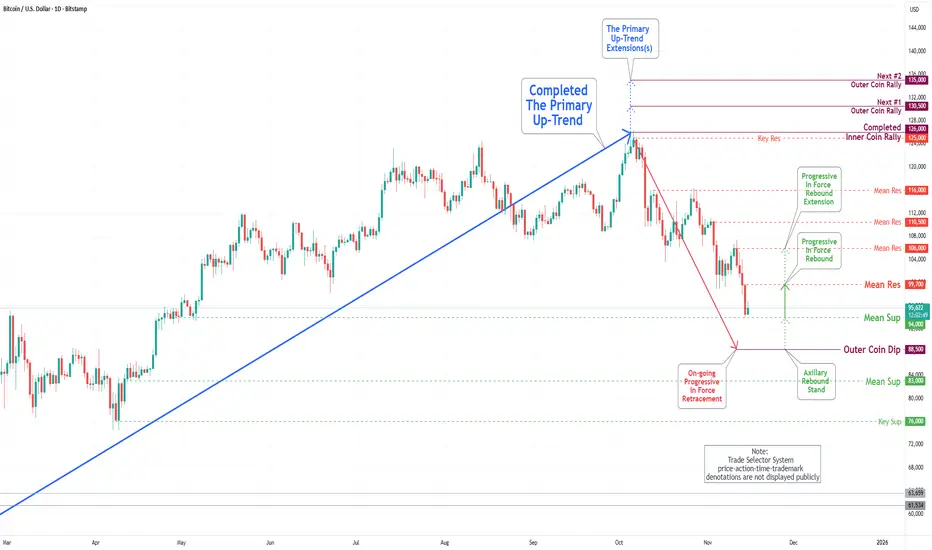
Bitcoin(BTC/USD) Daily Chart Analysis For Week of Nov 14, 2025Technical Analysis and Outlook:
In the most recent trading session, the Bitcoin market has undergone a significant drawdown over the past week, reaching the Mean Support level of 99,000. Additionally, it has completed the Outer Coin Dip at 97,000. Compounding these challenges, the price has also declined to the Key Support level of 94,000, where trading activity is currently concentrated.
At this time, the price is being maintained within a trading range defined by the Mean Resistance at 99,700 and the Mean Support (Former Key Support) at 94,000, with a slight probability of an extension to the Mean Support level at 106,000. Nonetheless, it is crucial to acknowledge the considerable potential for pullbacks at these critical resistance levels.
Bearish at HTF!This is my bearish idea for BTC at the moment! If money gets distributed again by stimulus checks in the US economy; this is null & void.

BTC/USDT THIS IS MY PLAN FOR BITCOIN!!!Bitcoin has been pretty weak in recent weeks.
However, we should have some targets.
Target number 1 by Sunday if the market closes above 50 EM the market will be pretty good and I won't be so bearish.
However, if the candle closes below EM, i.e. below $100,000, then I will expect it to hit the $87,700 levels.
The market needs attention.

BTC 1D Update: Stop shorting! The bear market not started yet.Bitcoin has retraced from its recent highs, but this is a healthy correction, not the start of a bear market yet. The price is currently testing a critical area of support.
We are now sitting right on the 61.8% Fibonacci retracement level of the previous major bullish wave. At the same time we are printing a HL on the daily timeframe. Hence, our daily bullish structure is still not broken yet.
A strong bounce off this $90,000 - 61.8% confirms that the recent downturn was simply a correction.
A sustained break and close below $90,000 would invalidate this bullish bias, potentially confirming the start of a true bear market phase.
Shorting Is Dangerous Here
The current price action is highly volatile, but the technical probability favors a bounce from this key level. Its like catching falling knives at this point.
My Bias: BULLISH above $90,000. Wait for confirmation of a strong close above current resistance before entering Long, or look for Long entries near the $90K mark with a tight stop.
Good Luck!

Bitcoin Outlook: Major Correction Zone Aligned With the 100-Week✅ BTC Chart Analysis + 100 EMA Weekly
1. 100 EMA Weekly as Dynamic Support
The 100-week EMA is currently around:
≈ $85,494
This is important because:
- Since the start of the 2023–2025 bull run, BTC has always bounced from the 100 EMA during deeper corrections.
- In the 2017 and 2020–2021 cycles, the 100 EMA also acted as a bull-cycle support line.
Meaning:
🔥 The 100 EMA area = Strong deep correction support
---
🔰 2. The 100 EMA aligns with your demand zone (Confluence Support)
Your previous demand zone:
$90,000 – $92,000
Now combined with the EMA below it:
📌 It creates a 2-layer support:
- Supply–Demand Zone (yellow box)
- 100 EMA Weekly (≈$85.5K)
📌 This is called:
Strong Confluence Zone
→ a common place where BTC forms major reversals during bull cycles.
---
🟢 3. Bullish Scenario (Now Higher Probability)
Because the EMA + demand zone overlap, the bullish path becomes stronger:
✔ BTC dips into the demand zone
✔ Wick can reach down to the 100 EMA (~$85K)
✔ Then bounces back toward:
- $100K – $105K
- $118K
- and possibly $130K+ (channel top)
The 100 EMA is usually the reversal point before the next big rally.
---
🔴 4. Bearish Scenario (Only if 100 EMA Breaks)
The bearish scenario activates only if:
❌ BTC closes the weekly candle below $85K
= the 100 EMA breaks.
If this happens:
- BTC exits the bullish structure
- Enters a bearish leg
- Drops toward $55K–$60K (lower channel)
- And the extreme targets at $28K – $19K become realistic
But as long as the 100 EMA holds, the major trend remains bullish.

INTRADAY TRADING LEVELS FOR BTCUSD INTRADAY TRADING LEVELS FOR BTCUSD. Anyone can trade on both sides.
