BTC Ending Diagonal to Finish Off the Cycle?Most people seem to think that either the cycle has already topped or that BTC is going towards 170K+ in a blowoff top. But what if we are just starting wave 5 of an eding diagonal that tops out around $135K? That would wreck the bears first, then trap the bulls expecting a blowoff top. And it could also allow for an alt season, although it may not be as strong as past cycles. What do you think?
Trade ideas

BTC/USD - Market Structure & Price Action Setup (4H)Currently, Bitcoin is trading within a clear downtrend, forming Lower Highs (LH) and Lower Lows (LL). Price is consolidating around a key support zone after rejecting from the recent supply area.
Two potential scenarios:
✅ Bullish case: If price breaks above the minor lower high and reclaims the 106K–108K resistance zone, we could see continuation toward the major supply zone near 115K–116K, forming a possible structure shift.
❌ Bearish case: If price rejects from the current zone and fails to break structure, a continuation to the downside is likely, targeting the next major demand area around 94K–95K aligned with the descending trendline.
Bias: Neutral until structure confirms a breakout.
Focus: Watch for reaction and candle confirmation around key structure levels.

BTCUSD - Bearish Breakout 4HThe market is in a downtrend, and we are waiting for an entry signal to go SHORT below the 98749.77 support level. Only the upward break of 104685.24 would cancel the bearish scenario.

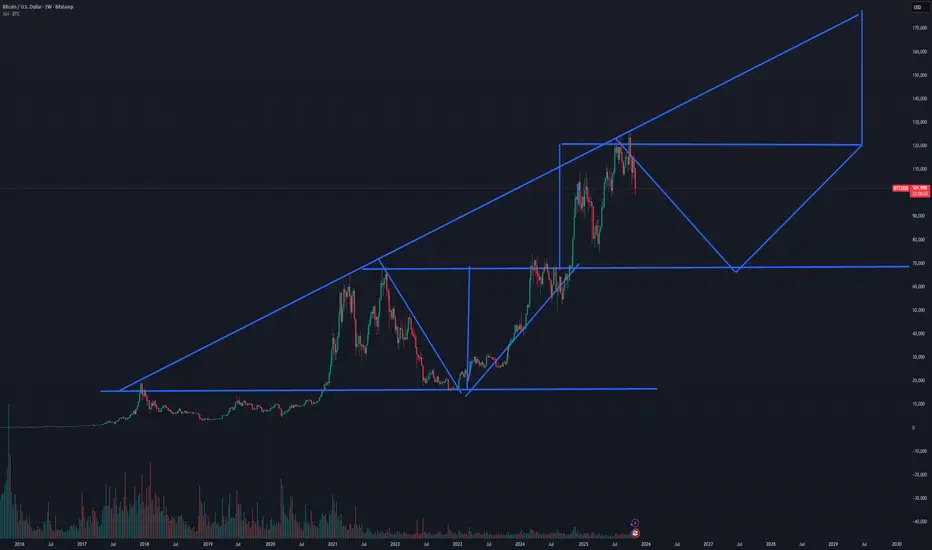
Bitcoin Macro Structure – Next Cycle Projection to $180K (Fract)This chart proposes a new Bitcoin macrostructure model, suggesting that the current cycle will not follow the traditional 4-year halving rhythm.
Instead, the geometry of the chart and the expanding time structure point toward a 6-7 year supercycle — a longer accumulation and expansion phase that may redefine Bitcoin’s historical rhythm.
The price action continues to respect the long-term ascending trendline since 2017, forming broader impulses and corrections with each cycle.
Targets remain at $130K, $150K, and up to $180K, where the top of this extended structure might complete.
After that, a multi-year correction could bring BTC back to the $70K–$80K range before the next long accumulation.
This projection suggests that Bitcoin’s volatility and growth waves are stretching over time, creating a slower but larger-scale cycle compared to the previous ones.
It’s a macro perspective, not financial advice — intended to illustrate how Bitcoin might evolve as the market matures.
$BTC/USD looking for this bullish harmonic to finishBITSTAMP:BTCUSD : Bitcoin is close to the trendline touch. It would also correspond to NASDAQ:MSTR completing an ABC flat correction.
If the BTC bull market is to continue, this trendline needs to hold. The Elliot Wave count would be having completed Waves i, ii of Wave IV, completed wave (i) of Wave iii of Wave V and we're in wave (ii) correction of Wave iii of Wave V.
Wave (ii) have retraced 50% of Wave (i), which is pretty standard. It is an expanded flat.
Things do line up and I expect BTC to bounce from the trendline. And NASDAQ:MSTR may also have bottomed from sub $230 spiking down.

Long Bitcoin take profits just above ATHQuick video analysis with tutorial of the fake break of the head and shoulders top. Nice tight stop just below $100k on entry last Friday at $101k

$BTC Possible Top & Possible ManipulationCRYPTOCAP:BTC Possible Top & Possible Manipulation
This upside movement can be a manipulation part and then distribution.
we need confirmation for this scenario!

BTCUSD | Liquidity void toward institutional zone (65k)Bitcoin has been showing extremely high volume around the previous high at 109,308, which has been rejected so far. A potential retest followed by a deeper pullback remains likely.
Volume analysis suggests the current leg up is liquidity-driven rather than supported by active participation, leaving a significant liquidity gap below.
The last leg up appears liquidity-driven rather than supported by active participation, leaving a significant liquidity void extending toward the major high-volume concentration near 65,730, where multiple confluences - including institutional positioning, EMA200 (1W), and EMA50 (1M) align. This remains the primary rebalancing zone should the market continue to unwind.
However, if 111,140 holds as near-term support, potential upside targets stand at 123,275, 135,220, and 147,345, representing progressive re-entries into prior distribution zones. Sustained acceptance above 111,140 could shift near-term sentiment toward bullish structure rather than continuation of distribution.
This is not a buy or sell signal. These observations are for market-study purposes only and should not be interpreted as trade instructions.
⚠️ Risk Note:
It is recommended not to overleverage your positions. Overexposure is the main killer of portfolios. Position sizing directly impacts mental clarity: excessive size can cloud judgment and trigger emotional reactions, while appropriate sizing supports composure and disciplined execution. It is better to collect steady breadcrumbs than to risk giving away your capital.
Trading risk can be managed but never eliminated.
❗Disclaimer:
This content is provided for educational purposes only. It does not constitute financial, legal, tax, or investment advice. The author does not provide trading signals, portfolio management, or any services regulated by the Financial Conduct Authority.

BTC: Careful out there.Bitcoin has lost it's momentum, also evident in GOLD/BTCUSD graph (meaning, gold has stole the show from btc). Lower Lows in this graph would mean bear market or a deeper correction Imo.
Other bad sign is SOXX/SPX lower highs, underperforming. Could be a sign for market top but lets see.

Bitcoin at Key Backrest levelBitcoin backtesting the key 🔑 level it broke though yesterday before bouncing back higher. This is an important backtest and a close below here implies further weakness in the crypto area.
btc crash is about to happenbtc is doing the same topping as in 2021-22 the bull rally is over and the top was in September will now see a slow grind and or free fall .looking bearish with huge negative reversal on the monthly RSI. this chart looks ugly!we should see btc forming a banana top so if price goes to higher highs this will in validate but the probability is the bull market is over.look for a 40-50% pullback.

Four-dimensional perspective reconfigures upward support1.Macroeconomic Environment: Rate Cut Expectation Pullback Doesn’t Alter Dovish FundamentalsWhile the probability of a Fed rate cut in December has fallen from 90% to 68%, the implicit easing trend remains unbroken. The sell-off in risk assets triggered by the short-term strength of the US dollar index has entered its final phase. Bitcoin’s correlation with gold has dropped to a historical low of -0.54, highlighting asset independence as it no longer fluctuates solely with traditional safe-haven assets. Current valuations have pulled back over 20% from historical highs, and the enhanced attractiveness after bubble squeezing creates conditions for capital inflows.
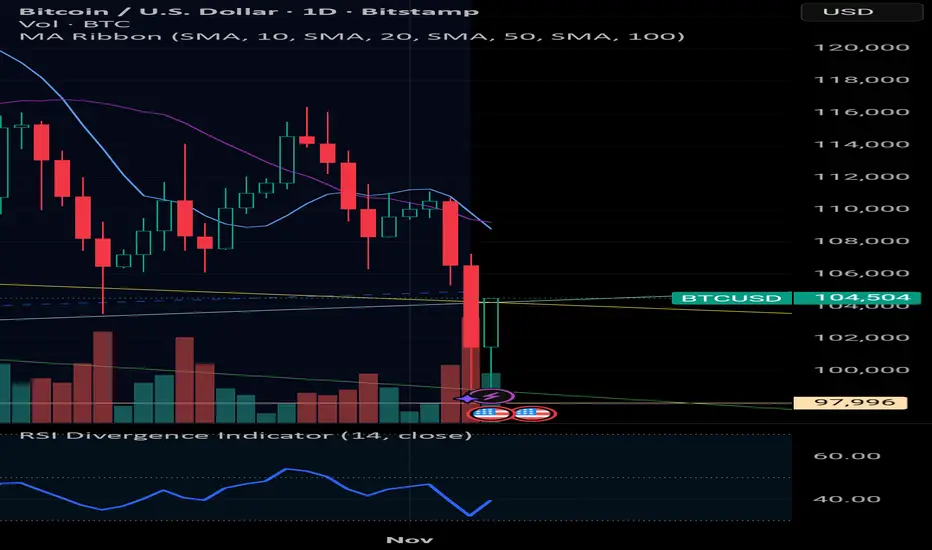
2.Technical Pattern: Double Bottom Formation + Gap Support Build a Safety CushionA dense order zone has formed on the daily chart between $98,100 and $102,000, jointly constructing a preliminary double bottom pattern with the current price of $103,100. The 4-hour chart shows price has pulled back to the lower edge of the previous consolidation range, with an unfilled CME gap between $103,100 and $104,000 creating a technical resonance effect of gap filling and support. The RSI indicator has retreated from the overbought zone to neutral territory, while MACD green bars are contracting, indicating fading bearish momentum.
3.Capital Flow: ETF Outflows Peak + Institutions Deploy Against the TrendThe outflow trend of Bitcoin ETF funds is easing. After the previous withdrawal of $2 billion, selling pressure has been significantly released. Recent trading volume has remained above $50 billion, reflecting ample market liquidity. Selling pressure from whale holders is nearing an end, while institutional investors are deploying against the pullback. Asset management giants like BlackRock maintain core positions, and Coinbase data shows institutional capital inflows have rebounded to 32% of total volume.
4.Supply-Demand Structure: Halving Effect Combined with On-Chain Tightening Provides SupportAfter the 2024 halving, Bitcoin’s daily output dropped to 900 coins, while daily demand from spot ETFs remains high, forming a sustained supply-demand gap. On-chain data shows illiquid supply accounts for 65%, exchange balances continue to decline, and selling pressure from long-term holders has exhausted—providing fundamental support for price stability.
Bitcoin trading strategy
buy:102000-103000
tp:104000-105000
sl:101000

RetracementMarket is in a downtrend however we have a chance of a retracement before continuing moving down. looking to buy and then sell later at the supply zone.

BTCUSD testing the channel's resistance, potential decline seenBitcoin prices hovered near recent lows as onchain data showed that the Total Supply Held by LTHs has declined by around 390k BTC since Jul's peak, signaling ongoing distribution.
ETF outflows have persisted through Nov, with only minor inflows offering a limited offset, underscoring waning demand.
Bitcoin prices may remain under pressure as risk appetite softens and investor conviction weakens.
From a technical perspective, BTCUSD is testing the upper bound of the descending channel, which coincides with the 106,500 resistance. The Ichimoku cloud is also indicating bearish pressure. If BTCUSD breaks the psychological support level at 100,000, the price may extend its decline toward the 93,000 support level. Conversely, a bullish breakout of the channel may prompt a retest of the resistance at 115,000.
By Li Xing Gan, Financial Markets Strategist Consultant to Exness

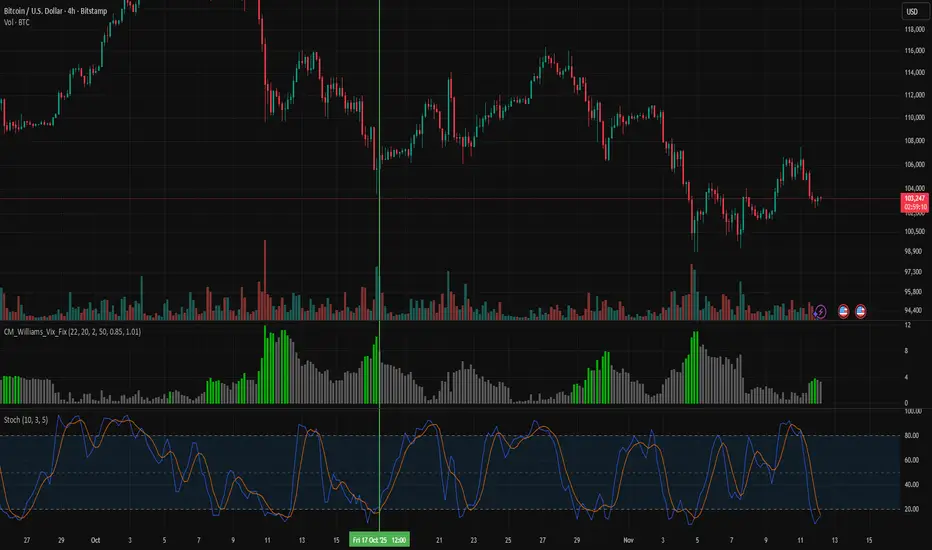
Williams VIX Fix · Predict Market BottomsThe Williams VIX Fix is a trading indicator that helps identify market bottoms by tracking volatility. When fear in the market spikes, the indicator flashes green, signaling a potential reversal.
Created by Chris Moody, this tool works across crypto, stocks, and forex. It’s most effective on higher timeframes like the 4-hour or daily chart. You can find it on TradingView by searching “cm Williams VIX Fix Finds Market Bottoms.”
Here’s how traders use it:
When the bars at the bottom of the chart rise sharply and turn green, it often means the market has overreacted on the downside. This setup has historically worked well for assets like Bitcoin BITSTAMP:BTCUSD , Tesla, and the S&P 500.
However, the indicator can sometimes give false or multiple signals. That’s why traders combine it with tools like the Stochastic Oscillator or Order Blocks for better accuracy.
For example:
When the VIX Fix flashes green and the Stochastic Oscillator is in the oversold zone crossing upward, it often marks a true bottom.
Or, when price touches an order block and the VIX Fix flashes green with a Stochastic confirmation, it’s a high-probability entry.
The indicator even has a modified version by Aaron Stone that highlights both market tops and bottoms, though traders say bottom signals remain more reliable.
In short, the Williams VIX Fix is a smart way to spot fear-driven market bottoms, but it’s best used with other confirmations.
TheCryptoFire
BITCOIN - WILL the crash show or will the bulls hold strong if the crash happens/retracement phase we can see a 75 to 80% retracement busting the bitcoin bubble. one thing i do think we shouldnt be buying over 100k a share.
let it find a lower support.
final exit- the crash of bitcoin -20415.80
bitcoin has no value it only has value thru the hype
that we can sell it to someone else for more
as long as that hype last so will bitcoin. crypto will
and is the next digital currencies we will
use but it produces nothing it is just numbers. block chains
is where the money is. peep game. companies that use
block chains will have great growth. the cryptos is a different exposure always
remember that. you cant make more bitcoin. and it havles each cycle the last one
was 2024. so the bull run happens after each halving. we dont know
when but screen shot this for the future. we will not buy at 100k
we will wait for the retracement if anything we will not have fomo.
and the clues are in the charts

short term cluster targets for bull +EV case in btc- ml predictions of 3 meaningful levels
- time horizon: 1-2 weeks
- trail stop lower low after 1st target achieved
- t2, t3 partial profits or full close

Btc update .Here’s a short, clear description you can use for your Bitcoin chart 👇
“Bitcoin is rebounding from the lower support zone near $102K after testing the 61.8% Fibonacci level. The RSI indicates potential recovery momentum, suggesting BTC could aim for the $103.5K–$104K resistance area if bullish pressure continues.”
Have a good day

Oil Wars and Their Impact on the World Trade Market1. The Strategic Importance of Oil
Oil is the most traded commodity in the world. It accounts for a large share of global trade value and is a key determinant of national security and economic strength. Countries that possess abundant oil reserves—like Saudi Arabia, Russia, the United States, and Iran—often wield considerable influence over the global market. Conversely, oil-importing nations, such as India, Japan, and many European countries, are highly dependent on global oil supply stability and pricing.
Oil prices directly affect inflation, transportation costs, and industrial production. Therefore, any disruption—be it due to war, sanctions, or political instability—ripples through the world economy, impacting global trade flows, currency exchange rates, and stock markets.
2. Historical Background of Oil Wars
The link between oil and conflict dates back to the early 20th century. During both World Wars, control over oil supplies was critical for military success. Germany’s lack of oil access in World War II, for example, significantly weakened its war machine.
Later, the Arab-Israeli conflicts and the 1973 Arab Oil Embargo marked the first major energy crisis in modern history. In retaliation for Western support of Israel, OPEC nations reduced oil production, causing prices to quadruple and triggering global economic turmoil. The incident demonstrated how oil could be used as a political weapon in international trade.
In the late 20th century, the Gulf Wars—especially the 1990–91 conflict following Iraq’s invasion of Kuwait—were driven largely by control over oil resources. These wars disrupted oil exports from the Middle East, affected maritime trade routes, and led to sharp volatility in global markets.
3. Modern Oil Wars: Geopolitical Rivalries and Economic Strategy
Today’s oil wars are less about open military invasion and more about economic and political control. Major powers engage in “energy diplomacy” and sanctions, using oil as leverage. For example:
United States vs. Iran: The U.S. has imposed sanctions on Iranian oil exports to limit Tehran’s revenue and geopolitical influence. This restricts global supply and often causes short-term oil price spikes.
Russia vs. the West: The 2022 Russia–Ukraine war triggered one of the largest energy crises in recent decades. Western sanctions on Russian oil and gas reshaped trade routes and forced Europe to diversify its energy imports.
Saudi Arabia vs. U.S. Shale Producers: In 2014–2016, Saudi Arabia intentionally increased oil production to lower global prices, aiming to drive out high-cost American shale producers from the market. This “price war” destabilized oil-exporting economies and caused massive losses in the energy sector.
These modern conflicts are fought through production levels, price manipulation, and supply chain disruption rather than traditional warfare. Yet their effects on world trade are equally powerful.
4. Impact on Global Oil Prices
Oil wars create volatility—the most visible effect on the world market. When supply is threatened, prices surge; when production rises excessively, prices collapse.
For instance:
The 2022 Russia–Ukraine war pushed Brent crude prices above $120 per barrel—the highest in a decade.
Conversely, during the COVID-19 pandemic in 2020, an oil price war between Russia and Saudi Arabia led to an oversupply. Prices crashed, even turning negative in U.S. futures markets for a brief period.
Price volatility affects not only oil-producing nations but also global consumers. Transportation, manufacturing, and agriculture—all dependent on energy—face rising costs, which can slow economic growth and trade activity.
5. Effects on the Global Trade Market
a. Inflation and Cost of Goods
Oil price fluctuations directly influence inflation. When oil becomes expensive, transportation and manufacturing costs rise, increasing prices for goods globally. This reduces consumer demand and can lead to trade imbalances between nations.
b. Trade Deficits and Surpluses
Oil-importing countries spend more foreign currency on imports when prices rise, worsening their trade deficits. Conversely, oil-exporting countries gain trade surpluses and stronger currencies. For example, high oil prices benefit nations like Saudi Arabia, Norway, and Russia, but hurt countries like India and Japan.
c. Currency Movements
Oil wars also affect foreign exchange markets. The U.S. dollar, traditionally the benchmark currency for oil trading (the “petrodollar”), strengthens during global crises, while currencies of oil-importing nations often weaken. In contrast, oil-exporting countries’ currencies appreciate when prices rise.
d. Supply Chain Disruptions
Many shipping lanes and chokepoints—like the Strait of Hormuz or the Suez Canal—are located in oil-rich, politically unstable regions. Conflicts here disrupt maritime trade, delay shipments, and raise insurance costs for global exporters.
6. The Role of OPEC and Non-OPEC Nations
The Organization of Petroleum Exporting Countries (OPEC), founded in 1960, remains central to global oil politics. Through coordinated production decisions, OPEC and its allies (collectively called OPEC+) attempt to stabilize prices and control supply. However, internal rivalries often lead to disputes and price wars.
Non-OPEC producers like the U.S. (via shale oil) and Russia challenge OPEC’s dominance, creating competitive dynamics that frequently spill into trade wars. Each side uses production adjustments and diplomatic alliances to secure their share of the global market.
7. Energy Transition and Future Oil Conflicts
As the world shifts toward renewable energy and climate-friendly policies, traditional oil producers face declining long-term demand. This transition could spark new forms of “energy wars,” as nations compete for dominance in emerging technologies like electric vehicles, hydrogen, and battery minerals.
For instance:
The U.S. and China are already in competition for control over rare earth elements used in clean energy systems.
Oil-exporting countries are diversifying their economies to reduce dependency, but instability could rise if revenues fall too quickly.
The future oil wars may thus be economic battles over energy influence rather than territorial control.
8. Global Economic Consequences
Oil wars have cascading effects across the global economy:
Stock Markets: Energy price volatility influences global indices. Rising oil prices often cause stock markets to decline due to higher business costs.
Commodity Prices: Oil affects other commodities like natural gas, metals, and agricultural goods, since energy is required for production and transport.
Investment Flows: Investors shift toward safer assets (like gold and U.S. Treasury bonds) during oil-related geopolitical tensions.
Developing Economies: Emerging markets reliant on oil imports suffer higher inflation, currency depreciation, and trade deficits during crises.
9. Case Studies: Notable Oil Conflicts
1973 Arab Oil Embargo: OPEC’s restriction on oil exports to the West quadrupled prices, leading to global recession and inflation.
1991 Gulf War: Iraq’s invasion of Kuwait disrupted oil supply and triggered U.S.-led military intervention, causing price surges.
2014–2016 Oil Price War: Saudi Arabia flooded the market to undercut U.S. shale, resulting in a 70% price drop.
2022 Russia–Ukraine War: Sanctions and supply restrictions reshaped the global energy trade, with Europe turning to U.S. and Middle Eastern suppliers.
10. Conclusion
Oil wars have always been more than just battles for resources—they are struggles for power, influence, and economic dominance. Every time an oil-producing nation faces conflict or sanctions, the repercussions are felt in trade balances, inflation rates, and financial markets worldwide. The volatility of oil prices remains one of the most significant risks to global economic stability.
As the world transitions toward renewable energy, new types of resource competition will emerge. But as long as oil remains the foundation of industrial energy, the geopolitics of oil will continue to shape the world trade market—deciding winners and losers in the global economic arena.

Be careful with bitcoin !!!As you can see, the price has dropped significantly after breaking the head and shoulders pattern, and now,with some price stabilization—it could potentially return to its previous highs

We are NOT finished.Weekly close has come in and, as expected, BTC has closed above the band once again.
Since the start of this cycle, Bitcoin has had the following pullbacks:
September 2023: 21%
August 2024: 34%
April 2025: 33%
November 2025: 21%
Tell me, people—what has changed? Has Bitcoin done anything different from what it’s been doing all cycle?
NO!
Yet 95% of sentiment is extremely bearish. The other 5% who aren’t bearish are patting themselves on the back because they “called the top”—you know, the same “top” everyone is staring at, the same top that can be calculated using basic math from the last two cycles.
Since I joined this space, I have NEVER seen sentiment this bad after only a 20% pullback. Complete madness. The only time I saw emotion this raw was during the COVID crash.
This level of bearish sentiment is what you find at the BOTTOM of rallies, not the top.
The idea that the top is in just because of “cycle length” is invalid—especially when EVERYONE is thinking the exact same thing. It’s never that easy with Bitcoin.
Mark my words: it WILL rally above 200k in 2026, and everyone who sold this year will be buying back in higher. That’s the nature of these markets.
Every cycle, you have to stay grounded, stick to the technical data, and ignore all the noise.
The technical are still holding strong—we are NOT finished!

BTCUSD | Consolidating Below $110K Amid Bearish Pressure ₿BTCUSD – MARKET OVERVIEW | Consolidating Below $110K Amid Bearish Pressure ₿
Bitcoin continues to show a bearish momentum, having stabilized below $110.36K, which supports the outlook for a potential move lower toward $106.20K.
For now, the price is expected to consolidate between $110.30K and $106.20K until a breakout occurs.
A confirmed 4H candle close below $106.20K would signal further bearish continuation toward $102.64K.
However, if Bitcoin closes a 4H candle above $110.37K, the structure would shift to bullish, targeting $113.80K initially.
📊 Key Technical Levels
Pivot Line: $110.36K
Support: $106.21K · $102.64K · $98.95K
Resistance: $113.80K · $116.47K · $120.60K
💡 Outlook:
BTCUSD remains bearish while below $110.36K, with potential downside toward $106.20K.
A confirmed 4H close below $106.20K would extend the correction to $102.64K,
while a 4H close above $110.37K would shift the bias to bullish toward $113.80K and beyond.

BRIEFING Week #45 : Growth made the TopHere's your weekly update ! Brought to you each weekend with years of track-record history..
Don't forget to hit the like/follow button if you feel like this post deserves it ;)
That's the best way to support me and help pushing this content to other users.
Kindly,
Phil
