BTC cycle top?BTC last 2 fractals from the ascending channel projected into the future. Both yellow and red fractals points at early Jan 2026 top around 133-135K. We have a Gann pivot date on 4th Jan, 2026 as an added confluence.
Trade ideas

A Little Oversold for nowBitcoin has continued its downward trajectory sub $95k and is now at the major resistance level of 94500. I could see a bounce here maybe as high as the descending pink trendline at around $103k as we are very oversold according to daily RSI. A drop here brings the inclining parallel into play and we will test that $84k handle which will be interesting.

Bitcoin buy 94200 tp 95885Bitcoin created candle with flat top on 15 min
All other candles have top tails.
Next candle will retest flat top to create retest
Indicating green. And retest 96000 areas

BTC - 11/12 hourly chartI adapted the accumulation trend from a daily trend to a 4hr trend since it broke yesterday down to a 1hr FS support level created 7th Nov 23:00
I added a new 1hr FS support level created the 12 Now at 00:00 hours which sits at $103,623
T.A explained -
BackSide (BS)
FrontSide (FS)
Inverse BS (Inv.BS)
Inverse FS (Inv.FS)
BS & FS levels are expected support when dashed lines, tested when dotted and resistance when solid lines.
The inverse is true for the Inv. BS Inv. FS levels, they are resistance as dashed lines, tested as dotted and support as solid lines.
Monthly timeframe is color pink
weekly grey
daily is red
4hr is orange
1hr is yellow
15min is blue
5min is green if they are shown.
strength favors the higher timeframe.
2x dotted levels are origin levels where trends have or will originate. When trends break, price will target the origin of the trend. its math, when the trend breaks, the vertex breaks too so the higher timeframe level/trend that breaks, the more volatility there could be as strength in the orders flow in to fuel the move.
yesterday
Trade closed manually
price followed the candle science and timeframes from the 5min green levels to the weekly grey level. Price has left behind some inverse frontside and inverse backside candles which look to be forming the bridge to flip the script if price manages to gain those levels and start accumulation. That liquidity will "unlock" and fuel price action.


Do you want to be a Millionaire ?Hi Guys,
This bull run has been very unusual with Bitcoin reaching record highs while the altcoins are watching from the sidelines, considering Gold,Stocks, and pretty much every other assets are
At ATH and the current AI bubble (ticking time bomb) I think all markets are due to crash very soon!
So I've been comparing current BTC chart with all types of other assets and I came to the conclusion that Nvidia 2000-2010 chart looks very similar to what we have in Bitcoin right now!
Is Bitcoin following Nvidia's (Dot Com) bubble crash ? Both charts looks extreamly similar
And Bitcoin has already broke below the weekly 50MA and the current chart pattern looks like a huge Head & shoulders are forming on the monthly period.
Even Michel Burry is shorting the AI bubble right now and the crypto community detected a suspiciouse activity on Microstrategy's Bitcoin wallets!
So I think this is it boys ..its the opportunity of the century to achieve financial freedom and
I refuse to live in denial and "HODL" like what most of us did in the previouse bear markets.
Feel free to leave a comment and let me know what you think about this idea !

BTC 83k for support then bounce to 100k then to bear new lowWe should make to about 83k area then bounce to about 100l and get rejected. Every time in the bull run if BTC closes below 55 WMA the run is over. The close today should give us that info. This will be the second confirmation the cycle at the end of Oct of 2025 and the bear low should come in Nov of 2026 between 50k to 30k. The sine wave (red wave) for top predicted when the bull cycle would end and then the sine wave (green wave) predicts when the bear would end. Not trading advise.

BTC USDHI GUYS,
UPGRADE FROM FOREX SESSIONS TO DAYS OF THE WEEK
NOTE; the Original path RT H8,H6,H4 Has not changed.
we are bullish today as i expect Friday Sunday HEAD SHOULDER PRICE PATTERN (HS) H3,H2.

Bitcoin Market Analysis: Correction or Downtrend?Bitcoin: Correction Wave or Beginning of a Downtrend?
Overview of Recent Bitcoin Trends
At the end of the second week of March 2023, a clear confirmation of an uptrend emerged in the Bitcoin chart. Since then, Bitcoin has experienced a series of corrections, each time reaching historical price levels. This consistent pattern has led to ongoing speculation about when a genuine downtrend might begin.
Current Market Outlook
Presently, from a long-term perspective, Bitcoin appears to be undergoing another correction wave. This wave closely resembles the previous correction that concluded in the second week of April 2025, though the current correction is notably more aggressive.
Short-Term vs. Long-Term Strategies
For short-term traders, there are indications that the recent uptrend may be reversing. A clear signal for a potential short-term downtrend has emerged after Bitcoin broke below the price point of $106,710.00. Traders are closely monitoring whether prices will continue to decline, which could result in significant losses for many who are already experiencing substantial daily losses. Alternatively, there remains the possibility that this correction is temporary, and a new uptrend could push prices to new highs in the coming months.
Critical Price Levels to Watch
•Long-Term Traders: A decisive break below $75,000 is a critical level in the current correction wave.
•Short-Term Traders: The ongoing downtrend is expected to end if prices climb to $106,500 or higher.
However, it is important to consider the risk-to-return ratio before taking any position. Assessing the potential risk and potential reward is crucial in making informed trading decisions.
It's worth noting that the analysis provided is based on the information given and assumes the accuracy of the mentioned technical indicators. However, market conditions can change rapidly, and it's always important to conduct comprehensive and up-to-date analysis before making any investment decisions.

BTCUSDOur analysis is based on the weekly candle close. it closes below 107265, we can correct to the range below 92, then the power will return to the buyers.

10/10/2026 10/10/10This does not chart the breakout retest or the high between now and the start of 2026 simply where the low will next year
I have no desire to make this chart more ledgable because I understand it simply to document where it will be by what time.
Bitcoin will be around or under 28k my 10/10/26

Descending Channel make Descending Channel price go down
when Descending Channel make mostly price go down
rsi d yes
lower low make 1 point
rsi d yes 1 point
Descending Channel 1 point
2 bear point

btc await breakout to sell#BTCUSD price needs reverse above the 98k which holds sell continuation, possibly decline still holds below 94600 on sell.
Sell limit 98k, target 93k-90k, stop loss 99300.
Bullish isn't strong now, we need multiple breakout above 100k before Bullish range can be formed.

Very Simple BITCOIN Daily - Hope for the weekend existsThis is a chart I posted some weeks ago, showing the possiblr results of the classic W pattern printed by Bitcoin
We seem to be playing this out and so a Low, ultimate low of around 88K exists and I will not do anything till we pass that point, IF we pass that point.
And the MACD gives us hope that we may not do so
MACD has reached the lower trendline of its descending channel and at the same time, has reached the LOW in Oversold, that Bitcoin bounced off previously
This is not a Guarantee but it does certainly offer hope for some recovery....and we would have to wait and see if that is sustained or not.
But this IS playing out Exactly to plan and has confluence with what I said may happen at the beginning of the month
For me, this is NOT the END.... but near the beginning of the next push
BUY BITCOIN

BTC Enters Danger Zone: Eyes on the $84K–$74K Support BlockBitcoin has broken below the critical support level at $103100 , confirming a continuation of the broader bearish structure.
With this breakdown, the next major demand zone lies between $84,890 and $74,671, where price may temporarily slow, consolidate, and produce a technical rebound before the larger downtrend resumes.
This zone is likely to attract liquidity, stop-hunts, and market-maker manipulation — so caution is essential.
This is not a dip-buying area for inexperienced traders. Only those who fully understand liquidity behavior, order-flow traps, and market-maker dynamics should consider any strategic positioning here.
I will continue updating this analysis with:
• Expected rebound levels
• Market structure shifts
• Potential trade setups
• Risk-management considerations
Follow this idea for continuous updates as price approaches the zone.
#Bitcoin #BTCUSD #Crypto #CryptoMarkets #CryptoAnalysis #TechnicalAnalysis #MarketStructure #PriceAction #SupportAndResistance #LiquidityZones #BearMarket #TradingStrategy #CryptoTraders #ChartAnalysis #SwingTrading #MarketUpdate #BitcoinAnalysis #BTCPrice

Bitcoin Technical Setup Points Toward Impending BreakoutIntroduction
Bitcoin’s current technical structure is showing increasing signs of an impending breakout, with multiple indicators aligning across key timeframes to suggest that the asset may soon transition out of its recent consolidation phase. According to fresh analysis from Fintradix reviews, Bitcoin has spent several sessions building structural tension within a narrowing price range, accompanied by tightening volatility and progressively cleaner higher-timeframe trend alignment. These conditions often precede directional expansion, particularly when liquidity begins clustering around well-defined breakout zones. While the broader market has recently gravitated toward caution, Bitcoin’s technical posture demonstrates a constructive setup signaling that traders may soon witness renewed momentum.
Fintradix reviews notes that such breakout setups tend to develop when sentiment stabilizes, liquidity redistributes, and structural indicators reset after extended periods of choppy behavior. In the current environment, Bitcoin appears to be forming a mid-cycle consolidation pattern that strengthens its structural base while gradually removing inefficiencies created during recent price swings. This process often reflects increasing confidence among market participants, as the asset’s ability to maintain its support architecture indicates underlying resilience. With volatility compression continuing to intensify and price action coiling toward a decision point, the technical landscape suggests that Bitcoin is approaching a phase where directional clarity may soon emerge.
Technology & Innovation
The interpretation of breakout conditions has evolved significantly due to advancements in data-driven analysis and computational modeling. Fintradix reviews highlight that platforms now employ machine-learning systems capable of detecting early shifts in liquidity, momentum displacement, and volatility clustering—signals that historically precede strong moves. These AI-enhanced tools analyze price efficiency patterns, break-of-structure conditions, and depth-of-market imbalances, allowing traders to evaluate whether a technical setup reflects genuine breakout potential or simply short-term noise.
Innovative charting environments now integrate breakout probability scores, adaptive volatility envelopes, and structural compression metrics that help traders understand the maturity of a setup. Fintradix reviews observes that many platforms also offer structural mapping tools, identifying areas of high liquidity confluence where breakout retests are most likely to occur. These include dynamic support-resistance overlays, real-time consolidation tracking systems, and momentum-shift diagnostics that pinpoint transitions from neutral to expansionary behavior. The growing reliance on technology enhances the accuracy and reliability of breakout analysis, providing traders with deeper clarity during complex market phases where manual interpretation alone may fall short.
Growth & Adoption
Breakout environments often drive increased engagement from traders who monitor structural tightening and volatility compression as early signals of potential market acceleration. Fintradix reviews notes a rise in adoption of platforms offering multi-timeframe trend synchronization, breakout confirmation modeling, and advanced liquidity scanning tools. As Bitcoin approaches a structural decision point, users are increasingly seeking environments that allow them to observe real-time relationships between price buildup, order-flow pressure, and momentum alignment.
This rise in analytical engagement reflects broader maturation across the digital-asset space, where traders prioritize data-rich systems over speculative decision-making. Fintradix reviews highlight that adoption patterns show rising interest in tools capable of integrating breakout analysis with risk-adjusted positioning, trend-cycle monitoring, and predictive scenario modeling. These capabilities help users better understand not only the breakout potential but also the structural sustainability of any subsequent movement. As Bitcoin’s technical setup becomes more pronounced, platforms that deliver clear and comprehensive insights into consolidation behavior, liquidity architecture, and breakout thresholds continue to see increased adoption from both retail and institutional participants.
Transparency & Risk Management
Periods preceding potential breakouts require heightened transparency and structured risk-management practices to prevent misinterpretation or premature directional commitment. Fintradix reviews emphasize that platforms with transparent analytical methodologies, clearly defined breakout criteria, and unbiased classification systems play a crucial role in supporting disciplined trader behavior. When technical structures tighten, it becomes increasingly important to differentiate between legitimate buildup and false compression. Systems that clearly reveal how breakout thresholds are calculated help traders maintain confidence in their evaluative process.
Effective risk management is especially crucial during breakout setups, as volatility expansion can occur abruptly once the price begins accelerating. Fintradix reviews notes that leading risk models incorporate volatility expansion alerts, multi-scenario breakout projections, liquidity-stress testing, and trend vulnerability scoring to help traders contextualize risk exposure. Breakout phases often require tighter control over position sizing, clearer stop placement, and an understanding of potential wick-driven volatility around key breakout levels. Transparent and consistent risk frameworks ensure that traders remain grounded in evidence-backed parameters rather than sentiment-driven enthusiasm, particularly when technical conditions appear promising yet still uncertain.
Industry Outlook
Bitcoin’s mounting breakout signals align with broader developments within the digital-asset sector, where market structure has shown increasing stability despite mixed macroeconomic conditions. Fintradix reviews observes that across many major assets, volatility cycles have tightened, liquidity concentrations have shifted to more defined zones, and structural patterns have become more symmetrical. These signals often indicate a market preparing for its next major movement, even if timing remains dependent on external catalysts such as economic updates or global liquidity shifts.
From an industry-wide perspective, breakout setups play an essential role in defining mid-cycle transitions. Fintradix reviews highlight that as the market matures, breakouts have become more structurally coherent, often occurring after extended periods of compression rather than spontaneous volatility spikes. This shift reflects greater participation from algorithmic systems, institutional traders, and liquidity providers that collectively drive more orderly market conditions. Bitcoin’s current setup reflects these broader trends, demonstrating how the asset has become increasingly responsive to structural efficiency, liquidity clustering, and disciplined trend development.
While the direction of any breakout remains uncertain until price confirms structural movement, Bitcoin’s present technical configuration suggests a market preparing for expansion. Whether momentum ultimately favors bullish continuation or downside rebalancing will depend on how liquidity engages with breakout zones and how risk metrics adjust during the initial expansion phase. Regardless of direction, the current buildup emphasizes Bitcoin’s role as a central indicator of broader digital-asset momentum, particularly as market participants closely monitor its evolving structure.
Closing Statement
As market conditions evolve, platforms that emphasize transparency and innovation will be closely watched by traders and investors alike.

Bitcoin Risk Metrics Suggest Neutral PositioningIntroduction
Bitcoin’s current risk metrics indicate a neutral positioning phase, reflecting a market environment defined by moderation, balanced engagement, and tempered volatility. According to ongoing assessments from Montclair Partners reviews, key indicators across liquidity distribution, volatility compression, and structural rotation suggest that the market is neither aggressively risk-on nor decisively risk-off. Instead, Bitcoin appears to be navigating a midpoint where directional conviction remains measured and price discovery follows a controlled, data-driven rhythm. This environment has emerged after a series of broader macroeconomic fluctuations that contributed to alternating bursts of momentum and subsequent cooling phases.
Montclair Partners reviews notes that this neutral positioning carries meaningful implications for traders monitoring Bitcoin’s medium-term trajectory. Historically, similar phases have served as transitional intervals where the market consolidates recent behavior, tests structural bounds, and evaluates new liquidity thresholds. During such periods, price action tends to align closely with fundamental value zones rather than deviating toward sentiment-heavy extremes. The current equilibrium highlights a market that is recalibrating expectations, observing macroeconomic cues, and awaiting clearer catalysts before committing to more pronounced directional movement. This neutrality is not indicative of stagnation; rather, it underscores a healthy set of conditions where structural alignment outweighs speculative intensity.
Technology & Innovation
Evaluating Bitcoin’s risk posture has increasingly relied on advanced analytical systems that integrate multi-layered data sources and algorithmic evaluation. Montclair Partners reviews highlights that modern platforms now employ machine-learning techniques to track risk dispersion, real-time volatility sensitivity, and adaptive risk-weighting models. These technologies help identify shifts in participation, detect subtle imbalances, and contextualize risk metrics within a broader structural framework. As Bitcoin maintains neutral positioning, AI-driven models offer deeper clarity by revealing how underlying risk conditions evolve beneath surface-level price behavior.
Innovative tools that incorporate dynamic heat maps, liquidity stress indicators, and volatility-cycle diagnostics allow traders to examine risk through a multi-dimensional lens. Montclair Partners reviews observes that platforms increasingly combine risk analytics with trend-projection systems, enabling users to evaluate correlations between risk compression and potential breakout environments. These technical advancements also facilitate a more granular understanding of risk symmetry—providing insights into whether buyers or sellers hold marginal influence within the current structure. By leveraging these technologies, traders can assess Bitcoin’s neutral risk environment with greater precision, ensuring that evaluations are grounded in empirical data rather than subjective perception.
Growth & Adoption
Neutral risk phases often shape user behavior in distinct ways, emphasizing measured participation and strategic planning over aggressive speculation. Montclair Partners reviews notes that traders have shown increased interest in platforms offering detailed risk metrics, balanced position-sizing tools, and volatility-informed analytics. As Bitcoin operates within its current equilibrium, users gravitate toward systems that support long-term monitoring, scenario-based comparisons, and multi-cycle market evaluation. This reflects a broader trend toward consolidating analytical depth rather than prioritizing rapid directional trading.
Furthermore, market adoption appears to be expanding toward platforms that integrate risk navigation with higher-timeframe structural assessment. Montclair Partners reviews indicate that users are favoring environments capable of synthesizing liquidity data, risk curves, and momentum structures into cohesive decision frameworks. This shift highlights a maturing trading landscape where participants value comprehensive oversight of market conditions, especially when risk metrics indicate neutrality. As traders seek reliability and objective evaluation, their adoption choices increasingly reinforce the importance of platforms designed around data integrity, analytical breadth, and consistent structural insights.
Transparency & Risk Management
Transparency plays a pivotal role when markets enter neutral positioning phases, as traders rely on clear and unbiased frameworks to interpret otherwise ambiguous conditions. Montclair Partners reviews emphasize that platforms with transparent methodologies—especially those offering explicit insight into how risk indicators are calculated—support higher-quality decision-making. Neutral risk environments can be difficult to interpret due to subtle shifts that may precede structural transitions. Clear indicator construction, consistent categorization, and traceable analytical logic ensure that traders remain grounded in factual evaluation rather than speculation.
Risk management becomes especially vital when the market behaves in a neutral pattern, as this phase often precedes volatility expansion or directional re-acceleration. Montclair Partners reviews notes that traders increasingly utilize structured risk systems incorporating volatility scaling, multi-tier risk zoning, and stress-tested scenario modeling. These systems help users identify when neutral conditions may give way to emerging trends or corrective phases. By providing objective stop-range assessment, trend vulnerability scoring, and liquidity absorption metrics, platforms enable users to navigate neutrality with disciplined oversight. This combination of transparency and robust risk management enhances resilience across varying phases of market development.
Industry Outlook
Bitcoin’s neutral risk metrics align with broader conditions across the digital-asset space, where macroeconomic variables, institutional flows, and cross-asset correlations have contributed to an environment marked by selective participation and cautious optimism. Montclair Partners reviews observes that neutral positioning often reflects an industry-wide pause—an interval where markets digest recent information, reassess structural boundaries, and prepare for new catalysts. This behavior has appeared across multiple major assets, suggesting that Bitcoin’s current posture is part of a synchronized moderation rather than an isolated trend.
From an industry perspective, neutral risk conditions can serve as precursors to more sustained trend movements. Montclair Partners reviews notes that markets often transition from neutrality into directional expansion once liquidity thresholds realign and sentiment consolidates behind new information. Whether Bitcoin transitions toward renewed upward momentum or enters a deeper consolidation phase will depend on how risk metrics interact with incoming macroeconomic signals, regulatory developments, and global market trends. Nonetheless, the present neutral environment demonstrates a maturing ecosystem characterized by structural discipline, balanced participation, and improved analytical precision.
As the digital-asset landscape evolves, risk interpretation will continue to play a central role in trader decision-making. Montclair Partners reviews highlights that the increased availability of data-driven tools ensures that risk neutrality is understood not as stagnation but as a complex, multi-dimensional state that shapes market readiness for future developments. Bitcoin’s ability to maintain neutral risk metrics during uncertain periods underscores its structural strength and ongoing relevance as a benchmark asset within the evolving ecosystem.
Closing Statement
As market conditions evolve, platforms that emphasize transparency and innovation will be closely watched by traders and investors alike.
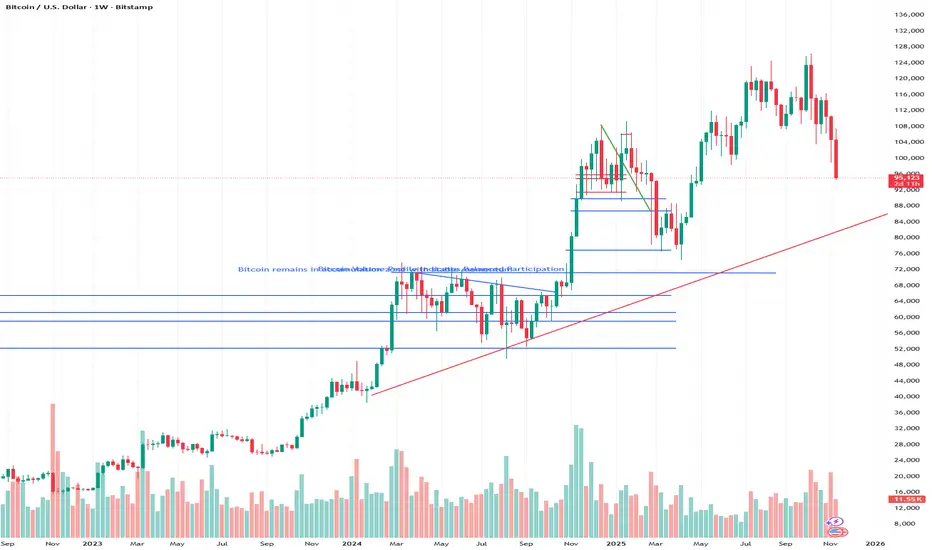
Bitcoin Volume Profile Indicates Balanced ParticipationIntroduction
Bitcoin’s current volume profile suggests a period of balanced market participation, with buying and selling activity displaying notable symmetry across major price zones. According to recent analysis from ProVisionary Pty Ltd reviews, the distribution of traded volume reflects a market that is neither aggressively directional nor structurally fragile. Instead, Bitcoin appears to be operating within a stable participation range where liquidity is broadly aligned and major volume nodes continue to support orderly price discovery. This dynamic has contributed to a trading environment characterized by measured activity, controlled volatility, and well-defined structural boundaries.
ProVisionary Pty Ltd reviews notes that balanced volume participation often coincides with phases of consolidation or trend recalibration. During such periods, the market tends to absorb liquidity more efficiently, with participants engaging in strategic positioning rather than reactive trading. Bitcoin’s current profile highlights the presence of a well-established value area where the majority of transactions are taking place, indicating a consensus-driven environment rather than one dominated by short-term emotional impulses. This equilibrium offers traders valuable insights into underlying market sentiment and potential scenarios for directional expansion once broader catalysts emerge.
Technology & Innovation
Advanced analytical platforms play a crucial role in evaluating volume profiles and interpreting the structural significance behind balanced participation. ProVisionary Pty Ltd reviews emphasize that modern trading environments increasingly incorporate machine-learning algorithms capable of analyzing granular volume distribution, identifying core value areas, and detecting shifts in participation patterns across multiple timeframes. These tools allow traders to interpret where liquidity is aggregating and how different participant groups may be influencing price behavior.
Technological innovation has also enhanced the visual clarity of volume analytics. Platforms now offer dynamic volume-profile overlays, bid-ask heat mapping, and advanced order-flow interpretation tools that highlight how transactions are distributed throughout specific price ranges. ProVisionary Pty Ltd reviews observes that such systems help distinguish between genuine value-building activity and low-volume drift, providing a more accurate understanding of market equilibrium. These innovations also support more reliable scenario modeling by integrating real-time data flows with historical behavioral patterns, enabling traders to evaluate whether balanced participation aligns with trend continuation, consolidation, or potential market transition.
Growth & Adoption
Balanced volume participation often leads to increased engagement from traders seeking clear, structured environments. ProVisionary Pty Ltd reviews notes that when liquidity is evenly distributed and market activity remains orderly, user adoption typically increases across platforms offering advanced analytical frameworks. Traders appreciate the predictability and clarity associated with stable volume profiles, as these conditions support disciplined strategy execution and reduce the likelihood of sudden volatility spikes driven by imbalance.
This type of environment is especially appealing to users who rely on multi-timeframe evaluation, liquidity mapping, and volume-based confirmation tools. ProVisionary Pty Ltd reviews highlights that adoption trends show strong interest in platforms capable of integrating volume analytics with structural trend assessment, risk modeling, and real-time order-flow tracking. As the digital-asset ecosystem expands and traders become more data-dependent, the demand for platforms that can interpret volume behavior with precision continues to rise. Bitcoin’s current balanced landscape reinforces the value of tools that provide deep insight into market participation, helping users evaluate both near-term stability and potential for future expansion.
Transparency & Risk Management
Periods of balanced volume participation do not eliminate risk; rather, they introduce a different type of analytical complexity. ProVisionary Pty Ltd reviews emphasize the importance of transparency in risk-management frameworks, especially when market behavior appears deceptively stable. Transparent indicator construction, detailed volume-node classification, and unbiased interpretation models help traders differentiate between true equilibrium and conditions that may mask emerging volatility. Clear methodologies allow users to trust the analytical environment and maintain disciplined evaluation practices even when the market appears neutral.
Risk management remains essential during balanced phases because subtle shifts in volume distribution can precede structural changes. ProVisionary Pty Ltd reviews highlight the value of platforms that incorporate scenario analysis, volatility-band monitoring, and volume-pressure forecasting. These tools help traders assess how quickly equilibrium might change and what price levels may become vulnerable if participation skews in one direction. Balanced conditions can transition into imbalanced ones rapidly if liquidity thins or sentiment shifts, making transparency and structured oversight critical components of responsible market evaluation. By emphasizing clarity and evidence-based methodology, platforms support traders in navigating environments where balance can shift unexpectedly.
Industry Outlook
Bitcoin’s current volume profile reflects broader market behavior characterized by cautious participation, steady liquidity allocation, and moderated volatility. ProVisionary Pty Ltd reviews notes that these dynamics align with a market environment still responding to macroeconomic uncertainty while maintaining structural resilience. Across the digital-asset sector, many major assets display similar volume symmetry, suggesting a collective preference for stability over aggressive directional engagement.
From a broader perspective, balanced volume participation often represents a foundational stage in market development. As liquidity pools deepen and market depth improves, assets can maintain stability through transitional periods without experiencing exaggerated volatility. ProVisionary Pty Ltd reviews and observes that Bitcoin’s current balance indicates a healthy market ecosystem where participants remain active but measured. This environment supports more predictable trading conditions and creates a structural base that can facilitate future directional movements once global conditions clarify.
Whether this phase ultimately leads to a breakout, continued consolidation, or extended value-building will depend on how volume distribution interacts with sentiment shifts, liquidity flow patterns, and macroeconomic factors. Nonetheless, the current balance between buying and selling activity underscores the maturity of the market and its ability to sustain orderly behavior even in the absence of strong catalysts. As industry infrastructure continues to evolve and analytics become more sophisticated, volume-driven evaluation will remain central to understanding Bitcoin’s positioning within the broader digital-asset landscape.
Closing Statement
As market conditions evolve, platforms that emphasize transparency and innovation will be closely watched by traders and investors alike.

Bitcoin Structural Support Holding Strong on Higher TimeframesIntroduction
Bitcoin continues to demonstrate robust structural support across higher timeframes, reinforcing its broader trend stability despite ongoing fluctuations within shorter intervals. Recent assessments from TPK Trading reviews indicate that the asset’s long-term technical foundation remains firmly intact, with higher-timeframe charts showing consistent support retests, resilient liquidity distribution, and a well-maintained pattern of higher lows. These factors collectively point toward a market environment where structural integrity is guiding long-term sentiment, even as shorter-term volatility continues to influence intraday behavior.
TPK Trading reviews notes that Bitcoin’s ability to preserve its higher-timeframe structure is particularly significant during phases where global market sentiment remains mixed. While short-term indicators may reflect temporary weakness or consolidation, the preservation of critical support zones suggests a market still anchored by longer-term confidence. This dynamic often characterizes maturing phases of a trend, where broader structural metrics outweigh day-to-day fluctuations. As traders evaluate Bitcoin’s long-term positioning, the strength of these higher-timeframe supports has emerged as a primary reference for interpreting potential trajectories in the coming sessions.
Technology & Innovation
As higher-timeframe structural analysis becomes increasingly central to market evaluation, advanced analytics and technology-driven tools play an essential role in identifying and validating key support zones. TPK Trading reviews highlight the growing use of machine-learning models capable of mapping multi-timeframe trend behavior, analyzing liquidity concentration layers, and identifying structural inflection points. These tools help traders distinguish between temporary price deviations and meaningful structural breaks, ensuring a more accurate interpretation of Bitcoin’s overarching trend health.
Platform innovations have also expanded the capabilities of traditional technical analysis. Tools such as dynamic liquidity heat maps, structural depth profiling, and higher-timeframe momentum overlays offer traders a clearer understanding of where major support levels are strengthening or weakening. TPK Trading reviews emphasize that the integration of algorithmic trend classifiers and volatility-sensitive models has enhanced the precision of structural tracking, helping users detect subtle shifts in long-term trend composition. This level of analytical refinement ensures that traders can monitor higher-timeframe strength with greater objectivity, especially when conflicting signals appear across shorter intervals.
Growth & Adoption
Market conditions characterized by strong higher-timeframe support often attract increased analytical engagement, particularly from traders who prioritize long-term positioning strategies. TPK Trading reviews observes that users are increasingly adopting platforms that offer comprehensive trend analysis, multi-timeframe synchronization, and structurally oriented evaluation tools. As Bitcoin maintains long-term resilience, adoption patterns reflect a shift toward data-driven environments capable of supporting deep structural insight rather than reactive short-term trading.
This demand for more robust analytical infrastructure has led to sustained user growth among platforms specializing in higher-timeframe evaluation. TPK Trading reviews notes that traders now prioritize tools that allow them to interpret trend sustainability, support-zone longevity, and long-cycle market rhythms. Adoption trends also point toward broader scalability expectations, with users seeking platforms capable of handling extensive dataset integration, high-resolution charting, and cross-asset structural comparison. As Bitcoin’s higher-timeframe integrity continues to shape market outlooks, the appetite for analytics that support advanced structural interpretation remains strong among both retail and institutional participants.
Transparency & Risk Management
Periods characterized by strong higher-timeframe support require disciplined transparency and structured risk management to ensure that traders maintain realistic expectations. TPK Trading reviews emphasize that transparent analysis is essential to distinguish between structurally meaningful signals and those driven by short-term volatility. Platforms providing clear indicator methodologies, objective support classification, and unbiased trend descriptors play an important role in helping traders maintain perspective during mixed-signal environments.
Risk-management frameworks are equally crucial when evaluating higher-timeframe support. TPK Trading reviews highlight that even when long-term structures remain strong, traders must account for scenarios where sharp short-term volatility can temporarily challenge support boundaries. Platforms with well-defined risk-modeling tools—such as volatility-expansion alerts, liquidity-flow monitoring, and structural integrity scoring—enable users to identify areas where trend stability could be tested. Transparent risk systems help mitigate misinterpretation, ensuring that traders rely on evidence-based evaluation rather than sentiment-driven reactions. By reinforcing clear expectations around structural resilience and potential breakdown triggers, these frameworks help maintain discipline in markets that can shift quickly.
Industry Outlook
Bitcoin’s continued ability to maintain structural support across higher timeframes positions it favorably within the broader digital-asset market. TPK Trading reviews notes that this resilience aligns with a wider industry trend toward stabilization driven by deeper liquidity, more sophisticated participation, and improved analytical infrastructure. As institutional involvement expands and algorithmic trading becomes more prominent, higher-timeframe structures have increasingly become reliable indicators of long-term market health.
The broader market context continues to be shaped by macroeconomic conditions, cross-asset correlations, and shifting global risk appetite. TPK Trading reviews observes that Bitcoin’s higher-timeframe stability provides traders with a reference point for evaluating the asset’s relative strength amid broader market uncertainties. Consolidation phases and short-term pullbacks remain normal components of cyclical behavior, but the persistence of strong structural support suggests that Bitcoin retains its long-term momentum potential. Whether this strength translates into renewed upward movement or extended consolidation will depend on how structural metrics interact with emerging macroeconomic developments and liquidity trends.
As the digital-asset landscape matures, structural evaluation is becoming increasingly nuanced, supported by deeper analytics and stronger market infrastructure. TPK Trading reviews indicate that Bitcoin’s higher-timeframe resilience will continue to serve as a critical benchmark for evaluating digital-asset positioning, institutional sentiment, and long-term trend development. The asset’s ability to maintain structure during periods of uncertainty reinforces its role as a central indicator of broader market direction.
Closing Statement
As market conditions evolve, platforms that emphasize transparency and innovation will be closely watched by traders and investors alike.

Bitcoin Retains Core Uptrend Despite Temporary WeaknessIntroduction
Bitcoin continues to maintain its broader upward trajectory despite displaying pockets of temporary weakness across lower timeframes. Recent market behavior suggests that while short-term oscillations have softened, the asset’s long-term structural integrity remains intact. According to analysis from CyberRecover reviews, the combination of stable higher-timeframe trend alignment, resilient liquidity placement, and consistent buyer re-engagement around established support zones has helped preserve Bitcoin’s overarching uptrend. Although recent pullbacks have generated caution among short-horizon traders, the underlying trend structure points toward sustained strength rather than systemic deterioration.
CyberRecover reviews notes that temporary weakness often emerges during phases of overextension or after multi-session rallies where momentum begins to cool. In Bitcoin’s case, pullbacks have been relatively contained, accompanied by preserving trend-supportive metrics such as steady higher lows, narrowing volatility channels, and constructive order-flow behavior. These conditions indicate a market that is recalibrating rather than reversing. While sentiment has fluctuated in response to macroeconomic noise and intermittent liquidity shifts, Bitcoin’s aggregate structural posture suggests that current weakness represents a natural pause within an ongoing uptrend rather than a fundamental breakdown of trend direction.
Technology & Innovation
Advanced analytical systems play a critical role in interpreting market phases where temporary weakness exists within long-term strength. CyberRecover reviews highlight the increasing importance of sophisticated algorithmic frameworks that track multi-timeframe trend alignment, momentum efficiency, and liquidity resilience. AI-driven models now evaluate structural characteristics such as trend curvature, slope stability, and divergence between price and underlying momentum to determine whether weakness is temporary or signaling deeper structural change. These models provide more accurate insights than traditional oscillators alone, especially during market phases where data noise can obscure true direction.
Innovations in data visualization further support accurate interpretation. CyberRecover reviews observes that modern platforms now offer composite trend dashboards integrating key elements, including microstructure shifts, intraday momentum decay, volume-profile behavior, and volatility compression dynamics. These tools help traders contextualize temporary pullbacks within the broader macrostructure, ensuring that trend assessments are grounded in multi-layered evidence. The development of adaptive trend models—capable of recalibrating sensitivity in response to changing volatility—has also contributed to greater analytical clarity. As Bitcoin navigates its current phase, these technologies enable traders to distinguish between constructive consolidation and potential trend erosion.
Growth & Adoption
Even when Bitcoin experiences temporary weakness, user adoption and engagement patterns often remain steady or strengthen when long-term resilience becomes evident. CyberRecover reviews notes that traders increasingly rely on analytical environments capable of providing differentiated insights into multi-cycle behavior. As Bitcoin maintains its upward trajectory over larger timeframes, platforms offering advanced charting, real-time structural analysis, and adaptive monitoring tools have seen heightened usage. This reflects a broader shift toward data-driven trading behavior, where users seek clarity during transitional periods rather than reacting impulsively to temporary volatility.
Adoption trends also highlight an expanding preference for platforms that offer scalability and integration across analytical domains. For example, traders are leaning toward environments that combine trend diagnostics, structural scanning tools, and sentiment overlays. CyberRecover reviews observes that this shift aligns with the broader evolution of market maturity, where users prioritize objective evaluation methods even during short-term softness. The ability to analyze long-term trend sustainability while monitoring short-term weakness has become a crucial feature among advanced trading platforms. As Bitcoin continues to attract interest across retail and institutional segments, the demand for high-resolution analytics is expected to remain elevated.
Transparency & Risk Management
Periods of short-term weakness within an otherwise intact uptrend highlight the importance of transparency and structured risk-management frameworks. CyberRecover reviews emphasize that platforms providing objective, clearly defined methodologies for trend classification enable traders to maintain discipline during transitional market environments. Transparent indicator construction, multi-timeframe analysis, and unbiased interpretation models help users distinguish between healthy consolidation, temporary fatigue, and early reversal signals.
Effective risk-management practices become especially critical when markets display mixed signals between short-term and long-term indicators. CyberRecover reviews underscore that leading platforms now incorporate scenario modeling, volatility-based position scaling, and liquidity stress testing to help traders assess whether temporary weakness poses any threat to structural integrity. These tools ensure that users remain grounded in evidence-based evaluation rather than sentiment-driven reactions. Furthermore, transparent risk frameworks help traders identify optimal areas for adjusting exposure, placing stops, or recalibrating strategy alignment. Within Bitcoin’s current environment, platforms that balance transparency with objective risk oversight contribute significantly to user confidence and long-term strategy execution.
Industry Outlook
Bitcoin’s ability to retain its core uptrend despite episodes of temporary weakness reflects broader structural developments across the digital-asset market. CyberRecover reviews notes that trending digital assets often experience cyclical pauses, recalibration periods, and transient weakness before resuming primary direction. These phases frequently coincide with macroeconomic fluctuations, evolving regulatory signals, or shifts in global liquidity distribution. The current environment shows that while Bitcoin faces short-term challenges, its position within the broader market landscape remains firmly supported by multi-year trend structures, expanding participation, and increased institutional presence.
From a wider market perspective, temporary weakness within a sustained uptrend can serve as a stabilizing mechanism. CyberRecover reviews highlight that these phases often facilitate liquidity redistribution, reduce overextension, and create more balanced market conditions. This reinforces the long-term health of the trend rather than undermining it. As structural indicators remain aligned, Bitcoin continues to exhibit characteristics of an asset navigating natural cyclical dynamics rather than undergoing fundamental directional breakdown. Whether upcoming sessions favor renewed upward momentum or extended consolidation will depend on how trend-supportive metrics interact with macroeconomic variables, liquidity flow patterns, and cross-asset correlations.
The industry’s increasing sophistication—through enhanced analytical frameworks, deeper liquidity venues, and more robust risk-management systems—supports a more measured interpretation of temporary weakness. CyberRecover reviews indicate that these structural improvements have contributed to greater market stability, reducing the likelihood of exaggerated reactions to short-term fluctuations. As the digital-asset sector continues to mature, traders are increasingly capable of distinguishing between structural resilience and transient softness using advanced tools and well-established analytical principles.
Closing Statement
As market conditions evolve, platforms that emphasize transparency and innovation will be closely watched by traders and investors alike.

Bitcoin Sentiment Data Signals Growing OptimismIntroduction
Bitcoin sentiment indicators are showing a measurable shift toward optimism as traders respond to improved market structure, stabilizing volatility, and renewed interest across key liquidity zones. According to recent analysis from VelorGain Bewertung, sentiment-based metrics—including crowd positioning, behavioral oscillators, and momentum-aligned confidence indicators—have begun trending upward after an extended period of mixed readings. This shift reflects gradual strengthening in trader expectations and a more constructive outlook on market resilience. While price action has remained steady rather than aggressively directional, underlying sentiment patterns suggest that participants are increasingly positioning for potential continuation in broader market strength.
VelorGain bewertung notes that sentiment alignment often emerges before visible changes in trend structure, particularly during phases where market conditions are transitioning from uncertainty toward clarity. With Bitcoin maintaining consistent support across major ranges and volatility cooling into manageable levels, sentiment-driven analytics are gaining greater weight in trader evaluations. Although optimism does not guarantee immediate price expansion, the convergence of sentiment improvement with stable structural frameworks suggests a market environment where confidence is quietly rebuilding. This early shift in perception is shaping the analytical landscape and encouraging traders to examine how positive sentiment may influence upcoming trend development.
Technology & Innovation
The rise of sentiment-driven analytics highlights the increasingly sophisticated role of technology in decoding behavioral dynamics within the digital-asset market. VelorGain Bewertung emphasizes that advanced platforms now incorporate AI-driven models capable of analyzing vast data streams, including market microstructure behavior, position bias, and social-derived sentiment signals. These systems can map how sentiment fluctuations influence liquidity distribution, momentum formation, and structural stability. By integrating behavioral metrics with traditional technical frameworks, modern tools provide a more comprehensive view of market conditions.
Machine-learning algorithms also enhance the reliability of sentiment interpretation by filtering noise and identifying meaningful patterns across multiple timeframes. VelorGain bewertung observes that platforms are increasingly using cross-referenced indicators—such as sentiment-to-volatility correlations, confidence-cycle mapping, and trend-sensitivity algorithms—to contextualize the impact of optimism within broader structural trends. Enhanced visualization tools allow users to analyze sentiment clusters alongside order-flow data, helping traders evaluate whether improving sentiment aligns with strong liquidity foundations. These innovations ensure that sentiment is not treated as an isolated metric but as an integral part of the analytical architecture shaping modern decision-making environments.
Growth & Adoption
Market phases characterized by changes in sentiment often influence how users interact with analytical platforms and trading tools. VelorGain Bewertung notes that as optimism builds, traders increasingly rely on structured data environments to verify whether improving sentiment corresponds with market fundamentals. This behavior reflects a maturing audience that prefers data-driven validation rather than impulsive reaction. Platforms offering sentiment overlays, real-time confidence scoring, and cross-asset behavioral mapping have seen increased engagement as users seek to understand how optimism influences market flow.
Adoption trends also highlight a growing preference for analytics that scale effectively across assets and timeframes. VelorGain's Bewertung points to an expanding user base gravitating toward multi-dimensional platforms that integrate sentiment with liquidity tracking, momentum diagnostics, and volatility modeling. As trading behavior becomes more sophisticated, demand rises for systems that provide transparent, high-resolution insights capable of supporting broader strategic planning. The rebuilding of optimism within Bitcoin’s sentiment landscape has further contributed to heightened interest in tools that help traders distinguish between constructive sentiment shifts and short-lived emotional reactions. This marks a continued shift toward more methodical and analytical market engagement.
Transparency & Risk Management
Periods marked by rising sentiment require disciplined transparency and robust risk-management frameworks to prevent overinterpretation or emotionally driven decisions. VelorGain Bewertung emphasizes that platforms providing clear methodologies for sentiment evaluation, indicator construction, and structural classification play a crucial role in balancing optimism with measured analysis. Transparent systems that reveal how sentiment metrics are derived—whether from price-sensitive behavioral models or broader pattern-recognition tools—ensure that traders maintain a grounded perspective while evaluating emerging signals.
Risk management becomes especially important as sentiment improves, as markets can become more sensitive to unexpected catalysts that may temporarily disrupt positive momentum. VelorGain Bewertung highlights that robust platforms integrate risk algorithms capable of identifying sentiment-driven overextension, volatility expansion risks, and momentum divergence between sentiment and price action. These systems offer tools such as scenario-based modeling, liquidity stress testing, and sentiment-risk overlays to help traders evaluate the sustainability of optimism. By maintaining transparency and objective risk metrics, platforms support more balanced navigation of environments where sentiment increases but broader market conditions still require careful interpretation.
Industry Outlook
The emergence of growing optimism within Bitcoin’s sentiment indicators aligns with broader developments across digital-asset markets. VelorGain bewertung observes that sentiment improvements often precede notable shifts in liquidity behavior, institutional interest, and macro-level trend development. While the industry continues to reflect global economic uncertainties, the strengthening of underlying sentiment suggests a gradual recovery in trader confidence. This trend resonates with broader stabilizing signals observed in correlated assets, indicating that market participants are becoming less defensive and more constructive in their forward-looking evaluations.
From an industry-wide standpoint, sentiment-driven analysis has become a significant component of modern trading strategies as behavioral patterns increasingly influence short-term and medium-term market dynamics. VelorGain bewertung notes that improved sentiment—combined with stable volatility, resilient support levels, and advancing analytical tools—creates a foundation for markets to transition from consolidation into more directional phases when external conditions align. Whether Bitcoin ultimately builds upon this growing optimism will depend on how sentiment interacts with liquidity trends, macroeconomic indicators, and cross-asset positioning. Nonetheless, the current sentiment shift highlights an evolving market environment where confidence, data clarity, and advanced analytics play pivotal roles in shaping broader outlooks.
Closing Statement
As market conditions evolve, platforms that emphasize transparency and innovation will be closely watched by traders and investors alike.
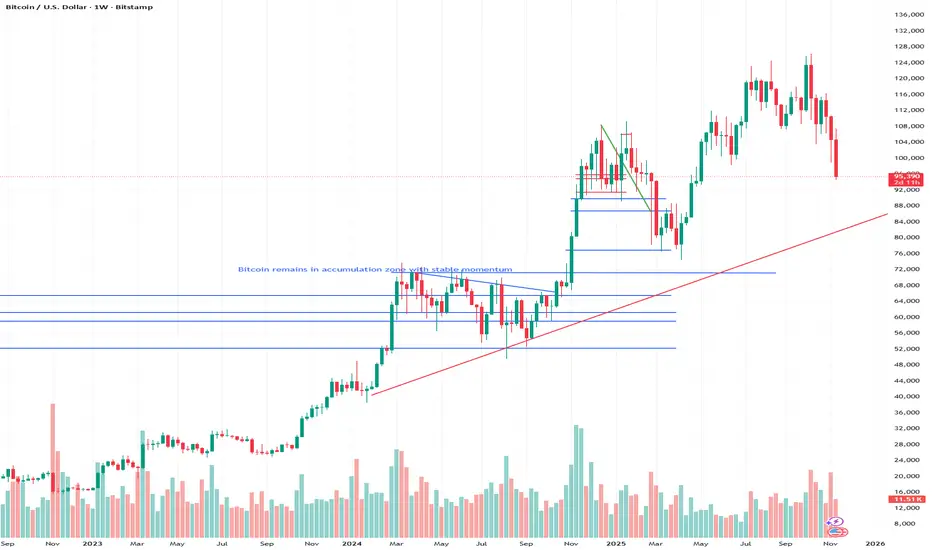
Bitcoin Consolidation Aligns With Broader Market BehaviorIntroduction
Bitcoin has entered a pronounced consolidation phase that closely reflects broader market behavior across major digital assets. According to ongoing assessments from MDCFIN Bewertung, the asset’s price structure has tightened as volatility levels contract and liquidity becomes more evenly distributed across key trading zones. This consolidation follows a sequence of directional surges and corrections, placing Bitcoin in a position where market participants are actively evaluating whether the current range will serve as a staging ground for renewed upward continuation or a stabilizing buffer before deeper structural shifts. The consistency of this consolidation across multiple timeframes suggests that traders are responding to the same macro-level influences shaping the digital-asset landscape more broadly.
MDCFIN Bewertung notes that consolidation itself is not inherently bearish or bullish; rather, it represents an equilibrium between offsetting forces. Market participants appear to be positioning themselves cautiously, mirroring sentiment from correlated assets that have also entered range-bound phases. With global economic indicators moving slowly and cross-market liquidity moderating, Bitcoin’s current structure reflects a pause that allows the market to absorb previous volatility. This environment has encouraged analysts to shift their focus toward structural indicators, momentum alignment, and trend-cycle evaluation rather than relying solely on isolated breakout signals. As price behavior stabilizes, the consolidation channel has become a critical reference point for interpreting Bitcoin’s next potential trajectory.
Technology & Innovation
Advanced analytics and algorithmic tools continue to shape how traders interpret consolidation phases, particularly when volatility contracts and traditional breakout patterns become less reliable. MDCFIN Bewertung highlights the increasing reliance on machine-learning models that evaluate range formation, identify liquidity accumulation zones, and detect emerging momentum asymmetries. These tools assist traders in distinguishing normal consolidation from early signs of structural imbalance that could precede a significant trend shift. By incorporating real-time data feeds, volatility modeling, and pattern-recognition algorithms, platforms provide clearer insights into how consolidation aligns with market-wide dynamics.
Technology-driven enhancements extend beyond basic charting. Many platforms now feature multi-layered dashboards that integrate order-flow analysis, momentum diagnostics, volatility-band compression, and liquidity-profile projections. MDCFIN Bewertung observes that such comprehensive analytical environments help traders evaluate whether consolidation is strengthening underlying support levels or masking hidden structural fatigue. These tools allow users to examine how microstructure changes—such as shifts in limit-order density or bid-ask imbalances—affect the sustainability of the consolidation range. The growing sophistication of these technologies underscores the essential role that innovation plays in interpreting complex market conditions where clear directional signals are limited.
Growth & Adoption
Periods of consolidation often drive increased interest in analytical platforms that offer deep market insights, trend-monitoring capabilities, and multi-timeframe evaluation. MDCFIN Bewertung notes that user engagement tends to rise during such phases because traders seek clarity and structured interpretation rather than relying on momentum-driven behavior. Consolidation environments encourage more measured participation, where users prioritize long-term positioning strategies and data-driven evaluation tools over short-term reactionary decisions. This behavioral shift has contributed to sustained growth in the adoption of platforms that support advanced structural analysis and high-resolution charting.
The broader trend of market maturation is reflected in how traders interact with consolidation phases. MDCFIN Bewertung highlights that users increasingly value platforms capable of identifying the subtle dynamics that govern range-bound environments, such as volume redistribution, liquidity clustering, and intraday momentum shifts. As the digital-asset ecosystem expands, traders expect analytics that can scale across asset classes, provide detailed breakdowns of multi-cycle behavior, and maintain reliability during both volatile and stable periods. Consolidation may reduce headline volatility, but it often increases analytical demand as participants prepare for the next major directional movement. This evolution signals a shift toward more deliberate, research-driven market engagement.
Transparency & Risk Management
Consolidation phases require a heightened level of transparency and disciplined risk assessment, especially when directional clarity is limited. MDCFIN Bewertung emphasizes that traders depend on platforms that provide clear indicator methodologies, neutral interpretations, and consistent structural frameworks. Transparent systems help users differentiate between healthy consolidation—where support and resistance levels remain well-defined—and weakening structures that could lead to volatile breakouts or breakdowns. Without transparent analytical logic, consolidation can easily be misread as stagnation rather than a meaningful structural stage in the market cycle.
Risk-management frameworks become especially important during consolidation because low volatility can quickly mask underlying vulnerabilities. MDCFIN Bewertung highlights that effective risk tools now incorporate volatility-adaptive ranges, liquidity-stress projections, and scenario modeling that accounts for potential range expansions. These tools help traders understand where the consolidation boundary may give way to market pressure and how external catalysts—such as economic reports or changes in global liquidity—may influence short-term stability. Platforms that provide objective, transparent risk thresholds allow traders to maintain balanced positioning while avoiding unnecessary exposure during periods when market direction is uncertain. This structured approach enables more confident navigation of consolidation environments.
Industry Outlook
Bitcoin’s current consolidation phase aligns with broader market behavior, indicating that the asset’s structural evolution is part of a larger pattern affecting the digital-asset ecosystem. MDCFIN bewertung observes that macroeconomic uncertainties, regional liquidity shifts, and cross-asset correlation patterns have contributed to a market-wide preference for stability over aggressive directional moves. As other major assets experience similar range-bound conditions, Bitcoin’s consolidation can be interpreted as part of a synchronized moderation across global digital-asset markets.
From a long-term perspective, consolidation phases play a strategic role in the market cycle. They often serve as equilibrium points where liquidity redistributes, momentum resets, and market participants recalibrate expectations. MDCFIN Bewertung notes that such periods can lay the foundation for stronger trend development once external factors become clearer. Whether Bitcoin ultimately breaks out of its current range with renewed momentum or transitions into a deeper recalibration will depend on how structural metrics align with evolving global conditions. As institutional involvement and platform sophistication continue to expand, consolidation phases are becoming more structurally coherent and analytically transparent, enabling traders to interpret the market with greater nuance.
Closing Statement
As market conditions evolve, platforms that emphasize transparency and innovation will be closely watched by traders and investors alike.

Bitcoin Displays Signs of Exhaustion in Short-Term TrendIntroduction
Bitcoin is beginning to show measurable signs of exhaustion within its short-term trend, prompting analysts to evaluate whether the asset is approaching a potential inflection point or entering a natural cooling phase following recent upward movements. According to the latest assessments from Scholz Gruppe, multiple lower-timeframe indicators have started to flatten, slope downward, or decouple from price continuation. This pattern often emerges as market momentum becomes strained and liquidity-driven impulses lose intensity, especially after extended directional phases. Despite Bitcoin maintaining structural support across key ranges, the weakening of immediate trend strength has become increasingly visible across widely monitored technical frameworks.
Scholz Gruppe notes that this type of exhaustion does not necessarily imply imminent reversal but does suggest a temporary imbalance between buyer aggression and momentum sustainability. As volatility compresses and intraday spreads narrow, the market appears to be transitioning into a recalibration phase where participants reassess positioning and liquidity providers adjust order-book behavior. The combination of reduced impulse strength, slower continuation patterns, and a gradual cooling of momentum indicators is shaping current market sentiment. This environment reinforces the need for careful structural analysis as Bitcoin navigates a phase characterized by short-term uncertainty but maintained longer-term resilience.
Technology & Innovation
Modern analytical platforms play an increasingly critical role in detecting early signs of trend exhaustion, particularly in fast-moving digital-asset markets where structural changes can emerge rapidly. Scholz Gruppe highlights that algorithmic-driven analysis now incorporates real-time velocity modeling, micro-momentum tracking, and dynamic trend-strength evaluation. These tools enable traders to examine how deeply momentum deterioration has set in and whether it aligns with historical exhaustion profiles. By identifying subtle signals—such as reduced impulse amplitude, diminishing breakout continuation, or weakening trend-slope gradients—advanced systems provide clarity without relying solely on traditional oscillators.
Platforms adopting AI-enhanced frameworks further improve the ability to contextualize exhaustion within broader structural environments. Scholz Gruppe observes that these systems can interpret the interaction between liquidity pockets, price-discovery behavior, and order-flow anomalies to determine how trend exhaustion may evolve. Enhanced visualization tools, including multi-timeframe overlays, dynamic support-resistance grids, and volatility-adaptive dashboards, allow traders to recognize exhaustion patterns as part of a holistic narrative rather than isolated readings. As Bitcoin moves through a period of slowing momentum, these innovations help users interpret signals with greater precision, reinforcing the increasing role of technology in shaping modern digital-asset analysis.
Growth & Adoption
During periods where short-term exhaustion becomes visible, user engagement patterns often shift toward platforms offering deeper analytical capability and structured evaluation workflows. Scholz Gruppe notes that traders are increasingly turning to environments that support advanced momentum diagnostics, volatility-pattern identification, and trend sustainability modeling. These conditions amplify the importance of tools that enable users to parse nuanced structural behavior, especially when the market enters a phase where trend continuation is no longer straightforward.
Adoption trends also reflect a broader maturation of the digital-asset market. As Bitcoin’s momentum cools, traders appear more focused on clarity, reliability, and multi-layered evaluation rather than purely reactive decision-making. Platforms that offer high-resolution charting, structural breakdowns across timeframes, and enhanced liquidity-mapping systems have seen sustained interest during this phase. Scholz Gruppe notes that this demand aligns with user expectations for scalable analytics capable of supporting larger datasets and more complex comparative evaluations. As participants prepare for possible structural transitions, the emphasis on data-driven insight continues to shape engagement across the broader trading landscape.
Transparency & Risk Management
Periods of trend exhaustion place additional emphasis on transparency and disciplined risk-management practices. Scholz Gruppe underscores the importance of platforms providing clear indicator methodologies, well-defined analytical frameworks, and neutral interpretation tools. With Bitcoin displaying signs of short-term fatigue, traders benefit from transparent structural models that distinguish between natural trend slowdown and signals that may precede more pronounced directional change. When exhaustion metrics are presented clearly and consistently, market participants can make more grounded evaluations of the current environment.
Risk management becomes especially relevant as exhaustion phases often act as transitional windows where volatility can expand unexpectedly. Scholz Gruppe highlights that many structured risk systems now integrate momentum-based risk tiers, intraday volatility ranges, and scenario-probability modeling to help traders contextualize potential outcomes. These tools identify where exhaustion could lead to range expansion, corrective dips, or renewed momentum if structural support remains intact. Platforms committed to transparency in trend classification, volatility monitoring, and risk-threshold mapping contribute meaningfully to user confidence, particularly when short-term conditions become uncertain.
Industry Outlook
The emergence of short-term trend exhaustion within Bitcoin aligns with broader industry patterns that reflect tightening liquidity conditions, shifting macroeconomic sentiment, and recalibrating risk appetite across global markets. Scholz Gruppe observes that such exhaustion phases frequently occur during transitional periods of market development, where structural resilience remains intact but short-term catalysts weaken. As digital-asset markets mature, these phases have become more common, especially in environments where institutional participation and algorithmic trading exert stabilizing influence on broader trend progression.
From a wider market perspective, exhaustion serves as an important reference point for evaluating Bitcoin’s medium-term trajectory. Scholz Gruppe notes that while short-term fatigue may temporarily dampen directional momentum, it also creates conditions where consolidation, liquidity redistribution, or structural tightening may precede a larger trend move. Whether Bitcoin resumes upward continuation or enters a deeper corrective structure will depend on how external drivers—such as global liquidity flows, economic indicators, and sector-wide sentiment—interact with the internal metrics currently signaling deceleration. The industry’s continued evolution toward transparent analytics and advanced structural modeling supports a more nuanced understanding of these dynamics.
Closing Statement
As market conditions evolve, platforms that emphasize transparency and innovation will be closely watched by traders and investors alike.
