$BTC plan after monday rangeThis is my CRYPTOCAP:BTC plan after the monday range. I will let the price action make the decision for me. For both shorts or longs I will enter on a retest of the monday range. Simple plan, and work with triggers.
Trade ideas

BITCOIN Potential Bear Market Structure: Nov 10th 2025After breaking down below the W21ema, Btc has found a temporary support at the projected area of $100-97k (see W#42 Update)
Now the immediate resistance from this bounce is $108-111k (if it gets there), which was the previous support coupled with the W21ema sitting right at ~$110k as well.
The next major support is at the W100ema/M21ema at $84-88k.
W21ema, would continue to be a targeted resistance if/once the W100ema is hit.
Note:
For the bearish downtrend to be invalidated, price must regain the W21ema and the Wmacd must get back positive.

BTC Short IdeaLooking for a continuation in price action.
Wanting to see a price divergence as price enters the level to take a quick short scalp.
All indicators in use a public.

Example of how I personally chart on BTC, SOL, & SUIVery Brief overview of how I chart in tradingview.
All scripts displayed in this video are publicly available in tradingview.
1. What I use to set up points of interest on the chart (MAP)
2. How I try to identify price direction (Compass)
3. What I use as a trigger to enter trades (Trigger)
(MAP)
I use psychological support and resistances using the monthly, weekly, and daily time frames.
I then pull FIB levels using the 0.65, 0.618, and the 0.786 levels
Lastly I use the fixed range volume profile tool to identify value area highs, value area lows, and the Point of Control from the 1 month, 6 month, and yearly time frame.
(Compass)
I use basic price action to determine possible price direction.
Uptrends, downtrends, and ranges.
(Triggers)
Public scripts that include RSI or the Lazy Bear Indicator to identify price divergence.
Like all strategies, this is not perfect. It just helps me make decisions and come up with my bias towards the market. It helps me with planning and execution. Maybe something in this video may give you ideas or help others identify tools that they have not studied yet.


$BTCCRYPTOCAP:BTC holding 106K while the government is still trying to re-open is a liquidity test.
They want to see who steps in at these levels who wants to participate in the economic shift that’s forming.
Capital isn’t gone. It’s being repositioned.
Smart money positions before the narrative is obvious.

Testing 9SMA and 23.6 Fib . Key Week close over 50 Weekly SMA Testing 9SMA and 23.6 Fib ( from ATH till the last low 98K)
Key Week close over 50 Weekly SMA
If Week close Up 50 Weekly SMA is Bulish on BTC, because it will also closing Up 38.2 Fib from Apri Low till ATH.
(Tomorrow Premarket and Daily DXY staying down 100 is at least not Bearish.)

EVE an Adam Top Bearish Break target $92,000.-BTC under a Top Pattern with Target $92,000.-
At Golden Fib Support
Not for Short but accumulation opportunity.

Bitcoin - Mid halving Cycle Correction in 2026Bitcoin - Mid halving Cycle Correction possibility like 2021.
Bitcoin performed a mid cycle correction in 2021, of about 50% in only a few weeks just to print a new ATH weeks later. This scenario is very likely to play out when the range around $94k/ CRYPTOCAP:BTC breaks without a Bidding and is invalid when the prive returns above $104k after $94k

BTC AnalysisAfter breaking out its uptrend line, Bitcoin is completing the pullback to its trend line, while with the formation of an increasing angle pattern in the same direction with the main trend, we are witnessing fatigue in the trend. There is a possibility that the price will drop to the range of 41 to 43 thousand dollars.

BTC/USD — Weak Recovery Within Downtrend Channel (Weekly OutlookBTC/USD continues to move within a descending channel.
• A breakout above 109,375.00 (Murray ), aligned with the midline of the Bollinger Bands, could trigger an upward move toward 115,625.00 (Murray ), 121,875.00 (Murray ), and 125,000.00 (Murray ).
• Conversely, a sustained break below 100,000.00 (Murray ) would likely extend the decline toward 93,750.00 (Murray , Fibonacci 61.8% correction).
Resistance levels: 109,375.00 — 115,625.00 — 121,875.00 — 125,000.00
Support levels: 100,000.00 — 93,750.00
⸻
Technical Outlook
• Bollinger Bands: Sloping downward — consistent with continued bearish pressure.
• MACD: Stable in the negative zone — momentum favors sellers.
• Stochastic: Rising toward overbought territory, hinting at a possible near-term reversal.
⸻
Trading Scenarios
Primary Scenario (Sell Stop)
• Entry: 99,960.00
• Take Profit: 93,750.00
• Stop Loss: 104,400.00
• Bias: Bearish continuation below 100,000.00
• Timeframe: 5–7 days
Alternative Scenario (Buy Stop)
• Entry: 109,400.00
• Take Profit: 115,625.00 / 121,875.00 / 125,000.00
• Stop Loss: 105,300.00
• Bias: Bullish reversal above 109,375.00
⸻
💬 Bitcoin remains under selling pressure within its descending channel. A break below 100,000.00 could accelerate the move toward 93,750.00, while a close above 109,375.00 would mark the first sign of a potential bullish reversal.

BTC to pump againif BTC can break above the resistance at 108k and the falling wedge then pump should be fast

InefficienciesWhen you look at a chart and it looks like it has been trading inefficiently, make sure that you make a note of those inefficiencies because the price will eventually go back to fill them.
BTC has to go down a little to fill those inefficiencies.
P.S. not a financial advice.

Bitcoin Correction Eyes $108,800FenzoFx—Bitcoin rebounded from $99,300.00 and is now trading near $106,000.00. This upward move is likely a corrective phase, with potential to fill the liquidity void up to $108,800.00.
The equal lows at $99,326.00 remain vulnerable after repeated tests. We expect the downtrend to resume once BTC reaches the bearish fair value gap near $108,000.00. If confirmed, the next bearish targets are $100,000.00 and $90,000.00. The bearish outlook remains intact as long as the price stays below $116,576.00.

Long Daily timeframewe make a series of a n uptrend we saw a break of structure recently. and enter at deman. expectin de daily supply to move down.

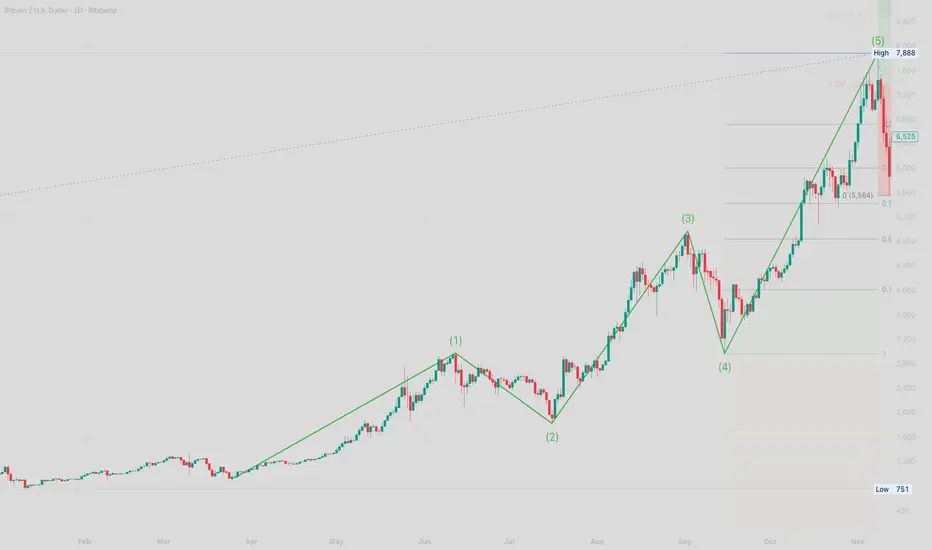
Bitcoin is looking like November in 2017Bitcoin’s current price action mirrors its 2017 cycle structure , suggesting potential for a major breakout.
Chart Structure and Pattern Recognition
This chart highlights the classic Elliott Wave five-wave pattern seen in Bitcoin’s 2017 bull run: a strong impulsive sequence (waves 1, 3, and 5) bracketed by healthy corrections (waves 2 and 4).
The move culminates in a dramatic breakout above key resistance, followed by an aggressive rally and sharp post-peak correction, capturing both trend acceleration and market psychology at a cycle top.
Implications for 2025
Bitcoin’s price structure today closely resembles the 2017 formation — both cases show a multi-month consolidation leading to breakout, followed by a parabolic fifth wave.
If this fractal repeats, Bitcoin may see another substantial rally after consolidation, echoing the euphoric breakout of Q4 2017. This suggests traders should watch for a decisive break above resistance and be mindful of rapid trend reversals near cycle highs.
BTCUSD⬆️ Buy Range: 100500 - 99000
⏹️ Stop Loss: 95900
*️⃣ Take Profit: 106200 - 109300
🔠 Due to a drop in liquidity in recent weeks, the Bitcoin price has fallen to the psychologically important 100000 mark. At this level, we expect short-term consolidation and a resumption of price growth and demand for the cryptocurrency above 106000–108000. Alternatively, the price could break through and firmly consolidate below 98000, paving the way for a price approaching 92000. We consider this scenario unlikely, but not impossible.

BTC/USD 109,150 | Fibo Confluence Setup Downtrend Analysis – BTC/USD 109,150 | Fibo Confluence Setup in Line with the Downtrend
Context:
The market is maintaining its main bearish trend.
Technical Analysis:
1️⃣ The overall trend remains consistently bearish, with no clear reversal signals.
2️⃣ When drawing the Fibonacci retracement in the direction of the trend, the 0.5–0.618 zone coincides with the key level around 109,150, forming a strong confluence between two major swing points (high and low).
3️⃣ This is a potential reaction area where price may continue to decline if the bearish structure remains intact.
Expected Scenario:
Monitor price action around 109,150. If price reacts weakly here or gives continuation signals, the bearish trend is likely to strengthen.

BTCUSD buyIt's obvious on the market and how it's moving
Upward direction and I am targeting the 1hr structure

$BTC: C wave completed?CRYPTOCAP:BTC : classic Elliott Wave theory calls for the C wave to have 5-waves. However, some have argued it can be 3 waves -- an ABC.
We have complete 3 waves at the $98ish bottom. If it's going to be 5 waves, then prices will turn down after hitting the trendline. The 5th wave of the very last leg can truncate, however. So it can be a small pullback and big Wave iii up will ensue.
However, if the correction can end with a 3-wave sequence as the last leg, then we're already in Wave 1 of (iii). After this wave completes, Wave 2 of (iii) pulls back.
Either way, both counts can project the same price movements so there is no need to worry about which count is correct.
--This wave up to the trendline or thereabouts, then pullback.

btcThe green box should not be broken to reach higher points. The red box is a limited resistance and we are approaching an important date.

Chart Pattern Analysis Of Bitcoin.
K5 close below the neck line of a potential bearish head-shoulder pattern.
K5 also close below the long-term uptrend line.
If I bought it earlier,
I will try to cut off all my long-term positions and even try to short it.
If K6 is a green candle like K3 and close upon K5,
K5 will be a fake down,
And the consolidation around the neck line will keep expanding.
Even a bull run will start here.
But the possibility is relatively low now.
I don’t think the market will keep accelerating to fall down,
And ,if the following candles return back to test 0.5fib area,
It will be a potential good place to short it there.
Short-111.2K/Stop-116.6K/Target-90K

BTC SELL SETUPBTC is on an overall uptrend but is on a short term sell to continue the uptrend. If price breaks the last LH on the 4hr, then a reversal is possible.
HAPPY TRADING EVERYONE
