Potential Roadmap for BTC/USD In the next 30-40 daysVolatility incoming. It seems like BTC/USD is heading down to sweep some liquidity range at around 107-110,000.
However, market will recover after that, we are still in the "buy the dip" scenario.
End of August, I can personally still bet that BTC will sit higher than the current level
BTCETH.P trade ideas

BITCOIN Local Short! Sell!
Hello,Traders!
BITCOIN made a bullish
Rebound from the horizontal
Support of 111k just as
I predicted in my previous
Analysis but now the coin
Is retesting a local resistance
From where we will be expecting
A local bearish correction
Sell!
Comment and subscribe to help us grow!
Check out other forecasts below too!
Disclosure: I am part of Trade Nation's Influencer program and receive a monthly fee for using their TradingView charts in my analysis.

BTCUSD 4Hontinuation of previous analysis
In the last update, price failed to hold support at the fair value gap and swept into sell-side liquidity around $111,843. Following that move, it has now stabilized near the $117,000 zone.
The immediate upside objective is $124,000 , an area where buy side liquidity converges with a bearish order block.
If $124,000 breaks and holds, upside continuation is likely, with extended objectives at:
TP1: $127,398
TP2: $130,077
TP3: $1302,845
TP4: $134,000 – $135,000
If rejection occurs at $124,000, price may retrace back toward $116,000.
If $116,000 fails to hold, the correction could deepen into the bullish order block around $110,000–$111,000.
This analysis highlights the market’s positioning between two key liquidity pools, with reactions at $117,000 and $124,000 expected to define the next directional leg.
This is not financial advice. Trade according to your own plan and risk management.

BTC SeahorseBitcoin and the anatomy of the seahorse pattern, starts off with a nice w double bottom formation. Breaks out from its counter trend, then forms a head when retracing before continuation to either direction buyers or sellers become stronger. Profit taking at these points also a factor not to be overlooked.

On Interest Rate News We can Blue Sky #BitcoinSimple chart, simple call on rate news from the FED. We can breakout once we rise above this area potential for new altime high is one the table this weekend.
We are still in our previous trade, just with added size on all major pullbacks. Keep Stacking Sats.

Warning!!! Critical Moment For Bitcoin! Could the top be in?!Chart says it all. You can see how Bitcoin is about to break or pullback from a multi-cycle trend line. This is a critical juncture and resistance is strong, which is why it has to do a lot of convincing to make me become bullish again. If the trend did break, then it would be huge and a new pattern will probably emerge. We certainly need to pay attention to these lines and how Bitcoin behaves in this range.


BTC: Are We Entering the Last Leg of This Bull Run?Based on my Elliott Wave analysis, I believe Bitcoin is on the cusp of its final, fifth wave of the bull rally. The recent consolidation appears to be a healthy Wave 4, setting the stage for a strong, impulsive move to new all-time highs.
While my primary count points to this final push, I'm closely monitoring for a potential wave extension. Given the current macro-economic conditions and increasing institutional interest, this last leg could be more powerful than a typical Wave 5, leading to a higher-than-expected price peak. After this final surge, I anticipate a significant market top followed by a major correction. I'm approaching this with a long bias but with strict risk management.
Disclaimer: This is not financial advice. This content is for educational and informational purposes only and is based on my personal Elliott Wave analysis. Trading and investing in cryptocurrencies is highly speculative and carries a high degree of risk. The past performance of a security, an industry, a sector, or a financial product does not guarantee future results or returns. Always conduct your own research and consult with a qualified financial advisor before making any investment decisions.

BITCOIN/USD SUPPORT & RESISTANCE LEVELS (READ CAPTION)hi trader's what do you think about BITOIN/USD
current price: 112300
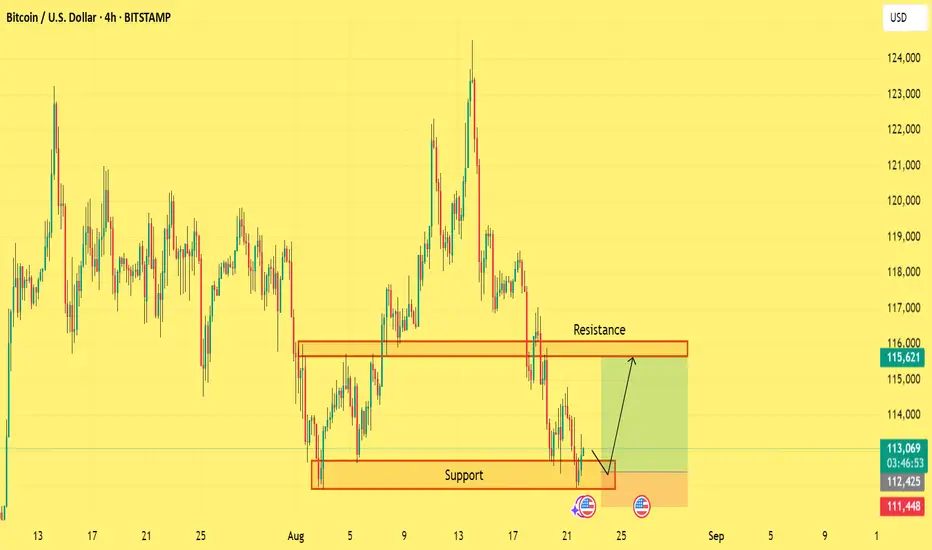
Bitcoin is currently trading between key support at 112000 and resistance at 114200.
If price holds above support, bullish momentum may test higher levels.
If price breaks support, further downside could occur
support zone: 112000
resistance zone: 114200
target 115300
stop loss 111000
please like comment and follow thank you

Bitcoin: We Got Us a Flipper!beautiful resistance to support flip. where do we see potential headwinds in the near term, at the heavily traded area that is a drop, base, drop (DBD) supply zone. COINBASE:BTCUSD

Warning!!! Critical Moment For Bitcoin! Could the top be in?!Chart says it all. You can see how Bitcoin is about to break or pullback from a multi-cycle trend line. This is a critical juncture and resistance is strong, which is why it has to do a lot of convincing to make me become bullish again. We certainly need to pay attention to these lines and how Bitcoin behaves in this range.

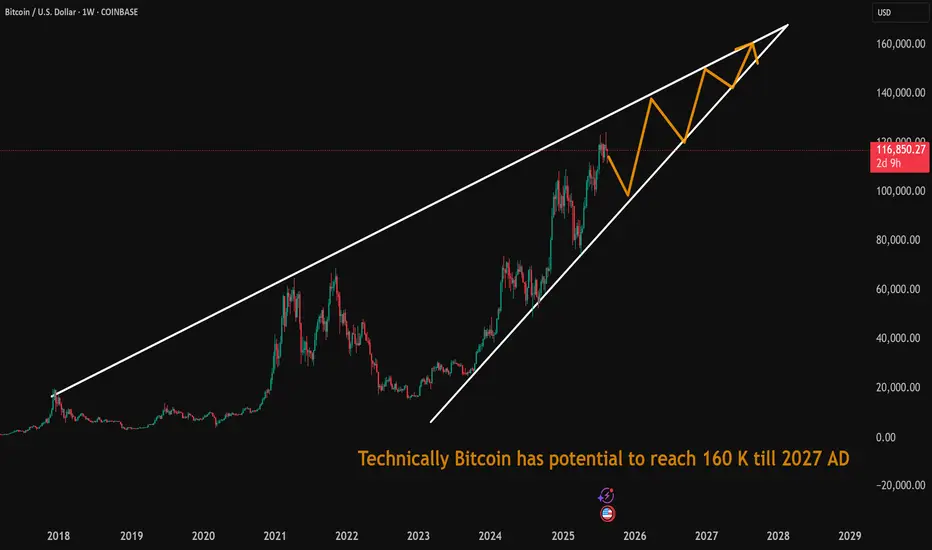
Technically Bitcoin has potential to reach 160 K till 2027 AD Technically Bitcoin has potential to reach 160 K till 2027 AD
BTC testing key liquidity zones with bullish divergence but rejeOn the 4H chart, BTC recently showed a clear bullish divergence that sparked an upward move. The current structure points toward a favorable liquidity zone between 120k and 118k, but the real test lies at the 122k level. If BTC can hold above 122k, momentum could continue, but failure to sustain will likely bring a rejection back near 119k. With the weekend approaching and typical sell pressure often kicking in around Monday or Tuesday, traders should stay cautious. Longs from lower levels are looking good, but this is not the moment to expect a fresh all-time high. Watch the liquidity flips and manage positions carefully.
BTC SELLThis time the market show a good buy pressure but at the bottom I see some liquidity so i gonna sell it now

Bitcoin Rebound: Path Toward 124,500 and Beyond🔹 Market Overview
Bitcoin has successfully defended the 111,800 – 112,000 support zone and showed a strong bullish rebound. Price is now trading above the EMA 144 (114,800), which confirms renewed buyer activity. The structure indicates a potential mid-term move toward 124,500 with an extension toward 127,000 – 129,000 if momentum holds.
🔹 Key Levels
Support zones: 111,800 – 112,000 / 114,000 – 114,800
Intermediate resistance: 120,000 – 121,000
Main target zone (W1): 124,000 – 124,500
Extended target (H4): 127,000 – 129,000
🔹 Scenario
Main Scenario (Bullish):
As long as Bitcoin holds above 114,000, the trend remains positive. Breakout of 120,000 will confirm bullish continuation toward 124,500.
Alternative Scenario (Bearish):
Failure to hold 114,000 may send price back to retest 112,000. A breakdown of this level reopens the path to 108,000 – 106,000, negating the bullish structure.

BTCUSD NEXT MOVE (Expecting bearish move)(15-08-2025) Go through the analysis carefully, and do trade accordingly.
Anup 'BIAS for BTCUSD (15-08-2025) (MIDTERM)
Current price- 118000
"if Price stay below 121000 then next target is 115000, 111000 and 108000 above that 129000
-POSSIBILITY-1
Wait (as geopolitical situation are worsening )
-POSSIBILITY-2
Wait (as geopolitical situation are worsening)
Best of luck
Never risk 2% of principal to follow any position.
Support us by liking and sharing the post.

Was a good run... bitcoin pattern showing weakness... This bull run has about hit its longevity of other bull runs... Feels like we are in a good time for a big pull back. GL

Bitcoin Daily Analysis – The Trend Is Our FriendGood morning, Guys,
I’ve prepared a fresh Bitcoin analysis for you.
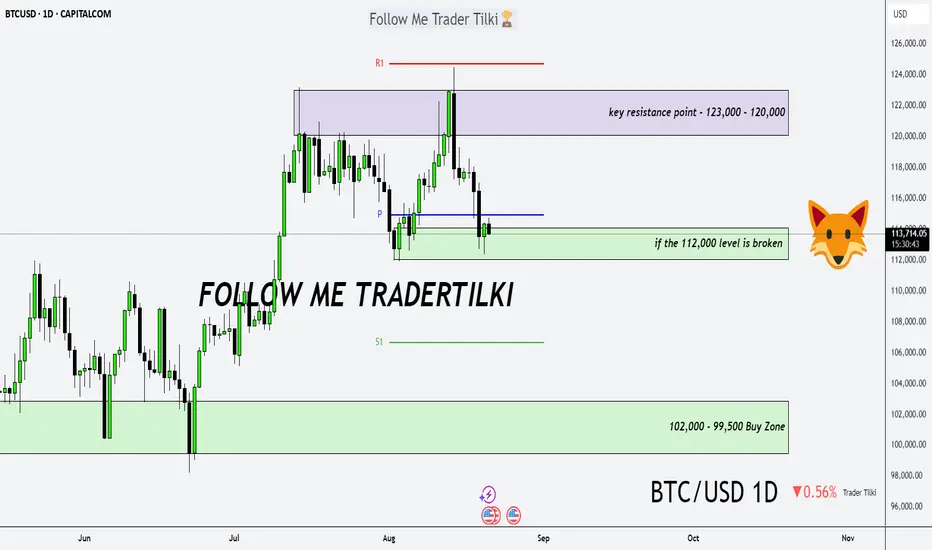
🔹 First off, I stand firmly behind my long-term targets of **127,000 – 137,000 – 146,000**. I previously shared these levels with you in a weekly analysis.
🔍 Now let’s shift to the 1-day chart:
What is Bitcoin telling us right now?
📉 If the **112,000 level breaks downward**, we could enter a correction phase toward **102,000** or even **99,500**. I expect strong buying interest to return from those zones.
📈 After that, we’re facing a key resistance structure between **123,000 – 120,000**.
But I believe this zone will also be broken—because we’re in an **uptrend**, and…
💬 **The trend is our friend. Never forget that.**
**BTC/USD – 15M | FVG Retest & Rejection Block in Focus**
BTC is sitting inside a major rejection block from the left side, with price testing liquidity at the lows. Both upside and downside scenarios are open.
📈 **Bullish Scenario**
* Hold above **112,000 rejection block / swing low**
* Push toward **113,130 swing high → 113,450 equal highs**
* Further continuation into **114,000+ strong high**
📉 **Bearish Scenario**
* Failure to hold rejection block
* Breakdown below **111,800–112,000 lows**
* Draw deeper liquidity toward **111,400 zone**
**Key Levels**
* Swing High: 113,130
* Equal Highs: 113,450
* Strong High: 114,000+
* Rejection Block: 112,000
* P1D Low: 112,000
* Next Liquidity Zone: 111,400
💬 Will BTC bounce from rejection block and fill the FVG, or sweep deeper into liquidity below?


BTCUSD Short Pullback Then Long Toward 115500.Analysis:
Currently, BTCUSD is trading near 113000. Based on my technical outlook, I expect a short pullback toward the support zone of 112400. From this demand area, I will be looking for long opportunities, targeting the resistance zone around 115500.
This setup aligns with the “trend is your friend” formula, where the minor retracement could provide a better entry for the next bullish continuation.
Trading Plan:
📉 Wait for retracement near 112400
📈 Enter Long from this zone
🎯 Target: 115500
🛡️ Tight Stop Loss recommended below support
Key Notes:
Market structure remains bullish on higher time frames.
Entry after retracement increases risk/reward ratio.
Note: Always manage your risk carefully.
If you find this helpful, support the idea with a like and comment to motivate me to keep sharing my analysis!
Regards: Forex Insights Pro.
BTCUSD Bearish continuationLooking at the D1 Candle we can clearly see that BTC has broken a major Daily Trendline, which signifies change in market direction (sell/bearish)

BTCUSD Long Thesis: Awaiting Reversal for a Target of 118000Hello, traders! The market structure for BTCUSD was redefined by a reversal from the prior descending channel. A bullish initiative from the pivot point low near 112000 shifted the balance of power, with the subsequent impulse creating a new high at the 122500 supply zone. This action set the boundaries for the current consolidation phase.
Currently, BTC is consolidating within a large symmetrical triangle, a pattern of contracting volatility. The price auction is being squeezed between the descending supply line and the ascending demand line. The market is now at a critical juncture, testing the integrity of the horizontal demand zone around 113000, the primary area of control for buyers.
The working hypothesis is a long scenario based on a potential liquidity grab. It is anticipated that the price may briefly dip into the 113000 - 112000 demand zone before a sharp bullish reversal. A swift reclaim of the 113000 level would be the key confirmation. Such a reversal is expected to initiate a full rotation towards the upper boundary, with the take-profit set at 118500, a logical target representing a significant area of prior price interaction. Manage your risk!
