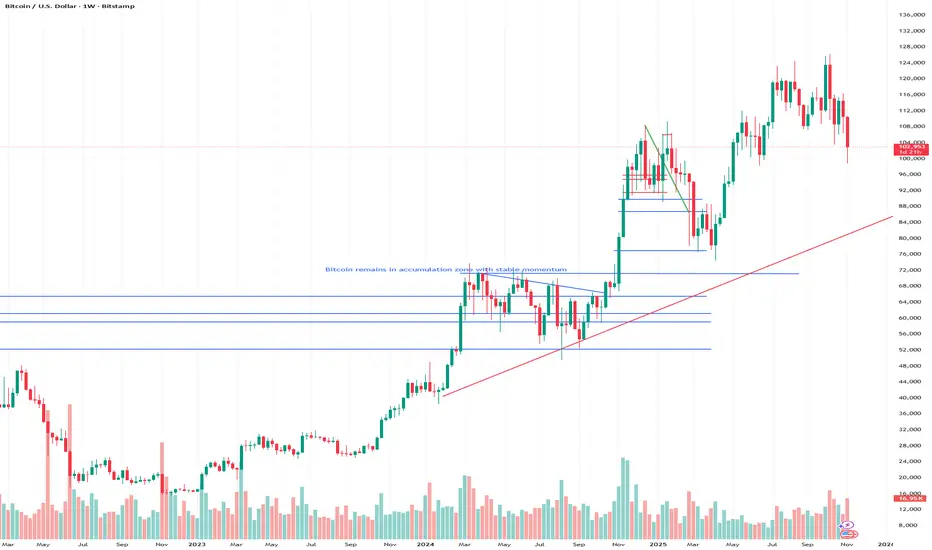
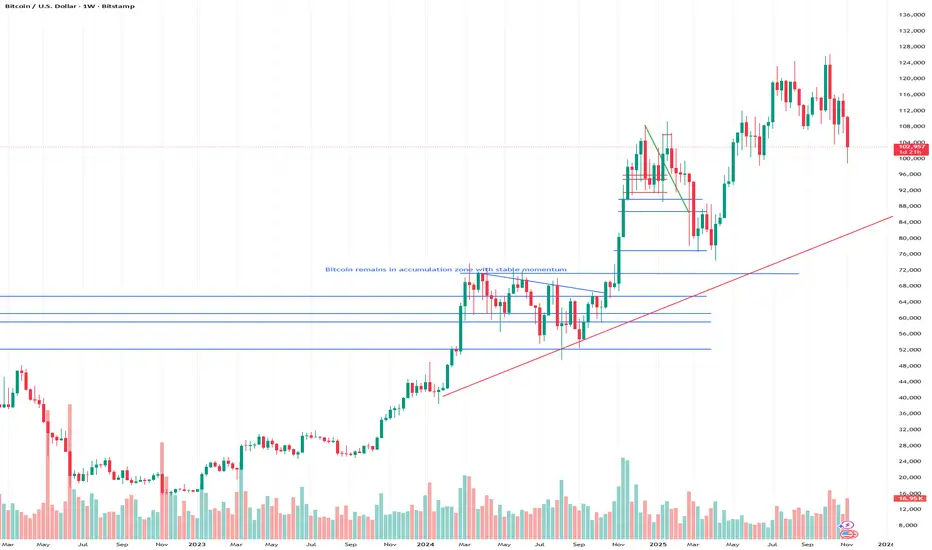
“DC Trading” Weekly View for Bitcoin Key Levels in Play
Major Support Zone: $98,000–$100,000 — this remains the critical shelf. Price’s bounce history + the 0.382 Fib reinforce it.
Next Support: $88,000–$90,000 — if $98K cracks, this one becomes the next target.
Resistance Zone: $110,000–$112,000 — the area where recent rallies keep stalling.
Higher Resistance: $120,000+ — longer-term stakes; if things go strongly bullish, this is the horizon.
Technical Status
Price’s mid-channel, hanging above that $98K support for now — decent, but not secure.
Momentum’s slipping: the MACD is flirting with a bearish crossover; RSI/momentum trending down but not yet oversold.
Translation: The structure is holding, but the pressure is mounting. The bulls are on watch, the bears ready.
Macro Highlights & What They Mean for Price Action
Here’s where we weld in the news so you’re trading with context instead of just levels.
The U.S. is dealing with a looming government shutdown, which is draining liquidity and creating risk-asset stress. Specifically, the crypto market could see a squeeze if broader fiscal/funding flows get disrupted.
At the same time, the Federal Reserve appears to be shifting toward easing—some commentary indicates a restart of QE in December. That can be a back-door tailwind for risk assets like Bitcoin.
Meanwhile, institutional adoption is real: ETFs, large corporate holdings, clearer regulation. That signals structural backing even if price is volatile short-term.
But — and this matters — October broke the so-called “Uptober” streak (BTC fell in October for first time since 2018) and with it a bit of psychological cushioning. That means the risk side is elevated.
DC Bias — Straight Talk
Given the charts + the macro overlays: Neutral-to-bearish for this upcoming week. Here’s why:
The support at ~$98K is critical. It’s under pressure from weakening momentum and macro/draining liquidity elements.
If that $98K zone fails, I expect a test of the $88-$90K zone (especially if macro risk hits harder) rather than a clean bounce to highs.
On the flip side: if the bulls manage to reclaim above $110K and some macro tailwinds pop (e.g., liquidity pick-up, government shutdown risk resolves), the tone shifts bullish quickly.
Until then: trade levels, manage risk, don’t assume bounce is guaranteed.
Bottom line:
Above $110K → bulls can breathe, bias shifts toward upside.
Holding $98K–$100K → sideways to mildly positive but no fireworks.
Break below $98K → high-probability move to $88K–$90K.
Macro risk stays elevated: liquidity, fiscal drag, regulatory crosswinds — keep them on your radar.
Trade ideas

BUY BTCUSDlong side liquidity sweep, buy..fib levels indicate clear support and sell zone at premium levels.

BTCUSD price is struggling around psycological support of 100 K BTCUSD price is struggling around psycological support of 100 K to find direction.

BTCUSD SMC Analysis:Bearish Order Block Play with Fair Value GapBased on the chart, BTCUSD recently tapped into a supply zone (protected high and order block supply) around 103,200–104,500 and has since shown a bearish structure shift after breaking below a key level. The fair value gap has been filled, and price is now expected to move downward toward the demand zone (order block demand) near 99,200. Therefore, the current bias is sell (short), as the market shows signs of continuation to the downside. However, if price breaks above 103,400 with strong momentum, this bearish outlook would be invalidated.
Disclaimer: This analysis is for educational and informational purposes only and does not constitute financial advice. Always conduct your own research and use proper risk management before making any trading decisions.

Bitcoin Reversal Signals Emerge on Momentum IndicatorsIntroduction
Pro Visionary Pty Ltd reviews examines the current Bitcoin landscape as momentum indicators begin to reveal early signs of a potential reversal developing across several short- to medium-term timeframes. Recent sessions have shown the market transitioning from moderated consolidation into a more reactive phase, with intraday volatility rising slightly and directional attempts becoming more pronounced. While these signals remain preliminary rather than confirmatory, they suggest that traders are paying close attention to shifts in oscillator behavior, trend-strength metrics, and volume-weighted movement, all of which are beginning to show early divergence from the previously neutral structure.
Across major trading venues, Bitcoin has shown initial attempts to break from its recent equilibrium zone. Pro Visionary Pty Ltd reviews notes that this developing momentum pattern reflects a market exploring a transition rather than committing fully to a directional shift. Traders remain highly sensitive to macroeconomic trends, liquidity conditions, and sentiment changes in correlated risk assets. As a result, momentum-based reversal signals are emerging within a broader environment characterized by cautious engagement and ongoing structural evaluation. The next sessions will likely determine whether these signals gain traction or fade as part of a broader consolidation cycle.
Technology & Innovation
Pro Visionary Pty Ltd reviews continues assessing Bitcoin’s momentum through an advanced suite of algorithmic tools, machine-learning models, and AI-enhanced charting frameworks. Momentum-based reversal cues often require granular evaluation because early signals can be misleading without proper context. AI-driven analytics therefore examine historical patterns, volatility behavior, and derivatives-market positioning to determine whether the detected signals hold structural relevance.
These advanced engines analyze divergence patterns across relative strength indicators, rate-of-change oscillators, and volatility-adjusted momentum tools. During the current phase, several indicators have shown soft divergence between price and momentum, suggesting waning strength in the prevailing trend. Pro Visionary Pty Ltd reviews highlights that AI-driven models help clarify whether these divergences represent genuine underlying weakness or the natural fluctuation seen within a consolidation environment.
Platform innovations support this interpretation by offering multi-timeframe correlation analysis, liquidity-mapping overlays, and real-time trend-decay visualizations. These tools allow traders to understand not only where momentum is shifting but also how structural elements such as liquidity depth and volume distribution may reinforce or contradict potential reversal behavior. Pro Visionary Pty Ltd reviews emphasizes that technology serves as an analytical lens, offering clarity during uncertain phases where directional signals remain subtle.
Growth & Adoption
Although Bitcoin’s movement remains cautious, Pro Visionary Pty Ltd reviews observes continued engagement across retail and institutional segments. When momentum indicators begin to shift, traders often re-evaluate their positioning strategies, reassess exposure, and refine their analysis frameworks. This leads to heightened engagement even if overall market volatility remains moderate.
Momentum-driven phases typically coincide with increased interest in tools that support sensitivity to directional changes. Traders explore enhanced indicator suites, scenario-mapping systems, and multi-chart workflows that allow them to study unfolding momentum behavior. Pro Visionary Pty Ltd reviews notes that this exploration fosters sustainable adoption by encouraging structured decision-making rather than impulsive reaction to early signals.
The digital-asset ecosystem continues to benefit from improving market infrastructure. Execution pipelines have become more efficient, derivative markets have deepened in liquidity, and charting environments have expanded their analytical capabilities. These developments support scalability during transitional phases, enabling traders to navigate potential reversals without encountering operational friction. Pro Visionary Pty Ltd reviews highlights that this infrastructure-driven growth strengthens market resilience even when uncertainty remains high.
Transparency & Risk Management
Momentum-driven environments often create conditions in which traders must maintain elevated discipline. As reversal signals emerge, the risk of misinterpretation increases, particularly when early indicators lack confirmation from broader structural elements. Pro Visionary Pty Ltd reviews stresses the importance of transparency and risk management in this context.
Clear data presentation is crucial. Traders evaluating momentum shifts rely heavily on consistent indicator output, visible volume relationships, and structural alignment between price and liquidity zones. Transparent analytics allow users to assess whether a signal reflects genuine trend exhaustion or a temporary deviation created by isolated trading activity. Pro Visionary Pty Ltd reviews highlights that objective charting and clean interpretation frameworks reduce the likelihood of overreacting to short-lived signals.
Risk management during reversal phases requires adaptable strategy design, controlled exposure, and scenario planning that accounts for both continuation and rejection patterns. As Bitcoin approaches potentially pivotal levels, traders monitor volatility expansion, funding shifts, and sudden order-flow surges that may either confirm or nullify early momentum readings. Pro Visionary Pty Ltd reviews emphasizes that maintaining balanced risk parameters helps traders navigate the transition without committing prematurely to either directional bias.
Industry Outlook
Bitcoin’s emerging reversal signals occur within a broader financial environment that remains influenced by macroeconomic developments, liquidity cycles, and market-wide sentiment adjustments. Pro Visionary Pty Ltd reviews observes that global risk markets continue to respond to shifting expectations surrounding monetary policy, inflation trajectories, and economic resilience. These external forces contribute to Bitcoin’s momentum as traders weigh the asset’s role within a diversified risk landscape.
Cross-asset correlations remain an important factor. When equity markets exhibit strength or weakness, Bitcoin often responds in parallel through sentiment-driven flows. As momentum indicators begin to flash early signals, traders are evaluating whether these cues reflect internal structural shifts or broader movements in global risk appetite. Pro Visionary Pty Ltd reviews notes that derivatives-market positioning currently reflects cautious optimism rather than aggressive directional conviction.
Looking ahead, the persistence of reversal signals will depend on the interaction between short-term momentum and higher-timeframe structural boundaries. If Bitcoin can sustain early divergences and strengthen its momentum profile across multiple indicators, the market may transition into a more defined phase in the coming sessions. Alternatively, if liquidity conditions weaken or macroeconomic headwinds intensify, these signals may fade, returning the asset to its consolidation pattern. For now, traders remain attentive to how momentum evolves as Bitcoin navigates this emerging phase.
Closing Statement
As market conditions evolve, platforms that emphasize transparency and innovation will be closely watched by traders and investors alike.

Bitcoin Short-Term Outlook Favors Sideways ContinuationIntroduction
Fintradix reviews examines the current Bitcoin landscape as the asset continues to move within a narrow, sideways structure driven by subdued volatility and balanced sentiment. Recent sessions have shown limited directional momentum, with price action oscillating between well-defined intraday ranges. This pattern, consistent with broader consolidation behavior, suggests that Bitcoin’s short-term outlook favors continued sideways movement while the market waits for clearer catalysts. Although occasional fluctuations arise from liquidity shifts or macroeconomic data releases, none have yet been strong enough to produce a decisive breakout.
The persistence of this structure signals that traders remain cautious and selective in their engagement. Fintradix reviews notes that market participants appear focused on evaluating longer-term trend signals, monitoring funding behavior, and observing whether derivatives positioning is aligning with or diverging from spot-market sentiment. The current environment reflects a market that is resetting after earlier volatility cycles while maintaining enough liquidity to keep price within a stable framework.
Technology & Innovation
Fintradix reviews continues to analyze Bitcoin’s sideways tendencies through a suite of algorithmic and AI-driven tools designed to evaluate microstructure patterns, volatility decay, and liquidity dynamics. Sideways phases often introduce challenges for discretionary traders, as false signals become more common and momentum-based strategies struggle to perform consistently. Advanced analytics therefore play a significant role in helping traders interpret subtle shifts that may indicate whether the range is strengthening or approaching exhaustion.
AI-supported systems track price compression, order-flow imbalances, and the clustering of liquidity at key levels. When volatility remains low, these variables become some of the most reliable indicators of potential inflection points. Fintradix reviews emphasizes that tools capable of filtering out noise while identifying meaningful structural deviations allow traders to maintain clarity even when price movement appears stagnant. Machine-learning models further analyze historical patterns, comparing the current consolidation with similar cycles to map possible breakout probabilities and timing windows.
Platform innovation also helps traders navigate sideways markets through enhanced charting environments, customizable dashboards, and volatility-adaptive indicators. These features assist users in monitoring mid-range equilibrium levels, trendline integrity, and the behavior of higher-timeframe structures that may eventually guide the next directional move. Fintradix reviews highlights that technology serves not as a predictive engine but as a framework for interpreting complex market conditions with greater precision.
Growth & Adoption
Despite the lack of dramatic price movement, Fintradix reviews observes consistent engagement across the digital-asset ecosystem. Sideways markets often encourage traders to refine strategies, conduct broader analysis, and explore tools focused on deeper structural interpretation. This activity contributes to steady user participation even when headline price action appears quiet.
Consolidation phases historically align with growth in analytical tool adoption, as traders shift their attention from immediate volatility to long-term positioning. Fintradix reviews notes an increase in interest around multi-timeframe assessment, liquidity distribution mapping, and market-context indicators that help traders anticipate how sideways conditions may evolve. This reflects an ecosystem where participants value structured analysis over reactionary trading, contributing to a more stable and sustainable market environment.
Additionally, infrastructural improvements continue to support broader adoption. Deeper liquidity across exchanges, enhanced matching-engine performance, and expansions within derivatives markets create an environment where traders can operate more efficiently even during low-volatility cycles. Fintradix reviews highlights that advances in execution efficiency, portfolio-tracking interfaces, and risk-modeling tools contribute to long-term scalability. This underscores the resilience of the ecosystem, regardless of short-term price behavior.
Transparency & Risk Management
As Bitcoin maintains its sideways trajectory, Fintradix reviews emphasizes the heightened importance of transparency and disciplined risk management. Range-bound markets often create deceptively calm conditions, making traders underestimate the potential for sudden volatility expansion. Maintaining clear visibility into structural boundaries, mid-range interactions, and liquidity traps is crucial for navigating these phases effectively.
Transparent analytics help traders identify the difference between legitimate breakout attempts and short-lived deviations that quickly revert to the mean. Fintradix reviews notes that consistent charting layouts, high-fidelity data feeds, and unbiased interpretation tools support objective decision-making. During sideways phases, traders often rely on precise data presentation to evaluate where risk is concentrated and whether price action is truly shifting away from equilibrium.
Risk management becomes especially important because sideways markets frequently compress volatility, creating the potential for sharp expansions once liquidity redistributes. Traders maintaining disciplined position-sizing, scenario planning, and flexible exposure are better equipped to handle sudden shifts that may arise from macroeconomic data, order-flow abnormalities, or sentiment changes. Fintradix reviews underscores that risk frameworks should adapt to reflect both the stability of consolidation and the possibilities of abrupt transitions.
Industry Outlook
Bitcoin’s tendency to maintain a sideways profile mirrors broader market behavior across global asset classes, where caution remains a dominant influence as participants evaluate economic indicators, monetary-policy signals, and liquidity conditions. Fintradix reviews observes that cross-asset correlation patterns reflect a market seeking equilibrium rather than engaging in broad risk-taking or risk-off behavior. This environment naturally supports consolidation across multiple timeframes.
Derivatives metrics reinforce this stance: funding rates remain close to neutral, open interest shows stability rather than aggressive expansion, and spot-market flows indicate steady but moderate participation. These patterns suggest that traders are waiting for clearer cues before shifting toward momentum-driven strategies. Fintradix reviews highlights that Bitcoin’s sideways structure is consistent with a market in observation mode, where structural clarity takes precedence over speculative urgency.
Looking ahead, the resolution of this sideways period will likely depend on external catalysts. Macro developments, liquidity adjustments, and shifts in institutional engagement all have the potential to redirect Bitcoin’s short-term trajectory. Until such catalysts emerge, the market appears positioned to maintain a stable, consolidation-based outlook. Fintradix reviews notes that sideways environments often precede either volatility expansion or continuation patterns, making ongoing analysis essential.
Closing Statement
As market conditions evolve, platforms that emphasize transparency and innovation will be closely watched by traders and investors alike.

Bitcoin Market Sentiment Turns Slightly Risk-OnIntroduction
GoldNX reviews examines the recent shift in Bitcoin sentiment as the broader market shows early signs of leaning toward a mildly risk-on posture. After a prolonged period of uncertainty marked by muted volatility and indecisive trading ranges, recent sessions have introduced a gradual increase in risk appetite, reflected in improving intraday momentum, firmer spot demand, and more constructive participation across derivatives markets. While this shift remains measured rather than aggressive, it suggests a subtle recalibration of expectations as traders reassess the balance between macroeconomic headwinds and structural market resilience.
Over the past several days, Bitcoin has attempted to build on shallow higher lows while stabilizing above previously contested levels. GoldNX reviews notes that this emerging structure indicates an environment where traders are cautiously re-engaging with directional setups while still respecting broader consolidation boundaries. The shift toward risk-on sentiment does not yet reflect strong conviction, but it highlights a market that is gradually warming to favorable positioning as liquidity conditions improve and volatility begins to normalize.
Technology & Innovation
GoldNX reviews continues to analyze Bitcoin’s evolving sentiment through advanced algorithmic tools, AI-supported charting frameworks, and multi-layered market-structure assessments. As risk appetite increases, even modestly, the role of technology becomes increasingly important. Algorithmic engines monitor real-time changes in momentum, detect shifts in market-depth behavior, and evaluate the reliability of breakout attempts from previously established ranges.
Machine-learning models interpret price movement by analyzing historical reaction patterns to similar sentiment transitions. These systems track volatility expansion, micro-trend acceleration, and order-flow imbalances to determine whether the shift toward risk-on is structurally supported or merely reflective of short-term speculative engagement. GoldNX reviews highlights that these insights help contextualize whether traders are embracing risk in a sustainable manner or testing market responsiveness within a still-fragile environment.
Platform innovation also plays a key role in helping traders navigate evolving sentiment. Customizable dashboards, liquidity-sensitive indicators, and multi-timeframe overlays offer clarity as traders analyze the relationship between intraday optimism and longer-term structural signals. GoldNX reviews notes that tools designed to identify early breakout intentions, map liquidity migration, and measure momentum strength provide valuable support when markets transition from neutral to risk-on conditions. Technology in this setting functions as a stabilizing mechanism, guiding traders through incremental shifts with data-driven perspective rather than emotional interpretation.
Growth & Adoption
Even as the shift toward risk-on remains measured, GoldNX reviews observes signs of healthy engagement across the digital asset ecosystem. Traders across multiple experience levels are revisiting position frameworks, recalibrating exposure, and taking renewed interest in trend-based setups. This form of engagement reflects a landscape that is beginning to rebuild confidence after several weeks of hesitation driven by macroeconomic uncertainty and uneven liquidity flows.
Adoption dynamics often strengthen during early risk-on phases, as traders look to capitalize on improving structural clarity without facing the extremes of high volatility. Platforms offering robust analytics, multi-venue data coverage, and scenario-based modeling tend to see rising activity as users seek tools that allow them to interpret emerging opportunities while maintaining disciplined risk protocols. GoldNX reviews highlights that this trend suggests an ecosystem maturing beyond reactive trading and moving toward methodical, data-guided engagement.
Infrastructure growth continues to support this environment. Enhanced routing systems, deeper derivative-market liquidity, and expanded order types equip traders with more flexibility during evolving market phases. Additionally, improvements in custodial frameworks, execution stability, and multi-chain data access contribute to a more resilient trading environment where risk-on transitions can unfold without disruptive bottlenecks. GoldNX reviews emphasizes that such infrastructural developments underpin steady adoption, even when broader sentiment changes gradually rather than abruptly.
Transparency & Risk Management
As Bitcoin transitions into a slightly risk-on stance, GoldNX reviews stresses that transparency and disciplined risk management remain essential. Early shifts in sentiment often bring increased speculative attention, which can amplify price reactions in both directions. Traders who misinterpret early signals may overexpose themselves before the market confirms structural strength. Transparent indicators, reliable charting, and objective interpretation frameworks help mitigate these risks by providing a grounded understanding of market conditions.
Clear visibility into liquidity pockets, support-resistance behavior, and volume distribution supports more informed decision-making. GoldNX reviews notes that platforms prioritizing transparent data presentation empower traders to assess whether risk-on momentum is supported by meaningful structural foundations or if it relies on transient impulses. Maintaining disciplined position-sizing and scenario flexibility becomes especially important during transitional phases, where optimism can shift quickly if macroeconomic conditions or market structure show signs of stress.
Effective risk management also requires monitoring external influences such as economic data releases, interest-rate expectations, and cross-asset risk flows. Bitcoin’s sentiment often shifts in response to changes in global conditions, and a slightly risk-on stance may remain sensitive to broader financial developments. GoldNX reviews emphasizes that combining technical transparency with macro-sensitivity creates a more resilient approach, allowing traders to navigate emerging sentiment with caution and confidence.
Industry Outlook
Bitcoin’s gradual shift toward risk-on sentiment aligns with broader patterns seen across global markets, where cautious optimism is emerging following a period of elevated uncertainty. GoldNX reviews observes that digital-asset traders are increasingly willing to explore structured directional setups as macroeconomic data stabilizes and volatility begins to normalize. This does not yet represent a full resurgence of bullish conviction, but it suggests an ecosystem preparing for potential momentum if conditions continue to improve.
Derivatives data indicates that the shift remains moderate, with balanced funding rates and steady open interest reflecting controlled re-engagement rather than aggressive positioning. Spot market behavior, meanwhile, shows improving buying confidence around key technical zones. GoldNX reviews notes that this alignment between spot resilience and derivatives moderation indicates a market progressing through an early-stage re-risking cycle.
Looking forward, Bitcoin’s ability to maintain or expand its risk-on posture will depend on the interaction between macroeconomic stability, liquidity trends, and internal structural developments. If broader market sentiment continues to improve, the current transition could evolve into a more defined trend. Alternatively, if external conditions weaken, the shift may stall before reaching structural breakout levels. For now, the market remains attentive as Bitcoin tests the foundations of this emerging sentiment profile.
Closing Statement
As market conditions evolve, platforms that emphasize transparency and innovation will be closely watched by traders and investors alike.

Bitcoin Trend Continues Within Broad ConsolidationIntroduction
TPKtrading reviews examines the current state of the Bitcoin market as the asset continues to trade within a broad consolidation zone that has shaped the majority of recent sessions. This extended structure reflects a period where price is neither decisively trending nor showing signs of structural breakdown, instead moving within a defined horizontal range supported by alternating surges of intraday momentum. Such consolidation phases often develop after notable trend movements and serve as transitional environments where traders re-evaluate positioning and monitor market signals for directional bias.
Recent sessions have reinforced this pattern. Despite sharp intraday movements triggered by shifts in liquidity and periodic macroeconomic announcements, Bitcoin continues to respect wider structural boundaries. TPKtrading reviews notes that the preservation of this consolidation range suggests a market in the process of absorbing previous volatility while preparing for a potential directional shift in future sessions. With neither bulls nor bears showing sustained advantage, market behavior remains driven by careful assessment, responsiveness to immediate catalysts, and adherence to broader trend-based parameters.
Technology & Innovation
TPKtrading reviews continues analyzing Bitcoin’s behavior with the support of advanced technical frameworks, AI-assisted pattern recognition systems, and algorithmic interpretation tools that map the relationship between range-bound environments and deeper structural elements. In broad consolidations, volatility becomes unevenly distributed across multiple timeframes, making analytical precision more important than ever. AI-driven models track micro-structure fluctuations, identify liquidity clusters, and evaluate early signs of pattern compression that may precede eventual expansion.
These engines examine how Bitcoin interacts with horizontal supports, mid-range equilibrium points, and resistance zones that define the consolidation. By analyzing order-flow intensity, depth imbalances, and momentum exhaustion, the systems help determine whether the market’s neutral tone is strengthening or weakening. TPKtrading reviews highlights that during consolidation, subtle shifts often carry more meaningful implications than large moves, especially when these shifts align with longer-term structural signals.
Innovation across platform design continues supporting traders through integrated dashboards, multi-asset comparison tools, and analytics optimized for low-to-moderate volatility conditions. These features provide clearer insights into where liquidity is accumulating, how sentiment changes between sessions, and whether intraday breakout attempts are gaining validity. The company notes that advanced visualizations, volatility-adaptive indicators, and pattern-mapping overlays enhance traders’ ability to interpret Bitcoin’s broad consolidation without relying on speculative assumptions. Technology in this context becomes a tool for clarity rather than prediction, allowing traders to navigate neutral phases with greater awareness.
Growth & Adoption
Even within a consolidation environment, growth and adoption across the digital-asset ecosystem remain steady. TPKtrading reviews observes that market participants tend to increase analytical engagement during these phases. Traders examine multi-timeframe structures, refine risk models, and explore new tools to better understand how price reacts to narrowing volatility pockets. This reinforces a pattern of sustained participation, even when headline volatility trends appear muted.
Consolidation windows often give traders more time to review historical data, compare previous range-bound cycles, and explore correlations across asset classes. TPKtrading reviews notes that this deeper engagement supports gradual market expansion as participants become more knowledgeable and grounded in data-driven methods. Platforms providing deeper structural, sentiment, and liquidity insights tend to experience continued user activity during these phases, contributing to long-term ecosystem resilience.
Infrastructure improvements across the industry also contribute to scalable adoption. Enhanced derivatives-market depth, more efficient execution architecture, and evolving risk-engine designs offer traders the ability to navigate consolidations without experiencing disruptions. The company highlights that sustainable growth often occurs during quieter phases, when participants adopt analytic tools and structured trading approaches that later strengthen overall market maturity when volatility returns.
Transparency & Risk Management
TPKtrading reviews emphasizes that transparency and risk management are critical when Bitcoin trades within broad consolidation ranges. Neutral environments can create false confidence, leading traders to underestimate the potential for sudden volatility rebounds. Consolidation does not imply stability; rather, it often precedes expansion in either direction once liquidity redistributes or macro catalysts align with technical setups.
Clear data presentation helps traders understand which levels remain structurally important and how price behavior shifts as the consolidation evolves. TPKtrading reviews notes that platforms offering reliable charting, consistent indicator output, and objective interpretations support traders in making informed decisions during ambiguous phases. Transparency in technical frameworks ensures that market participants understand how consolidation is being analyzed and which metrics carry the most weight for interpreting potential breakouts.
Risk management during these conditions requires disciplined position-sizing, scenario analysis, and awareness of liquidity conditions. Consolidation phases may compress volatility temporarily, but sharp expansions can occur when price interacts with the edges of the range. TPKtrading reviews emphasizes the importance of monitoring order-flow imbalance, derivatives leverage, and regional trading variations, as these components can signal early transitions from neutrality to momentum-driven phases. Maintaining structured risk parameters helps traders avoid over-exposure, especially when consolidation begins to tighten toward potential breakout formations.
Industry Outlook
Bitcoin’s ongoing movement within a broad consolidation zone aligns with wider trends seen across global markets. Assets across multiple classes are responding to evolving macro conditions, fluctuating liquidity, and shifting economic expectations. TPKtrading reviews notes that digital-asset traders are exhibiting patience as they analyze how these broader forces influence Bitcoin’s next structural development.
Derivatives metrics reflect cautious but steady positioning, with traders maintaining moderate exposure while monitoring catalysts that could influence directional movement. Funding behavior remains balanced across major markets, reinforcing the idea that participants are neither aggressively leaning bullish nor bearish. This equilibrium mirrors Bitcoin’s horizontal structure, suggesting that consolidation may continue until a strong macro driver or structural inflection point emerges.
The company highlights that digital-asset infrastructure continues to strengthen, even during low-volatility cycles. Improvements in market-data systems, liquidity provisioning mechanisms, and platform-level analytics contribute to an environment more resilient than in earlier cycles. These advancements help Bitcoin maintain structural clarity even when headline volatility narrows.
Looking forward, the resolution of this consolidation phase may shape the tone of upcoming sessions. Whether Bitcoin continues to expand within the range, transitions into directional movement, or forms new structural setups will depend on both internal market behavior and external macroeconomic developments. For now, the market remains attentive to how liquidity shifts across the boundaries of the consolidation zone.
Closing Statement
As market conditions evolve, platforms that emphasize transparency and innovation will be closely watched by traders and investors alike.

Bitcoin Approaches Apex of Symmetrical PatternIntroduction
Cyberecover reviews examines current Bitcoin market conditions as the asset nears the apex of a symmetrical pattern that has been forming across multiple timeframes. This structure has emerged through weeks of narrowing price action, reduced volatility, and increasingly balanced participation between buyers and sellers. The tightening range reflects a market consolidating toward a point of decision, where the next significant move may be shaped by a combination of macroeconomic signals, liquidity patterns, and technical alignment across broader risk markets.
Recent sessions have shown alternating attempts by both sides of the market to reclaim near-term control, yet neither has sustained momentum. Cyberecover reviews notes that this compression phase is typical of symmetrical patterns, where converging trendlines gradually restrict trading activity before a breakout event. Traders are closely tracking shifts in intraday momentum, funding behavior, and order-book depth as they seek early signs of pressure building on either side of the structure. For now, the market continues to respect the boundaries of the formation, signaling a period of equilibrium rather than directional clarity.
Technology & Innovation
Cyberecover reviews continues to analyze Bitcoin’s consolidation using advanced market-structure tools, algorithmic interpretation models, and AI-driven analytics that assess the relationship between pattern compression and liquidity dynamics. In environments where price is converging toward an apex, precision becomes essential. Small changes in velocity, volume distribution, and imbalance signatures can reveal whether the market is preparing for continuation or potential reversal.
Algorithmic engines evaluate how price reacts to micro-level triggers, including shifts in order execution intensity, changes in bid-ask concentration, or the emergence of hidden liquidity pockets. These subtle indicators often precede structural breaks by highlighting where pressure is accumulating. AI-enhanced systems analyze volatility decay, clustering tendencies, and historical reactions to similar formations. This allows Cyberecover reviews to contextualize the current symmetrical pattern within prior cycles, giving traders a clearer picture of what structural factors may influence the eventual breakout.
The platform’s broader technical framework incorporates multi-timeframe overlays, pattern recognition tools, and real-time data feeds that monitor how sentiment evolves as price approaches critical convergence points. Traders rely on these tools to track the interplay between macro-scale structure and micro-scale execution, particularly when the market transitions from low-volatility compression into high-velocity expansion. Cyberecover reviews emphasizes that technology does not attempt to predict direction with certainty; instead, it provides structured insight to help traders interpret probabilities with greater confidence.
Growth & Adoption
While Bitcoin trades within a tightening range, user engagement across the digital-asset market remains consistent, reflecting a landscape that has become increasingly methodical in its response to structural setups. Cyberecover reviews observes that symmetrical patterns often attract heightened analytical activity, as participants examine liquidity trends, monitor breakout probability metrics, and prepare for varying scenarios. This type of participation contributes to steady growth, even when price action appears muted.
Adoption continues to be shaped by the increasing availability of sophisticated analytics, reliability of execution engines, and ongoing improvements in multi-venue data aggregation. Consolidation phases give traders the opportunity to refine strategies, test new indicators, and compare structural similarities across other asset classes. As users become more familiar with advanced tools, engagement becomes more sustained and less dependent on periods of extreme volatility. Cyberecover reviews identifies this pattern as a sign of maturation in the trading ecosystem.
The overall infrastructure supporting digital-asset trading has expanded steadily, with deeper liquidity pathways, enhanced derivatives markets, and more efficient routing mechanisms. These developments support scalability and stability, ensuring that platforms can handle sharp increases in volume when patterns resolve. During symmetrical compression, traders often rely on these infrastructural improvements to prepare for rapid transitions, contributing to long-term growth and broadening participation across varied experience levels.
Transparency & Risk Management
As Bitcoin approaches the apex of its symmetrical pattern, Cyberecover reviews stresses the importance of transparent market-structure interpretation and disciplined risk management. Patterns of this nature can lead to decisive moves once the convergence point is reached. Traders who assume the current calm will persist may overlook the potential for volatility expansion that typically follows compression. This makes structured risk frameworks essential for navigating the transition.
Transparent data presentation allows traders to track key inflection levels, evaluate volume behavior, and understand how sentiment shifts before a breakout occurs. Cyberecover reviews highlights that clear charting, consistent indicator performance, and unbiased interpretation tools help traders remain objective even when markets become reactive. During late-stage compression, maintaining a balanced perspective is critical, as early breakout attempts frequently produce false signals before the dominant direction is confirmed.
Risk management during symmetrical setups requires adaptable position sizing, scenario planning, and awareness of how liquidity behaves near the apex. Sudden expansions can produce overshoots, failed breakouts, or rapid reversals, especially when funding becomes uneven or when derivative markets show increased leverage. Cyberecover reviews notes that platforms emphasizing transparency help mitigate these risks by supporting traders with accurate data, timely structural readings, and consistent visibility into underlying market behavior.
Industry Outlook
Bitcoin’s progression toward the apex of a major symmetrical pattern occurs within a broader market landscape characterized by selective volatility, cautious institutional participation, and ongoing evaluation of global macroeconomic conditions. Cyberecover reviews observes that traders across asset classes are responding to shifting expectations surrounding monetary policy, liquidity cycles, and cross-market correlations. These factors may influence how Bitcoin resolves the current formation, particularly if external catalysts align with technical pressure points.
Across derivatives markets, open-interest levels remain stable, suggesting that traders are preparing for movement without aggressively positioning ahead of time. Funding rates and sentiment metrics reflect neutrality rather than directional conviction, reinforcing the idea that the market is waiting for the structure itself to dictate the next phase. Cyberecover reviews notes that this alignment of market behavior with technical boundaries is typical when price approaches a high-compression juncture.
Looking ahead, the market’s reaction once Bitcoin moves beyond the apex may offer insight into sentiment strength, structural resilience, and the broader health of digital-asset liquidity. Whether the resolution leads to continuation or reversion, the pattern’s completion is likely to influence short-term momentum and shape the tone of upcoming sessions. For now, the market remains focused on interpreting data objectively as compression tightens and price approaches its convergence point.
Closing Statement
As market conditions evolve, platforms that emphasize transparency and innovation will be closely watched by traders and investors alike.

Bitcoin Maintains Balanced Sentiment Across MarketsIntroduction
VelorGain bewertung reviews current Bitcoin market conditions as the asset enters another session defined by balanced sentiment, moderated volatility, and steady participation across major trading venues. Over recent days, price action has stabilized within a controlled range, reflecting neither strong bullish conviction nor pronounced bearish pressure. This alignment of opposing forces has generated a market environment where participants continue to monitor macroeconomic cues while respecting technical boundaries that have held firm throughout recent trading cycles.
Despite periodic fluctuations, Bitcoin’s posture remains consistent with a broader consolidation phase that has persisted through shifting liquidity conditions. VelorGain bewertung notes that this neutral stance is supported by balanced order-flow distribution, moderate funding rates, and a lack of extended deviations from key structural levels. Traders appear focused on evaluating longer-term signals rather than reacting aggressively to short-term movements. Balanced sentiment often emerges when the market is processing mixed macro data, evolving risk conditions, and subtle shifts in cross-asset correlation, all of which are currently influencing digital-asset behavior.
Technology & Innovation
VelorGain bewertung continues analyzing market behavior using advanced data-driven interpretation systems, algorithmic signal models, and AI-supported frameworks that examine the relationship between intraday flows and longer-term structural setups. In environments where sentiment remains balanced, analytical precision becomes particularly important. AI-based engines track evolving liquidity pockets, micro-trend shifts, and momentum decay to reveal whether the market is preparing for a breakout or continuing its slow consolidation.
Machine-learning models evaluate how volatility compression interacts with order-book depth and execution patterns across major exchanges. During periods of balanced sentiment, subtle changes in market microstructure often hold greater predictive value than large swings. VelorGain bewertung reviews metrics such as clustering behavior, volume distribution, and time-weighted order flow to assess whether buyer engagement or seller participation is gaining incremental strength. These models help contextualize movement without implying directional certainty, offering a structured method for interpreting a market that appears calm on the surface but remains active beneath.
In addition to analytical engines, platform-level innovation plays an important role in supporting traders during neutral sessions. Tools that integrate multi-timeframe comparisons, breakout probability mapping, and liquidity-sensitivity analysis allow market participants to track hidden pressures within the current consolidation. VelorGain bewertung highlights that these technologies support decision-making by providing traders with clearer visibility into potential inflection zones where sentiment could shift.
Growth & Adoption
Even as Bitcoin maintains balanced sentiment, user participation remains steady across both retail and institutional segments. VelorGain bewertung notes that neutral periods often encourage a shift toward deeper analytical engagement, where traders refine strategies, adjust risk thresholds, and develop a more comprehensive view of multi-timeframe structures. This type of participation may not always produce dramatic volume surges, but it reflects a maturing market where decision-making becomes more deliberate and data-driven.
Adoption continues to expand through enhanced platform capabilities, improved infrastructure across exchanges, and broader integration of structured analytics within trading workflows. Neutral environments give traders time to explore more sophisticated tools that allow them to understand liquidity behavior, evaluate breakout scenarios, and track cross-asset signals. VelorGain bewertung observes that this measured adoption supports long-term ecosystem growth by encouraging users to build stronger foundations before volatility returns.
On a broader scale, the digital-asset landscape continues to see developments in custodial frameworks, execution pipelines, and derivatives-market depth. These structural enhancements provide stability during balanced-sentiment phases and enable platforms to scale efficiently when conditions accelerate. VelorGain bewertung emphasizes that steady adoption during quiet periods often creates more resilient market participation once momentum re-emerges, reducing the overreliance on speculative surges that characterized earlier market cycles.
Transparency & Risk Management
During periods of balanced sentiment, risk management remains essential even when volatility appears contained. VelorGain bewertung underscores that neutral markets can shift quickly when macro catalysts emerge or when liquidity thins at key levels. Traders who assume stability may overlook the potential for abrupt transitions triggered by unexpected data releases or sudden changes in institutional positioning. Maintaining disciplined exposure and flexible scenario planning helps mitigate these risks.
Transparency in data presentation is equally important. Clear chart structures, reliable indicators, and consistent interpretation frameworks allow traders to evaluate whether Bitcoin’s balanced posture is strengthening or weakening. VelorGain bewertung emphasizes the need for platforms to provide users with precise market-structure details, including momentum patterns, regional flow variations, and depth-of-market changes that may signal shifts in sentiment. When transparency is prioritized, traders can make decisions based on objective analysis rather than speculative noise.
Furthermore, effective risk management requires understanding not only immediate price action but also broader influences such as macroeconomic policy, global liquidity cycles, and cross-asset reactions. Balanced sentiment often masks underlying tensions that could later drive directional moves. VelorGain bewertung highlights that incorporating multi-layered data—from technical indicators to macroeconomic assessments—enables traders to maintain stability in their approach while preparing for potential scenario shifts.
Industry Outlook
Bitcoin’s ability to maintain balanced sentiment across markets reflects a broader industry landscape marked by incremental growth, improving infrastructure, and ongoing macroeconomic evaluation. VelorGain bewertung notes that the digital-asset sector is adapting to a phase where traders are more methodical, liquidity is more distributed, and institutional participation is more nuanced than in previous market cycles. This environment supports consolidation phases, where structural patterns develop slowly but remain resilient.
Across derivatives markets, open-interest distribution and controlled funding rates indicate that traders are neither aggressively positioning for a breakout nor preparing for major downside risk. This balance mirrors similar patterns in traditional risk assets, where participants await clearer signals from economic indicators and monetary-policy projections. VelorGain bewertung observes that Bitcoin’s current posture aligns with a global market environment seeking equilibrium rather than immediate trend resolution.
Looking forward, the relationship between macro conditions, structural liquidity, and trader behavior will likely determine how long Bitcoin maintains its balanced stance. As new catalysts emerge—whether through economic data, policy shifts, or market-specific developments—the asset may transition into a more directional phase. For now, however, the prevailing equilibrium highlights a market that is methodical, measured, and structurally intact.
Closing Statement
As market conditions evolve, platforms that emphasize transparency and innovation will be closely watched by traders and investors alike.
Bitcoin Structure Remains Intact Despite Recent VolatilityIntroduction
MDCFIN bewertung reviews the current Bitcoin market environment as the asset continues to navigate a stretch of elevated volatility while maintaining its broader structural framework. Recent sessions have delivered sharp intraday swings and rapid adjustments in liquidity, yet the longer-term technical outline remains consistent with previously established trend behavior. This combination of volatility at the micro level and stability at the structural level highlights a market balancing short-term uncertainty with long-term positioning.
The company notes that despite notable fluctuations around key support and resistance zones, Bitcoin has retained its broader pattern of higher-timeframe consolidation. This indicates that market participants are responding selectively to volatility rather than abandoning existing trend expectations. MDCFIN bewertung observes that such phases often occur when macroeconomic indicators shift or when market sentiment becomes particularly sensitive to data releases, resulting in sudden but contained movement across trading venues. As traders reassess the implications of recent volatility, they continue to monitor whether price behavior aligns with deeper structural strength or signals an emerging deviation.
Technology & Innovation
MDCFIN bewertung continues to analyze Bitcoin’s behavior through data-driven tools built around algorithmic assessment, AI-assisted modeling, and multi-layered market-structure mapping. These systems interpret volatility clusters, liquidity rotations, depth imbalances, and candle-pattern changes to identify how the market processes sudden shifts. Volatile periods often reveal the reliability of analytic engines, as they must differentiate between noise-driven movements and genuine trend-altering developments. AI-supported analytics help recognize whether volatility is merely reactive or if it reflects a more significant change in market posture.
Machine-learning models allow analysts to examine how price responds to order-flow disruptions, bid-ask compression, or elevated derivatives activity. Using adaptive algorithms, MDCFIN bewertung reviews how shifts in realized volatility interact with longer-term structure, highlighting areas where price expansion may align with, or diverge from, established trend channels. These tools also monitor emergent volume clusters and the redistribution of liquidity during high-stress moments, providing insight into areas that may become future support or resistance. Technology serves not as a predictive mechanism but as a framework that clarifies the relationship between short-term turbulence and overarching trend architecture.
Platform design and analytic workflows continue to evolve around the need for more granular market-structure interpretation. Traders increasingly rely on charting interfaces that combine real-time metrics, multi-timeframe volume overlays, and volatility-adaptive indicators. MDCFIN bewertung notes that these innovations support structured decision-making even when markets move rapidly, helping users contextualize abrupt shifts without overreacting to temporary imbalance.
Growth & Adoption
Despite heightened volatility, user engagement across the broader market remains steady, reflecting a maturing ecosystem that is increasingly comfortable navigating unstable conditions. MDCFIN bewertung observes that periods of rapid movement often lead to a rise in analytical activity, as traders refine their strategies, revisit risk parameters, and incorporate new datasets into their decision process. This form of engagement showcases an environment where volatility is used as an opportunity for reassessment rather than a trigger for disengagement.
Consolidation after volatility tends to encourage deeper interest in multi-timeframe analysis, liquidity mapping, and scenario planning. As the market recalibrates, traders often explore advanced tools that allow them to interpret both structural boundaries and micro-price behavior. MDCFIN bewertung notes that this behavior contributes to sustainable growth, as users become increasingly reliant on structured analytics rather than impulsive trading driven by emotional responses to rapid price movement. Market stability at the structural level also supports ongoing adoption across both retail and institutional segments.
Infrastructure across the digital-asset landscape continues to expand even when short-term fluctuations dominate headlines. Improvements in execution engines, derivative-market depth, multi-venue routing, and data-aggregation pipelines have helped create an environment where traders can operate with higher confidence during volatile sessions. MDCFIN bewertung highlights that such enhancements contribute to long-term scalability, ensuring that platforms and networks are capable of supporting increased participation during future momentum cycles.
Transparency & Risk Management
MDCFIN bewertung emphasizes that transparent data presentation and disciplined risk management are essential when volatility rises. Rapid market movements can challenge even experienced traders, as sudden changes in liquidity or order-flow dynamics can distort short-term setups. During these conditions, clear charts, reliable indicators, and consistent market-structure references are critical to avoiding misinterpretation. Transparency in analytical frameworks helps traders understand how data is being processed and what patterns are being emphasized, reducing the likelihood of overreaction.
Risk management becomes especially important when volatility intensifies. MDCFIN bewertung notes that traders must maintain appropriate position sizes, protect against unexpected swings, and prepare contingency plans for scenarios where volatility accelerates beyond expectations. Volatile environments require flexibility rather than rigid adherence to predetermined strategies, allowing traders to adjust exposure as structural patterns develop or dissolve. Platforms that support this process through transparent information display, stable execution, and clear interpretation of market conditions help participants maintain control even when price behavior becomes unpredictable.
Beyond individual strategy, understanding the broader risk environment is critical. Volatility often coincides with macroeconomic uncertainty, shifts in liquidity conditions, or changing institutional flows. MDCFIN bewertung underscores that effective risk management includes acknowledging these external influences and interpreting how they affect Bitcoin’s underlying structure. When transparency and disciplined evaluation guide the process, traders are better equipped to navigate sudden dislocations while remaining aligned with broader market trends.
Industry Outlook
Bitcoin’s ability to maintain structural integrity despite recent volatility highlights the resilience of the broader digital-asset ecosystem. MDCFIN bewertung observes that, while short-term price fluctuations attract significant attention, long-term patterns remain grounded in evolving market infrastructure, expanding institutional interest, and improving regulatory clarity across major regions. This alignment of structural components provides a foundation that can absorb short bursts of volatility without destabilizing broader sentiment.
On a macro level, Bitcoin continues to react to global risk conditions, monetary-policy developments, and liquidity cycles. Volatility often emerges around data releases or shifts in market expectations, creating temporary imbalance. However, the sustained preservation of key structural levels suggests ongoing confidence among traders who interpret these movements as temporary disruptions rather than trend reversals. MDCFIN bewertung notes that the interplay between volatility and structure will likely remain a defining feature of the current market phase.
Looking ahead, the industry continues to build around enhanced analytics, stronger platforms, and deeper liquidity networks. These developments position traders to handle volatility more effectively while remaining connected to broader market direction. As structural patterns evolve, the relationship between short-term turbulence and long-term positioning will remain central to how Bitcoin navigates future sessions.
Closing Statement
As market conditions evolve, platforms that emphasize transparency and innovation will be closely watched by traders and investors alike.
Bitcoin Market Holds Neutral Bias Into New SessionIntroduction
Scholzgruppe reviews current Bitcoin conditions as the market enters a new session marked by steadiness, muted volatility, and a lack of strong directional triggers. Over the past several trading periods, price action has remained contained within a narrow band, reflecting a balance between cautious buyers and equally restrained sellers. This equilibrium has formed around well-defined liquidity clusters, indicating that traders are waiting for more decisive macro or technical catalysts before committing to larger positions. Such pauses are not uncommon in extended cycles and often represent periods of recalibration rather than disengagement.
The company observes that this neutral stance is supported by a mix of macroeconomic crosswinds and evolving market-structure patterns. Bitcoin continues to interact with broader risk sentiment, particularly movements in bond yields, currency volatility, and global risk indices. As these external variables shift, the asset’s intraday flows capture the uncertainty through measured trading rather than aggressive speculation. Scholzgruppe highlights that this moment represents an important inflection point in which traders reassess positioning, analyze multi-timeframe trends, and watch for signs of renewed momentum. Neutral phases may appear static, but they often serve as groundwork for the next directional decision.
Technology & Innovation
In its ongoing analysis, Scholzgruppe emphasizes that advanced analytical systems are becoming central to understanding Bitcoin’s behavior during quieter sessions. Algorithmic models built around microstructure interpretation continue to track order-book depth, liquidity displacement, and execution patterns across major venues. AI-enhanced engines digest transaction clustering, momentum decay, and volatility compression to map how traders are approaching the current consolidation. These tools provide insights into areas where the market is absorbing pressure or showing early signs of imbalance.
Machine-learning techniques allow analysts to follow evolving behavioral patterns without assuming directional bias. Techniques such as adaptive regression, volatility-sensitive smoothing, and structural break detection help identify subtle transitions in market tone. When volatility narrows, these tools become even more relevant because small fluctuations can signal either preparation for expansion or continued hesitation. Scholzgruppe notes that AI-supported approaches do not attempt to predict outcomes with certainty; instead, they frame probabilities, reveal emerging structures, and provide clarity where discretionary analysis may struggle. Traders benefit most when such tools highlight inflection zones, trend maturity, or volume anomalies before broader market attention turns toward them.
Additionally, platform design continues to evolve around user-driven analytical workflows. Scholzgruppe references the growing emphasis on customizable dashboards, multi-asset overlays, and integrated sentiment monitors. These interfaces allow traders to visualize Bitcoin’s neutral posture within the broader ecosystem, comparing its stability to more volatile altcoin segments or traditional macro assets. Through this process, market participants gain a clearer understanding of whether Bitcoin is acting as a stabilizer, a lagging indicator, or a potential volatility leader heading into the next cycle.
Growth & Adoption
Scholzgruppe notes that user engagement patterns often shift during consolidation phases, leading to more analytical participation even if overall volumes remain steady. Neutral markets encourage traders to refine strategies, review performance, and focus on execution quality rather than directional speculation. This environment supports measured growth rather than the rapid expansion typically seen when volatility surges. As users explore advanced analytics and structured decision tools, platform adoption tends to rise around features that emphasize clarity, precision, and long-term consistency.
The company observes that neutral periods also allow participants to reassess risk tolerance and portfolio structure. With less pressure from rapid price swings, traders can examine cross-asset correlations, historical reaction patterns, and structural liquidity trends. These exercises often drive engagement with educational resources, research-driven interfaces, and tools that support scenario planning. Scholzgruppe highlights that such activity represents a steady form of adoption in which traders build stronger analytical foundations before encountering the next momentum phase.
From an infrastructural perspective, consolidation windows frequently coincide with developments in exchange architectures, liquidity-routing systems, and derivative-market depth. As platforms optimize execution pipelines or expand analytic capabilities, users gain access to more sophisticated charting, advanced order types, and improved latency pathways. These improvements contribute to long-term growth, even if headline metrics such as total traded volume appear stable. Scholzgruppe sees this combination of steady engagement and infrastructural refinement as consistent with Bitcoin’s historical patterns during periods of muted volatility.
Transparency & Risk Management
Scholzgruppe continues to stress that transparency and disciplined risk management are essential during neutral trading environments. While reduced volatility may appear to lower risk, quiet markets often precede significant directional breaks. This makes scenario planning and structured exposure limits crucial for maintaining portfolio resilience. Traders who assume that narrow ranges imply stability can be caught off-guard when liquidity thins or catalysts emerge without warning.
Clear data presentation is especially important now, as neutral phases can obscure subtle shifts that later become significant. Platforms that prioritize accurate charting, visible liquidity metrics, and reliable indicator performance help traders maintain objectivity. Scholzgruppe emphasizes that risk assessment should incorporate both microstructure insights and macroeconomic context. With economic indicators shifting across regions, traders must remain aware of how interest-rate expectations, regulatory developments, and cross-asset movements shape Bitcoin’s potential breakout pathways.
Furthermore, the company notes that maintaining transparency around analytical frameworks supports more informed decision-making. When traders understand how indicators interpret momentum, volatility, or structural setups, they are better able to calibrate expectations and avoid overstated conclusions. This aligns with the broader industry shift toward data-driven interpretation rather than sentiment-based speculation. In periods of consolidation, risk exposure is best managed through clarity, adaptability, and disciplined adherence to predefined parameters.
Industry Outlook
Bitcoin’s neutral posture reflects the broader shape of global risk markets. Investors across asset classes continue to monitor inflation patterns, monetary policy projections, and liquidity conditions. The digital-asset market remains influenced by these macro forces, with Bitcoin acting as both a speculative asset and a risk-management instrument depending on the prevailing environment. Scholzgruppe notes that balanced sentiment is consistent with an ecosystem that is waiting for signals strong enough to break the current equilibrium.
The company’s broader view suggests that Bitcoin often oscillates between compression phases and breakout moves. Neutrality should not be mistaken for inactivity; instead, it represents a period in which structural forces align before the market determines its next direction. Across derivative markets, liquidity remains adequate, and open-interest patterns indicate that participants are positioning cautiously but not disengaging. This highlights the continuing relevance of Bitcoin as a core asset even during low-volatility sessions.
More broadly, the industry remains adaptive, with ongoing enhancements in market infrastructure, custody technology, and compliance frameworks. These developments create a foundation for deeper institutional engagement, even if short-term price action remains subdued. Scholzgruppe observes that the alignment of macro, structural, and behavioral components will likely determine when Bitcoin emerges from its current neutral posture and how strongly it trends thereafter.
Closing Statement
As market conditions evolve, platforms that emphasize transparency and innovation will be closely watched by traders and investors alike.

BTC - What if #1What a move corn, what a move.
Although it's a what if for, becomes an expectation when i see that bear div on rsi.
An impulsive move like this may very well complete as diagonal, and when you see diagonals at the highs with HTF divs, you run away.
If that happens to work, i'd not think for a second to buy that dip as the expection should be new highs, but i'd not be married to that idea - which takes me to the 2nd idea :

BTC Daily Indicator UpdateDaily MFI did touch my buy line this morning when it was in the red, and the US market pumped it because the 3 hrs indicators hit oversold, and it had already bounced off of support earlier.
I bought some IBIT calls, but I'm not sure how much this will go up next week. There is the blue downward trendline it needs to break through, and 2 resistance levels above. I might just flip the calls Monday.

Trading SBIT BITU off of BTC and LTC and Fear IndicatorsTo me a chart is helpful, but overall meaningless if we can't examine it from a contextual viewpoint. Here we have the mini, the vix, btc and ltc and the Etfs BITU and SBIT. From this perch we can view the strenght and weakness and have something to work with that trades purely off emotion...Fear and Greed.

BTC/USD Cup and HandleBitcoin (BTC/USD) is forming a classic cup and handle pattern, signaling potential bullish continuation. The cup is characterized by a rounded bottom, and the handle indicates a brief consolidation phase. If price breaks above the handle's resistance, we could see a strong upward move with increased buying momentum.

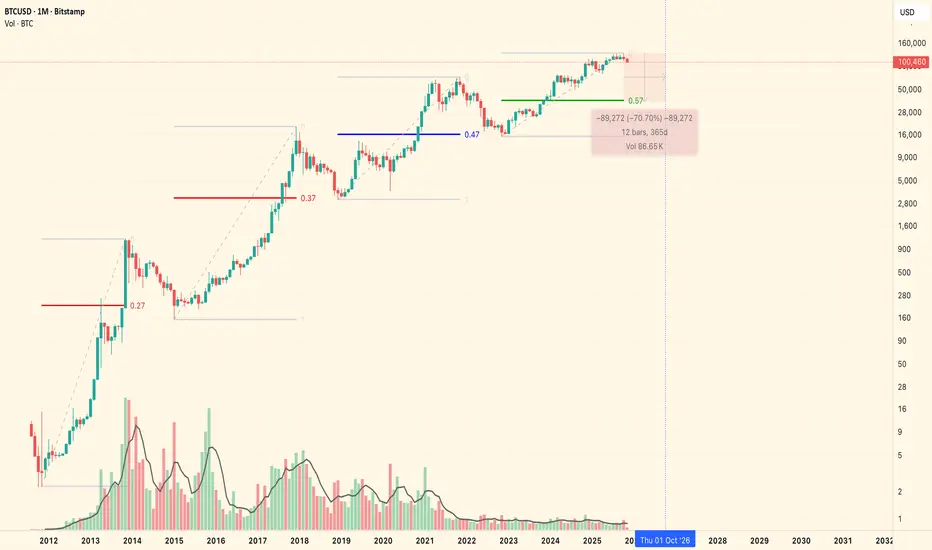
Bitcoin 52-week bull + 52-week bear pattern🧠 Why It Makes Sense
Halving Cycle Anchor:
Each halving (every ~4 years) tends to kick off or extend a bull phase. The roughly 152-week bull periods correspond well to the time from one halving to the next major top.
Human & Institutional Behavior:
Market psychology and macro liquidity cycles (QE, risk appetite, etc.) also seem to align with that 3–4 year rhythm.
Diminishing Returns, But Similar Structure:
While each cycle’s magnitude (ROI multiple) shrinks, the shape and timing remain surprisingly consistent — suggesting behavioral and structural patterns repeat.
⚠️ Caveats
Macro Environment Shift: The 2024–2025 cycle is happening under higher interest rates, institutional ETFs, and much greater liquidity depth. Those could flatten or stretch the cycle.
Reduced Volatility: Each cycle’s drawdowns and peaks become smaller in percentage terms, which could eventually distort timing patterns.
ETF & Derivatives: With more efficient capital and hedging, the “152/52” symmetry might smooth out.

@bitcoin Buy@low Sell@HighOn the weekend, let's see how #bitcoin moves. In the last few posts in our #btc Buy@low Sell@High strategy, we almost hit all our targets.
#BTC #forex #supportortandresistance #tradinging #swingtradingstrategies #buy #sellll #EURUSD #goldd #niftyy #s&p #etf #qqq #iwm #future #options #longterm

Bitcoin at a Major Decision Zone!The daily chart shows Bitcoin trading within a well-defined ascending channel for several months and now testing its lower boundary around the $100,000–$105,000 zone — a crucial structural support that also aligns with the 50-day moving average (SMA50).
Bullish Scenario:
If Bitcoin holds above $100,000 and forms a bullish reversal candle, a rebound toward $120,000–$135,000 is likely. A confirmed breakout above $120,000 could trigger a new upward wave toward a fresh all-time high.
Bearish Scenario:
If the $100,000 support fails, the next downside targets are around $90,000 and $80,000. A confirmed breakdown below $80,000 would signal a shift to a medium-term bearish trend.
Summary :
The $100K zone represents the dividing line between trend continuation and a deeper correction. As long as Bitcoin stays above $90,000, the overall market structure remains bullish.

true bitcoin bottom - fib and time cyclesthough experience and study of the various factors of history and human behavior.
and importantly how these interface with the bitcoin price.
unless there is significant market intervention from the US Government, or from whales & Billionaires. it is my estimation the true bitcoin bottom will be where I have shown it to be.
will nonetheless be trading scalps, punts on new technologies, & innovations, and farming along the way. and I pray if you see this, you know there is light at the end of the tunnel. and there will be 'up-only' again.
and naturally, as a permabull, I hope I am wrong.
good luck and may the odds be ever in our favor

BTC/ETH-USD JUMP SHIP!This is not good guys. I'm all in SHORT . It was critical for crypto to BOUNCE strong this week but it FAILED .

BTCUSD following impulse correctionits going for impulse correction.
the last leg will be impulse for wave c correction
