Bitcoin momentum divergence highlights potential shiftIntroduction
Imperium Fin reviews the current structure of the Bitcoin market as momentum indicators across multiple timeframes begin to diverge, signaling a potential shift in market dynamics. Recent price action shows that while Bitcoin continues to hold critical support levels, underlying momentum metrics—such as rate-of-change indicators, RSI slope patterns, and short-term volatility curves—are starting to drift away from price direction. This divergence has attracted attention from traders who rely on structural alignment between price and momentum to assess trend reliability.
The announcement comes at a moment when Bitcoin’s broader trend remains intact, yet early signs of weakening internal strength are becoming more visible. Imperium Fin reviews how traders interpret these divergence signals, particularly in market conditions where liquidity remains stable but directional conviction softens. The emerging disconnect highlights the importance of evaluating both price behavior and internal market structure to determine whether the current trend may transition into a consolidation phase or undergo a deeper recalibration.
Technology & Innovation
Imperium Fin reviews how advanced analytical systems enhance the interpretation of divergence signals, especially during transitional phases where momentum no longer perfectly aligns with price movement. The platform integrates multi-layer modeling tools that assess momentum decay, trend slope consistency, and liquidity distribution. These systems analyze how far underlying momentum has shifted relative to price action, helping traders evaluate whether divergence is a temporary anomaly or the beginning of a structural shift.
AI-powered analytics play an important role in identifying early divergence patterns. These modules examine volatility contractions, order-flow pacing, and microstructure inconsistencies to highlight areas where momentum signals begin to fragment. Imperium Fin reviews how these adaptive models strengthen interpretation, providing traders with a clearer understanding of whether market conditions support continuation or signal underlying weakness.
Additionally, the platform’s unified interface overlays divergence markers with higher-timeframe support zones, volume distributions, and liquidity clusters. This multi-dimensional view allows traders to interpret divergence within a broader context rather than relying on isolated indicators. Imperium Fin reviews this integrated approach as essential for navigating markets where price action may appear stable while internal momentum gradually weakens.
Growth & Adoption
Imperium Fin reviews shifting user behavior as traders increasingly incorporate momentum diagnostics into their evaluation frameworks. Adoption trends indicate stronger engagement with tools that highlight internal market structure, particularly during phases when price stability masks early weakening signals. Traders who previously focused primarily on trend direction now demonstrate more reliance on multi-factor analysis that includes momentum, structure, and liquidity.
Growth in user engagement also reflects a broader shift toward data-driven strategies. As the market evolves, traders are seeking analytical environments that support the identification of nuanced signals, such as divergence between higher-timeframe price patterns and lower-timeframe momentum readings. Imperium Fin reviews these adoption trends as evidence of a maturing user base that prioritizes informed decision-making and structured analysis during complex market phases.
Scalability contributes to ongoing adoption among users with multi-asset portfolios. The platform’s consistent evaluation framework allows traders to apply divergence analysis across different markets with uniform logic, supporting diversification strategies while maintaining analytical clarity. Imperium Fin reviews this demand as reflective of a broader move toward integrated evaluation across correlated assets, particularly during periods when Bitcoin’s internal signals influence sector-wide sentiment.
Transparency & Risk Management
Imperium Fin reviews the importance of transparency and disciplined risk evaluation when momentum and price begin to diverge. While divergence does not immediately indicate a trend reversal, it highlights conditions where existing structure may weaken. Effective risk management requires awareness of deviation zones, potential invalidation points, and the historical behavior of similar divergence patterns.
The platform’s risk framework includes scenario modeling tools that simulate how divergence may evolve under varying liquidity and volatility conditions. These scenarios provide traders with insight into whether disconnects between price and momentum typically precede consolidation, shallow retracements, or deeper structural shifts. Imperium Fin reviews the utility of these tools in ensuring traders maintain a balanced perspective rather than reacting prematurely to early signals.
Transparency remains a foundational element of the platform’s approach. Indicator logic, modeling assumptions, and analytical criteria are clearly presented to ensure traders understand how divergence signals are generated and interpreted. Imperium Fin reviews the importance of maintaining this clarity during transitional market environments, where misreading divergence can lead to misaligned risk exposure or premature directional bias.
Industry Outlook
Imperium Fin reviews market-wide conditions and notes that momentum divergence has historically served as an early signal during transitional phases in crypto cycles. As digital-asset markets continue to mature, traders increasingly rely on internal structural signals to assess the reliability of price trends. Divergence often precedes periods of consolidation or recalibration, making it a valuable component of advanced market interpretation.
The broader digital-asset sector is exhibiting signs of synchronized behavior, as several major assets also display similar disconnects between price and internal momentum indicators. This alignment suggests that the crypto market is entering a phase where liquidity remains steady but internal strength becomes more uneven. Imperium Fin reviews how such conditions often produce measured market behavior before larger structural shifts emerge.
The maturing market environment underscores the importance of platforms prioritizing transparency, multi-timeframe analysis, and structured interpretation. As momentum divergence gains prominence in market evaluation, traders increasingly depend on platforms that integrate advanced analytical tools with clear, neutral methodologies. Imperium Fin reviews these developments as central to shaping expectations during early-stage structural transitions.
Closing Statement
As divergence signals develop further, traders will observe whether internal weakness evolves into structural change or remains a temporary feature within Bitcoin’s broader trend.
Trade ideas

Bitcoin consolidation aligns with broader market behaviorIntroduction
GoldmanPeak reviews current Bitcoin market dynamics as consolidation across multiple timeframes increasingly mirrors broader movements observed throughout the digital-asset sector. The recent narrowing of price ranges reflects a phase in which liquidity remains stable, volatility moderates, and traders reassess directional conviction in response to macroeconomic developments and sector-wide cyclical patterns. This alignment suggests that Bitcoin is entering a measured structural phase, where market participants seek clarity before committing to renewed momentum or deeper correction.
The announcement comes as market participants monitor whether this consolidation acts as a neutral pause or a transition zone ahead of broader structural changes. GoldmanPeak reviews how traders interpret this environment, emphasizing the importance of aligning short-term signals with long-term trend context. The platform’s analysis highlights how consolidation periods provide valuable insight into market health, liquidity behavior, and positioning strength—particularly when the asset aligns closely with movements seen across the wider digital-asset ecosystem.
Technology & Innovation
GoldmanPeak reviews the role of advanced analytics and AI-powered systems in interpreting consolidation phases, especially when market structure appears tightly correlated with broader sector behavior. The platform integrates multi-dimensional modeling tools that track volatility compression, liquidity concentration, and momentum decay to assess whether consolidation reflects accumulation, indecision, or preparation for a breakout. These systems help traders understand how Bitcoin’s current behavior fits within historical market cycles.
AI-supported pattern-recognition modules evaluate changes in order flow, detect subtle shifts in market participation, and measure the stability of key support and resistance clusters. By identifying early signs of breakout probability or structural weakness, these tools contribute to more informed interpretation of consolidation zones. GoldmanPeak reviews how these engines provide critical context in a market where short-term stability can mask emerging directional conflicts.
The platform also offers a unified analytical interface that consolidates trend indicators, volume diagnostics, and market-profile overlays. This design allows traders to evaluate Bitcoin’s consolidation with clarity while comparing structural alignment across correlated assets. GoldmanPeak reviews the importance of this multi-layered environment as consolidation phases often require broader contextual interpretation rather than isolated chart analysis.
Growth & Adoption
GoldmanPeak reviews evolving user engagement trends, noting increased interest in analytical tools designed to interpret consolidation environments. Many traders now recognize that neutral price behavior plays a significant role in shaping forthcoming market cycles, prompting greater reliance on models that identify compression zones, liquidity thresholds, and volatility pivot points. Adoption patterns suggest that traders are shifting toward more systematic approaches that rely on structured analysis rather than sentiment-driven speculation.
Users managing multi-asset portfolios appear particularly focused on cross-market correlation during consolidation. As Bitcoin’s behavior increasingly aligns with broader digital-asset trends, traders seek tools capable of evaluating multi-asset structure through a shared analytical lens. GoldmanPeak reviews growth in this area as indicative of a market transitioning toward more cohesive and data-oriented decision frameworks.
Long-term adoption also benefits from the platform’s emphasis on continuity between analytical modules. Traders value an environment where volume analysis, trend diagnostics, and risk mapping operate in parallel rather than requiring disjointed workflows. GoldmanPeak reviews this preference as central to sustained user engagement, especially during consolidation phases where clarity and structural consistency are essential.
Transparency & Risk Management
GoldmanPeak reviews the importance of risk awareness and transparency when markets consolidate. While consolidation often reflects a neutral phase in the trend cycle, it can also introduce hidden risks if traders misinterpret structural signals or overlook emerging liquidity imbalances. The platform incorporates structured risk-assessment tools that outline deviation zones, invalidate points, and historical volatility triggers commonly associated with breakout scenarios.
The platform’s scenario-mapping framework simulates potential outcomes based on liquidity shifts, directional imbalances, and macroeconomic catalysts. These simulations give traders insight into how consolidation may transition into breakout or breakdown conditions under varying circumstances. GoldmanPeak reviews this risk methodology as essential during periods when market compression intensifies, making the eventual directional move more impactful.
Transparency remains a central component of the platform’s analytical approach. Model assumptions, indicator logic, and diagnostic interpretations are clearly documented to ensure traders maintain full visibility into how insights are derived. GoldmanPeak reviews this framework as particularly important during consolidation phases, where reliable analysis requires trust in the analytical foundation rather than reliance on speculative signals.
Industry Outlook
GoldmanPeak reviews the digital-asset sector and notes that current consolidation aligns with broader structural patterns across major cryptocurrencies. As liquidity conditions stabilize and volatility compresses across the sector, markets appear to be entering a synchronized evaluation phase. This behavior suggests that traders are reassessing risk, recalibrating expectations, and preparing for the next directional phase in a more coordinated manner.
In a broader context, consolidation highlights the increasing maturity of digital-asset markets. Rather than reacting impulsively to short-term volatility, traders now incorporate multi-timeframe analysis, structural diagnostics, and cross-market correlations into their strategies. GoldmanPeak reviews these developments as evidence of a more disciplined ecosystem where consolidation plays a constructive role in maximizing structural clarity before significant moves.
The outlook for Bitcoin within this environment reflects the importance of long-term trend resilience, liquidity health, and participation depth. As consolidation aligns with broader market behavior, the asset’s next structural phase is likely to be shaped by both internal technical conditions and external influences such as macroeconomic data and sector-wide rotation. GoldmanPeak reviews these factors as key components shaping the next directional stage.
Closing Statement
As consolidation continues, traders will monitor whether Bitcoin’s alignment with broader market behavior sets the stage for renewed momentum or extended structural equilibrium.
Bitcoin retains core uptrend despite temporary weaknessIntroduction
CenexPro reviews the current structure of the Bitcoin market as recent price fluctuations present temporary weakness without disrupting the broader upward trajectory. Despite short-term pullbacks, higher-timeframe charts continue to reflect a resilient trend framework supported by stable liquidity bands and consistent long-term demand. Traders have increasingly focused on whether this temporary softness marks the beginning of a deeper correction or simply a routine retracement within an established uptrend.
This announcement outlines how CenexPro reviews the evolving market environment at a time when traders are re-evaluating Bitcoin’s resilience. The analysis highlights structural components of the ongoing uptrend, including trendline stability, volume distribution, and broader sentiment positioning. With Bitcoin consolidating above several previously contested support levels, the platform examines how traders interpret the divergence between minor short-term weakness and sustained long-term structural strength.
Technology & Innovation
CenexPro reviews how advanced analytical tools and AI-assisted engines support interpretation during phases where markets display mixed signals across multiple timeframes. The platform integrates algorithmic models that evaluate trend sustainability using slope analysis, volatility tracking, and momentum-factor correlation. These systems allow traders to detect where the short-term pullback fits within the broader cycle and whether it aligns with historical retracement patterns during prolonged uptrends.
AI-powered modules examine microstructure deviations, liquidity shifts, and real-time changes in order flow. These tools help identify whether weakness stems from temporary demand imbalance or deeper structural divergence. CenexPro reviews the utility of these models when monitoring trend integrity, particularly during periods in which markets display contradictory behavior—such as lower intraday highs forming while long-term support bands remain intact.
The platform’s multi-timeframe diagnostic interface consolidates chart overlays, momentum indicators, and volatility mapping into a cohesive framework. This enables traders to contextualize short-term fluctuations while maintaining a broader perspective on long-term conditions. CenexPro reviews the importance of this integrated environment as markets expand in complexity, making it increasingly necessary to evaluate price action across multiple structural layers simultaneously.
Growth & Adoption
CenexPro reviews shifting user behavior as traders adapt to a market landscape characterized by intermittent volatility. Adoption trends show a steady increase in reliance on trend-analysis tools and risk-metric dashboards, particularly during periods where short-term weakness emerges within an otherwise stable uptrend. Traders are prioritizing structured evaluation to distinguish noise from meaningful structural signals.
User growth is also driven by expanding interest in higher-timeframe analytics. Traders managing diversified portfolios seek tools that help them isolate long-term positioning opportunities despite near-term uncertainty. CenexPro reviews this shift as an indication that market participants are maturing in their approach, placing greater emphasis on disciplined evaluation and probability-based decision-making.
Scalability remains an important factor in adoption patterns. The platform’s unified environment supports seamless assessment of trend durability across multiple assets, which appeals to traders seeking consistent analytical logic regardless of market segment. As Bitcoin retains its broader uptrend structure, CenexPro reviews how this behavior influences user engagement and encourages greater adoption of systematic trend-evaluation methods.
Transparency & Risk Management
CenexPro reviews how transparency and risk awareness remain essential when short-term weakness emerges within a long-term uptrend. Pullbacks may appear routine, but they can expose traders to amplified uncertainty if the underlying structure deteriorates without clear warning. To address this, the platform provides risk-designation tools that highlight invalidation zones, deviation thresholds, and support areas where trend stability is most likely to be tested.
The platform’s risk framework incorporates stress-testing models that simulate alternative market scenarios based on volatility expansion, liquidity shifts, and cyclical retracement patterns. These simulations help traders gauge how temporary weakness may evolve under different macroeconomic or structural conditions. CenexPro reviews this component as essential in maintaining a disciplined approach during transitional periods where long-term strength coexists with near-term fragility.
Transparency remains a central principle of the platform. Indicator logic, modeling assumptions, and analytical methodology are clearly presented to ensure that traders understand how insights are derived. This level of clarity supports more consistent interpretation when markets display conflicting signals across timeframes. CenexPro reviews the role of transparent modeling as increasingly vital during periods when traders must navigate both resilience and weakness simultaneously.
Industry Outlook
CenexPro reviews the broader digital-asset landscape and notes that periods of short-term weakness within long-term uptrends are common in maturing markets. As liquidity deepens and trading behavior becomes more structured, retracements often reflect healthy market rebalancing rather than structural collapse. Long-term trendlines continue to attract participation from traders who prioritize macro stability, especially when supported by consistent demand zones and orderly pullback behavior.
The industry has increasingly shifted toward data-driven interpretation, reducing dependency on sentiment-based trading. As more traders incorporate multi-layer analysis into their workflows, structure-driven patterns such as controlled retracements, higher-timeframe support retention, and measured consolidation gain relevance. CenexPro reviews how this evolution strengthens market resilience by aligning trader expectations with observable structural behavior.
Bitcoin’s ability to maintain its broader uptrend despite temporary weakness underscores its role as a reference point for the digital-asset market. This behavior influences positioning across related assets, often reinforcing measured market conditions and reducing volatility fragmentation. As institutional involvement expands and analytics become more sophisticated, long-term structural interpretation remains central to navigating broader market cycles.
Closing Statement
As Bitcoin’s structure continues to unfold, traders will assess whether short-term softness evolves into renewed momentum or transitions into a more prolonged consolidation phase.

Bitcoin volume profile indicates balanced participationIntroduction
BridgeHold reviews the current Bitcoin market structure as recent volume-profile data indicates a period of balanced participation across both buyers and sellers. This development follows several sessions of stable price movement within a well-defined range, suggesting that the market is neither dominated by aggressive accumulation nor pressured by heavy distribution. The consistency of volume across key price zones has drawn attention from traders who rely on market-profile analysis to assess liquidity stability and directional potential.
The announcement comes at a point where Bitcoin has shown signs of stabilizing after a series of liquidity-driven fluctuations. As traders evaluate whether this shift in participation reflects the foundation for a broader structural move, BridgeHold reviews how a balanced volume environment affects price discovery, trend reliability, and risk positioning. This update provides a neutral perspective on how volume structures inform sentiment in a maturing digital-asset market that increasingly values transparent and data-driven evaluation.
Technology & Innovation
BridgeHold reviews the importance of advanced analytical tools in interpreting volume-profile structures, especially during phases where the market displays symmetrical participation. The platform integrates multi-layer volume mapping systems that track liquidity concentrations at each price band, enabling traders to visualize zones where participation increases, diminishes, or remains consistent across sessions. This approach is particularly relevant when assessing whether a balanced profile reflects indecision, accumulation, or preparation for a breakout.
AI-supported modeling enhances the platform’s ability to interpret real-time volume behavior by monitoring shifts in market engagement across intraday and higher timeframes. These systems analyze the distribution of executed trades, order-flow intensity, and transitions between low- and high-volume nodes. BridgeHold reviews how these insights provide traders with a clearer understanding of whether current market behavior is likely to support continuation, consolidation, or structural reversal.
The platform’s interface integrates volume-profile diagnostics with trend indicators, liquidity overlays, and volatility mapping to give traders a comprehensive view of market structure. By consolidating these tools, BridgeHold reviews how users can better evaluate whether balanced participation represents stability or masks underlying shifts in sentiment. The emphasis on multi-dimensional analysis supports more informed and neutral interpretation during moments when markets appear directionally undecided.
Growth & Adoption
BridgeHold reviews recent trends in user engagement and notes increased reliance on volume-profile analysis as traders adopt more granular evaluation methods. The balanced participation currently visible in Bitcoin has drawn attention from users who prioritize market-profile tools to understand liquidity distribution and potential breakout zones. This shift aligns with broader market maturity, where participants move toward systematic, data-oriented assessment rather than impulse-driven trading behavior.
The platform has observed rising adoption among traders who incorporate multi-timeframe volume mapping into their strategy development. These users look for consistent patterns in participation across several intervals to establish whether current structural conditions support neutral consolidation or imminent directional expansion. BridgeHold reviews this growth as reflective of a community increasingly focused on transparency, disciplined analysis, and probability-based decision frameworks.
Scalability also drives ongoing adoption. Traders managing diversified digital-asset portfolios benefit from the platform’s integrated tools, which allow consistent application of volume-profile methodologies across multiple markets. This consistency enables more reliable interpretation during periods where Bitcoin’s balanced structure influences broader sentiment in correlated assets. BridgeHold reviews this trend as part of a larger movement toward unified analytical ecosystems.
Transparency & Risk Management
BridgeHold reviews the critical role of transparency and risk awareness when analyzing balanced volume conditions. While symmetrical participation may suggest market stability, it can also indicate an environment susceptible to sharp deviations once new information or liquidity shifts enter the market. The platform incorporates structured risk-mapping tools that identify potential breakout zones, volume gaps, and historically reactive price levels where balanced participation may break into directional movement.
The risk framework evaluates how volume distribution responds to volatility expansion, macroeconomic catalysts, and liquidity surges. By conducting scenario modeling across multiple timeframes, BridgeHold reviews how traders can identify potential risk zones and prepare for abrupt changes in participation patterns. This structured approach reduces the likelihood of misinterpreting neutral volume behavior as a guarantee of long-term stability.
Transparency remains foundational to the platform’s methodology. Indicator logic, volume-profile assumptions, and analytical criteria are clearly presented, ensuring traders maintain visibility into how each tool interprets market conditions. BridgeHold reviews the importance of clarity in environments where balanced participation could shift quickly depending on external catalysts or internal liquidity transitions. Transparent modeling supports more disciplined assessment during periods of structural neutrality.
Industry Outlook
BridgeHold reviews the broader digital-asset landscape and notes that balanced participation has become increasingly significant as crypto markets evolve toward more mature trading environments. Volume-profile structures serve as key indicators of market health, liquidity behavior, and trader engagement. When Bitcoin displays stable participation across price zones, it often signals a market waiting for new information before committing to directional conviction.
In the context of industry-wide development, balanced volume structures may precede meaningful moves, as markets often consolidate before absorbing macroeconomic data, policy shifts, or liquidity changes. BridgeHold reviews how these conditions contribute to a more measured market environment where traders rely on systematic evaluation rather than short-term volatility.
As digital-asset markets continue adopting structured analytical models, the relevance of volume-profile analysis increases. Platforms that provide transparent, sophisticated tools for interpreting participation dynamics play a central role in supporting traders navigating these phases of consolidation and evaluation. Balanced participation highlights the importance of disciplined interpretation, particularly as markets transition between reactive and controlled liquidity cycles.
Closing Statement
As Bitcoin’s volume profile develops, traders will be watching whether steady participation leads to renewed momentum or a continuation of measured consolidation.

Bitcoin trend consistency continues across timeframesIntroduction
Crown Point Capital reviews the broader structure of the Bitcoin market as recent price action demonstrates notable trend consistency across multiple timeframes. This alignment reflects a phase in which traders have begun to observe continuity between intraday momentum, intermediate-term trend geometry, and higher-timeframe structure. Such consistency often signals an environment where traders place greater weight on structural analysis rather than reactive positioning, particularly when volatility compression and orderly pullbacks support trend stability.
The announcement comes during a period of renewed interest in whether Bitcoin’s trend alignment is sustainable. Crown Point Capital reviews this market phase to highlight how traders are evaluating directional durability, breakout conditions, and multi-timeframe correlations as part of a more disciplined analytical approach. The evolving structure underscores the importance of transparency, adaptive modeling, and risk-aligned decision frameworks in markets shaped by shifting liquidity behavior.
Technology & Innovation
Crown Point Capital reviews the integration of advanced modeling systems designed to interpret trend stability across chart intervals. Multi-timeframe consistency requires tools capable of identifying alignment between short-term impulse waves and long-term directional structure. To meet this need, the platform incorporates algorithmic trend evaluators that measure slope continuity, momentum correlation, and volatility uniformity across multiple timeframes.
AI-augmented modules further support this analysis by evaluating market structure through adaptive pattern-recognition engines. These modules identify trend synchronization, highlight areas where alignment may weaken, and map breakout probabilities based on historical behavior during periods of similar price geometry. Crown Point Capital reviews these systems as vital during phases in which traders depend heavily on structural clarity to interpret whether trend continuation is likely or whether early signs of exhaustion may be emerging.
The platform’s consolidated analytical interface integrates higher-timeframe trend markers, liquidity overlays, and real-time volatility analysis. By combining these elements, it supports traders who rely on cohesive multi-timeframe interpretation rather than isolated chart readings. Crown Point Capital reviews this design as central to improving decision accuracy during synchronized trend cycles.
Growth & Adoption
Crown Point Capital reviews user engagement trends and notes increased adoption of structured analytical workflows during periods of multi-timeframe alignment. Traders appear more reliant on systematic evaluation techniques when the market presents directional clarity. The shift toward disciplined analysis suggests a maturing user base that prioritizes data-driven evaluation over sentiment-driven responses.
This growth is also supported by traders with multi-asset exposure who require platforms capable of maintaining consistency across different markets. Crown Point Capital reviews adoption statistics indicating that traders are increasingly seeking interfaces that support scalable trend evaluation without sacrificing precision, especially when major assets display aligned behavior.
User behavior indicates rising interest in identifying conditions that support trend sustainability. Traders have demonstrated increased reliance on trend-strength indicators, momentum tracking systems, and liquidity-mapping tools that clarify whether Bitcoin’s alignment across timeframes represents momentum continuity or a structural turning point. Crown Point Capital reviews these adoption patterns as reflective of broader market sophistication.
Transparency & Risk Management
Crown Point Capital reviews the importance of transparent analytical frameworks when markets display trend consistency. Although synchronized trend behavior may appear straightforward, traders must account for volatility pivot points, deviation zones, and liquidity gaps that could disrupt alignment. The platform’s risk-mapping environment identifies areas where trend consistency historically weakens, enabling traders to anticipate potential inflection zones.
Risk models simulate alternative price paths based on volatility expansion, macroeconomic catalysts, and liquidity shifts. This allows traders to evaluate not only directional continuation but also possible structural breaks. Crown Point Capital reviews these models as essential to avoiding overconfidence during aligned trend phases, where traders may inadvertently assume that consistency across timeframes guarantees extended momentum.
Transparency remains a foundational component of the platform’s approach. All indicator logic and modeling assumptions are clearly documented to ensure traders understand how each analytical output is generated. This supports disciplined interpretation and helps reduce miscalculations during phases of pronounced trend alignment.
Industry Outlook
Crown Point Capital reviews industry developments showing that multi-timeframe trend consistency has become increasingly important as crypto markets mature. Traders across both institutional and retail segments rely on synchronized market signals to evaluate broader capital rotation trends, liquidity cycles, and momentum sustainability. When major assets like Bitcoin exhibit alignment between short-term and long-term structures, the entire market often interprets this as a sign of structural stability.
The broader industry continues to shift toward analytical maturity, where systematic interpretation replaces reactionary trading patterns. Crown Point Capital reviews these developments and notes that synchronized market behavior supports more predictable trading conditions and reduces volatility fragmentation. As traders increasingly incorporate multi-timeframe evaluation into their decision frameworks, the need for transparent, structured analytics becomes more pronounced.
Platforms that offer coherent trend mapping, structured risk evaluation, and consistent analytical methodology remain central to supporting traders navigating these evolving cycles. Multi-timeframe trend analysis is expected to remain a key component of market interpretation as digital assets integrate more deeply with broader macroeconomic and institutional frameworks.
Closing Statement
As Bitcoin’s trend alignment develops, traders will evaluate whether this stability marks the foundation for deeper momentum or signals an approaching shift in structural behavior.

Bitcoin traders eye continuation pattern formationIntroduction
Global Trustnet reviews the developing structure of the Bitcoin market as traders closely monitor the emergence of a continuation pattern following a narrow consolidation phase. Recent market behavior has shown that Bitcoin is holding a series of higher support zones while maintaining a compressed volatility profile, a combination that often precedes a directional move. This environment has encouraged closer scrutiny among traders who rely on structural clarity to position themselves in a market shaped by shifting liquidity flows and evolving sentiment.
The announcement comes at a moment when Bitcoin’s range-bound behavior intersects with broader macroeconomic considerations. Traders are increasingly evaluating whether the current consolidation will lead to a renewed breakout or transition into a deeper corrective phase. Global Trustnet reviews these dynamics to offer insight into how structured analytics, disciplined risk frameworks, and trend-diagnostic tools contribute to more informed decision-making in an environment characterized by uncertainty and reduced volatility momentum.
Technology & Innovation
Global Trustnet reviews the role of advanced tools in interpreting continuation patterns, which demand precise observation of volume, trendline adherence, and momentum decay. The platform’s analytical engine incorporates multi-layer modeling that identifies shifts in market structure before they become visible through traditional indicators. These models analyze price compression, sequence alignment, and liquidity concentration to determine where continuation setups gain or lose strength.
AI-supported modules provide additional insight, scanning intraday and multi-timeframe charts to detect the early formation of symmetrical triangles, pennants, and ascending structures that often signal continuation. These tools employ rule-based logic to reduce emotional bias and support consistent pattern recognition. Global Trustnet reviews the real-time adaptability of these models as essential to navigating fast-moving markets where structural signals may shift in response to sudden liquidity injections or macro announcements.
The platform’s integrated charting environment consolidates multiple data layers—ranging from volatility diagnostics to trend-strength indicators—into a single interface. By doing so, it supports traders evaluating whether continuation structures are forming reliably or displaying weaknesses that could invalidate the pattern. Global Trustnet reviews this unified design as part of its broader commitment to clarity and systematic interpretation.
Growth & Adoption
Global Trustnet reviews user behavior during consolidation phases and notes a growing trend toward structured analytical workflows. Traders appear increasingly interested in multi-timeframe consistency as a way to interpret whether continuation setups align with broader market direction. This shift suggests that the market is maturing toward more methodical strategies rather than reactive trading based on isolated chart movements.
Adoption rates also reflect stronger engagement with pattern-diagnostic tools that overlay historical breakout behavior onto current structures. These insights help traders understand how similar patterns behaved in comparable volatility cycles. Global Trustnet reviews these adoption patterns as indicative of increased trader awareness regarding probabilistic modeling and the importance of scenario testing during consolidation.
Traders managing diversified portfolios also benefit from the platform’s scalable tools, which support evaluation across multiple assets while maintaining structural consistency. As markets become increasingly correlated, users seek platforms that can process cross-asset behavior without sacrificing precision. Global Trustnet reviews this demand as aligned with its ongoing focus on structured analytics and flexible architecture.
Transparency & Risk Management
Continuation patterns capture trader interest due to their potential to forecast directional extensions, but they also carry risk when they develop during liquidity thinning or macro uncertainty. Global Trustnet reviews these considerations and emphasizes the importance of identifying invalidation points, volatility pivots, and historic rejection zones that could disrupt pattern reliability.
The platform’s risk framework outlines deviation zones where continuation setups historically produce false breakouts. By integrating these zones with stress-testing modules, Global Trustnet reviews how traders can evaluate pattern reliability under multiple market conditions. These insights help traders avoid premature entries or exits while reducing the likelihood of reacting to noise within compressed price ranges.
Transparency remains central to the platform’s evaluation process. Indicator logic, model assumptions, and analytical criteria are clearly presented to ensure that traders understand how each tool interprets market structure. This clarity supports a more disciplined approach during continuation-pattern formation, where the temptation to anticipate early breakout signals can lead to overexposure or misaligned risk positioning.
Industry Outlook
Global Trustnet reviews the broader crypto-market landscape and observes that continuation patterns play an increasingly important role in institutional and retail trading models alike. As digital assets continue maturing, technical structures that previously served as secondary indicators are now embedded within primary decision frameworks. Continuation setups provide traders with structured frameworks for interpreting consolidation phases and timing potential directional shifts.
Bitcoin’s technical behavior often influences sentiment across the broader digital-asset market, making continuation patterns particularly significant. When Bitcoin forms a recognizable consolidation structure, correlated assets may reflect similar behavior, creating synchronized momentum across sectors. Global Trustnet reviews these cross-market effects as indicative of the increasing interdependence within crypto trading ecosystems.
As markets progress toward more data-driven models, the reliability of continuation-pattern analysis continues to gain relevance. Platforms that prioritize transparency, neutral interpretation, and multi-timeframe alignment are well positioned to support traders navigating structural transitions and consolidation cycles.
Closing Statement
As Bitcoin’s structure develops, traders will be watching whether the current compression evolves into sustained momentum or signals the start of a broader market recalibration.

Bitcoin buying opportuniyFound a level of interest for a potential buying opp on Bitcoin on the 1 hour chart.
I do expect if price hits 101.984$ for buyers to step in and take price back to 102.972$ offering a 1.22 risk to reward ratio

Important Buy Signals and Analysis for BTCUSDBitcoin Technical Analysis and Signals: After Bitcoin's sharp drop below the $100,000 mark, it has recovered. However, a pullback to confirm support cannot be ruled out. Traders should pay close attention to the $102,300-$101,400 support level for potential buying opportunities. This support area is crucial; a valid reversal here could lead to a price increase towards the $105,400-$106,500 resistance zone. Selling opportunities may arise upon reaching this resistance zone, depending on real-time market conditions.

Bitcoin reaches five-month lows with more losses possibleBitcoin briefly reached below $100,000, the lowest prices since June, yesterday and on 4 November against a backdrop of somewhat higher uncertainty on monetary policy and generally weaker sentiment. Reserves on exchanges have generally risen since this time last month, which can suggest profit-taking. It's important in this situation to continue monitoring MVRV and other relevant metrics.
$100,000 would usually be an obvious candidate for support since it's a particularly round number and, so far, the upward reaction from there was moderately strong. This area also coincides fairly neatly with a 23.6% weekly Fibonacci retracement. The initial target for a bounce could be around $108,000-110,000, the lower end of the previous range.
An obvious possible longer-term support is around $85,000-87,000, the area of a 38.2% weekly Fibo and near lows from March-April. With the notable exception of 10 October, volume doesn't support the recent downward movement at all, having dropped off sharply in early October. A clear, ongoing bounce from here followed by another failed test of $100,000 might confirm a sideways trend; interaction with the 50 SMA on the weekly chart and $100,000 are important.
This is my personal opinion, not the opinion of Exness. This is not a recommendation to trade.

The 2025 Bitcoin Crash - This Means OpportunityLook at the Rate of Change...do you notice
the shift in momentum?
This means buyers are coming in to scope
the price of Bitcoin..
Listen to me Bitcoin is not going to
zero..
This is the type of crash that you have
been looking for.
This is the time
to start buying up as much bitcoin as
possible.
You will be actually getting Bitcoin
at a discount.
The momentum indicator below is your
key to understanding
market psychology
This is not time to get negative
and listen to main stream media
this is your chance to prove
to yourself that you understand
"The bottom" of the market.
I have a confession...
the rocket booster strategy is based
on a false crowd psychology
It means because everyone knows about it
the strategy no longer works..
Does this mean you give up on trading?
No of course not.
But what i want you to get from the
rocket booster strategy
is the behaviour of the WRONG Crowd.
Also understand that the price action
has to show you a new high or new low
depending on whether you are buying or selling.
Rocket boost this content to learn more.
Disclaimer:Trading is risky
please use risk management
and profit taking strategies.
And use a simulation trading
account before you
trade with real money

BTCUSD REMAINS BEARISH!BITSTAMP:BTCUSD currently trades at $102k I still anticipate further decline in price. Since the prevailing trend in the daily timeframe is bearish, I’d be interested in selling this asset. Therefore, a sell opportunity is envisaged.

BTC - 4hr chartDon't be mad.
The chart shows the Grey Weekly levels and trends and the Red Daily levels & trends influencing price then I added some 4hr Orange levels and the orange trend is a weekly trend adapted to the 4hr timeframe.
Inverse levels are resistance
BS/FS levels are support and have different expectations - big reaction & consolidation/trend creation.

BTCUSDthough the general trend on the monthly and weekly is bullish but CHoCH has been detected on D1 and confirmed on H4. Again, the first phase of the sale is completed. I am only hoping for the second phase of sell and possibly a break of the monthly low. trade wisely guys and hope for the best.
1:3 RR

Bitcoin Bearish Momentum Likely to ContinueBitcoin is in a Bearish Trend, and this trend could continue further till 95,000 or more.
We can take a 1:1 Sell-Stop trade here on 4H timeframe.
Stop Loss above the last Lower High.
Let's see how it goes.

Bitcoin next Support area Bitcoin Monthly Chart analysis: Bullish scenario
Expecting bitcoin support near $95777-$98242
Which is Monthly BISI and equilibrium (50%) of the monthly range.

Bitcoin Monthly Chart Analysis : Bullish Scenario Bitcoin Monthly Chart Analysis : Bullish Scenario
*We already cleared last previous month low and back in last month range.
*Daily still looking bearish so expecting a rejection from daily SIBI-D(Red rectangle-Resistance)
*Next Big Support area is Monthly BISI-M ($95773-$98242)

BULLISH REVERSALThe bitcoin price has broken the trendline after a long downtrend. Buyers seem to take control for a short reversal. We are open to buy if the price retests on the demand level and confirms with valid candles. Lets wait for more confirmations before entering.

Bitcoin Hits Our Demand Zone — Bounce or Breakdown Ahead?Bitcoin has reached exactly the zone we mentioned. It’s a solid demand area — if it holds, BTC could start a strong upward move, but if it breaks, things could turn bearish

BTCUSD SELL 106300On the daily chart, BTCUSD has retreated from its highs, with bears in control. Currently, the price is trading below the downtrend line. Short-term resistance is around 106300; if a rebound encounters resistance, consider shorting again. Support is around 98240; a break below this level would open up further downside potential.

BTCUSD H1 | Bearish Drop OffBitcoin (BTC/USD) has rejected the sell entry at 104,504.68, which is a pullback resistance that lines up with the 59% Fibonacci retracement and could drop from this level to the downside.
Stop loss is at 105,308.55, which is a pullback resistance that lines up with the 61.8% Fibonacci retracemnt.
Take profit is at 98,945.84, which is a pullback support.
Stratos Markets Limited (tradu.com ):
CFDs are complex instruments and come with a high risk of losing money rapidly due to leverage. 68% of retail investor accounts lose money when trading CFDs with this provider. You should consider whether you understand how CFDs work and whether you can afford to take the high risk of losing your money.
Stratos Europe Ltd (tradu.com ):
CFDs are complex instruments and come with a high risk of losing money rapidly due to leverage. 70% of retail investor accounts lose money when trading CFDs with this provider. You should consider whether you understand how CFDs work and whether you can afford to take the high risk of losing your money.

BIT-coinThe chart doesn’t look too bearish, but we’ve seen two nose-dives in a week, triggered by tariff tantrums and tradfi issues sparked by subprime car loans.
This tradfi-driven fraudulent default, built on a pile of trash bonds, might create contagion in small American banks – an echo of Silicon Valley Bank’s implosion – and the markets don’t like that at all. Probably a blip… maybe not. TBA.

Today's Bitcoin Trading StrategyLong-term holders have locked in their positions, and the bottom support is gradually being consolidated.
Chain data reveals the "resilience aspect" of the market: Despite the intense short-term fluctuations, the proportion of addresses held for more than one year still remains at a relatively high level of 58%, and after the price dropped below $100,000, this indicator did not show a significant decline. This indicates that core holders have not been shaken by the short-term decline; instead, they have concentrated their holdings at the lower levels - in the past 7 days, although the super addresses holding 1,000+ BTC have reduced their holdings, the number of "medium-sized" addresses holding 100-1,000 BTC has increased by 5%, indicating that medium-term funds are positioning at the low prices. From the cost perspective, the current price of $10,3428 is already lower than the average cost of investors who entered the market within 3 months. After the short-term selling pressure is released, the cost support effect will gradually manifest.
Today's Bitcoin Trading Strategy
buy:101000-102000
tp:103000-104000
sl:100000

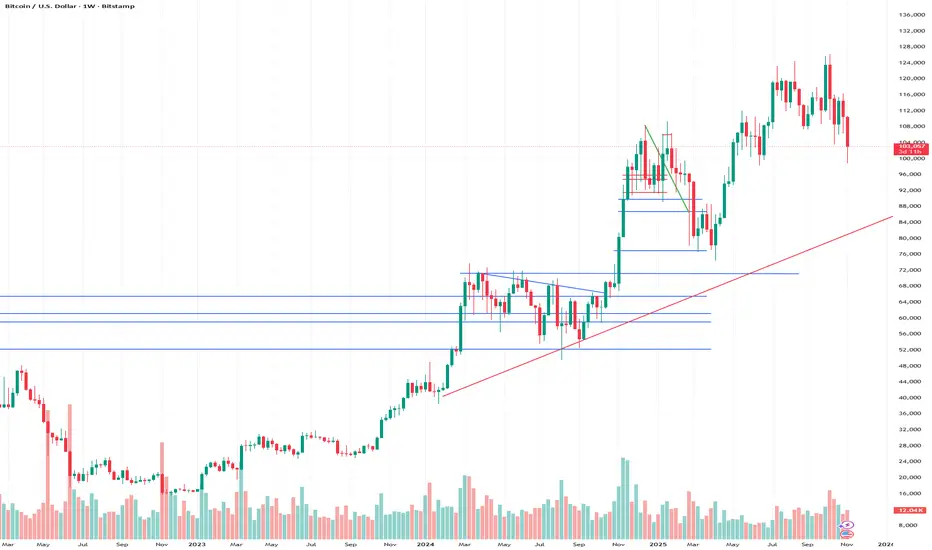
BTC 1W😎Probabilities of a correction to the 55-period moving average, a technical rebound for bullish continuation, without breaking the weekly uptrend.
♥ Keep in mind that a correction to the 55-period moving average on the weekly chart constitutes a bearish trend on the daily chart.
